Estimated zip code population in 2022: 35,918 Zip code population in 2010: 25,160 Zip code population in 2000: 18,229
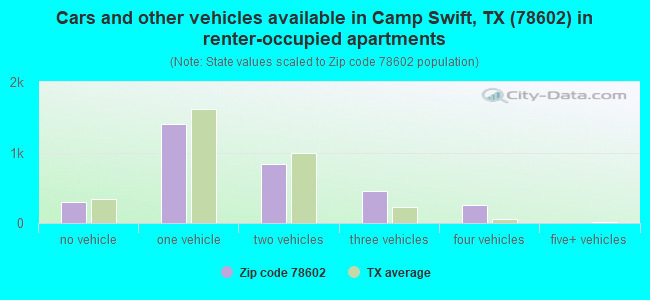
Houses and condos: 13,958 Renter-occupied apartments: 3,269
% of renters here:
25%
State:
38%
March 2022 cost of living index in zip code 78602: 91.8 (less than average, U.S. average is 100)
Land area: 193.6 sq. mi. Water area: 3.7 sq. mi.
Population density: 186 people per square mile
(very low).
OSM Map
General Map
Google Map
MSN Map
OSM Map
General Map
Google Map
MSN Map
OSM Map
General Map
Google Map
MSN Map
OSM Map
General Map
Google Map
MSN Map
Please wait while loading the map...
Real estate property taxes paid for housing units in 2022:
This zip code:
1.6% ($4,519)
Texas:
1.5% ($4,050)
Median real estate property taxes paid for housing units with mortgages in 2022: $5,088 (1.6%) Median real estate property taxes paid for housing units with no mortgage in 2022: $3,807 (1.4%)
Averages for the 2020 tax year for zip code 78602, filed in 2021:
Average Adjusted Gross Income (AGI) in 2020: $65,183 (Individual Income Tax Returns)
Here:
$65,183
State:
$77,054
Salary/wage: $55,664 (reported on 80.2% of returns)
Here:
$55,664
State:
$62,766
(% of AGI for various income ranges: 1166.9% for AGIs below $25k, 3531.4% for AGIs $25k-50k, 6496.9% for AGIs $50k-75k, 9400.4% for AGIs $75k-100k, 17335.7% for AGIs $100k-200k, 55589.5% for AGIs over 200k)
Taxable interest for individuals: $1,744 (reported on 25.4% of returns)
This zip code:
$1,744
Texas:
$2,665
(% of AGI for various income ranges: 13.6% for AGIs below $25k, 17.8% for AGIs $25k-50k, 39.1% for AGIs $50k-75k, 55.3% for AGIs $75k-100k, 87.1% for AGIs $100k-200k, 1811.6% for AGIs over 200k)
Ordinary dividends: $5,213 (reported on 13.7% of returns)
Here:
$5,213
State:
$10,044
(% of AGI for various income ranges: 15.3% for AGIs below $25k, 26.0% for AGIs $25k-50k, 57.8% for AGIs $50k-75k, 97.9% for AGIs $75k-100k, 221.0% for AGIs $100k-200k, 2542.6% for AGIs over 200k)
Net capital gain/loss in AGI: +$21,484 (reported on 13.6% of returns)
Here:
+$21,484
State:
+$39,590
(% of AGI for various income ranges: 8.2% for AGIs below $25k, 26.7% for AGIs $25k-50k, 93.0% for AGIs $50k-75k, 170.9% for AGIs $75k-100k, 605.9% for AGIs $100k-200k, 17178.4% for AGIs over 200k)
Profit/loss from business: +$14,218 (reported on 19.6% of returns)
Here:
+$14,218
State:
+$10,888
(% of AGI for various income ranges: 235.7% for AGIs below $25k, 250.0% for AGIs $25k-50k, 310.9% for AGIs $50k-75k, 428.7% for AGIs $75k-100k, 589.8% for AGIs $100k-200k, 5178.4% for AGIs over 200k)
Taxable individual retirement arrangement distribution: $21,312 (reported on 7.4% of returns)
78602:
$21,312
Texas:
$24,740
(% of AGI for various income ranges: 33.0% for AGIs below $25k, 74.8% for AGIs $25k-50k, 137.9% for AGIs $50k-75k, 363.7% for AGIs $75k-100k, 709.9% for AGIs $100k-200k, 2836.8% for AGIs over 200k)
Self-employed (Keogh) retirement plans: $16,650 (reported on 0.3% of returns)
78602:
$16,650
Texas:
$29,298
(% of AGI for various income ranges: 51.6% for AGIs $100k-200k)
Total itemized deductions: $30,698 (reported on 6.2% of returns)
Here:
$30,698
State:
$40,428
(% of AGI for various income ranges: 40.5% for AGIs below $25k, 90.5% for AGIs $25k-50k, 216.0% for AGIs $50k-75k, 392.7% for AGIs $75k-100k, 788.1% for AGIs $100k-200k, 3733.7% for AGIs over 200k)
Charity contributions: $10,553 (reported on 4.6% of returns)
Here:
$10,553
State:
$18,201
(% of AGI for various income ranges: 3.6% for AGIs below $25k, 14.8% for AGIs $25k-50k, 29.4% for AGIs $50k-75k, 66.6% for AGIs $75k-100k, 213.6% for AGIs $100k-200k, 1506.8% for AGIs over 200k)
Taxes paid: $7,063 (reported on 6.2% of returns)
78602:
$7,063
State:
$7,821
(% of AGI for various income ranges: 8.1% for AGIs below $25k, 18.4% for AGIs $25k-50k, 56.4% for AGIs $50k-75k, 85.8% for AGIs $75k-100k, 197.1% for AGIs $100k-200k, 777.9% for AGIs over 200k)
Earned income credit: $2,393 (reported on 16.7% of returns)
Here:
$2,393
State:
$2,584
(% of AGI for various income ranges: 115.1% for AGIs below $25k, 70.9% for AGIs $25k-50k, 1.5% for AGIs $50k-75k)
Percentage of individuals using paid preparers for their 2020 taxes: 91.2%
Here:
91%
State:
92%
(% for various income ranges: 90.3% for AGIs below $25k, 92.1% for AGIs $25k-50k, 90.3% for AGIs $50k-75k, 91.7% for AGIs $75k-100k, 91.6% for AGIs $100k-200k, 91.8% for AGIs over 200k)
Averages for the 2012 tax year for zip code 78602, filed in 2013:
Average Adjusted Gross Income (AGI) in 2012: $54,781 (Individual Income Tax Returns)
Here:
$54,781
State:
$65,384
Salary/wage: $44,903 (reported on 83.0% of returns)
Here:
$44,903
State:
$52,524
(% of AGI for various income ranges: 76.2% for AGIs below $25k, 77.3% for AGIs $25k-50k, 77.3% for AGIs $50k-75k, 74.3% for AGIs $75k-100k, 71.2% for AGIs $100k-200k, 39.5% for AGIs over 200k)
Taxable interest for individuals: $1,594 (reported on 28.8% of returns)
This zip code:
$1,594
Texas:
$2,372
(% of AGI for various income ranges: 1.3% for AGIs below $25k, 0.7% for AGIs $25k-50k, 0.5% for AGIs $50k-75k, 0.4% for AGIs $75k-100k, 0.6% for AGIs $100k-200k, 1.6% for AGIs over 200k)
Ordinary dividends: $4,422 (reported on 13.4% of returns)
Here:
$4,422
State:
$9,721
(% of AGI for various income ranges: 0.9% for AGIs below $25k, 0.7% for AGIs $25k-50k, 0.8% for AGIs $50k-75k, 0.6% for AGIs $75k-100k, 1.0% for AGIs $100k-200k, 2.2% for AGIs over 200k)
Net capital gain/loss in AGI: +$11,665 (reported on 12.1% of returns)
Here:
+$11,665
State:
+$35,319
(% of AGI for various income ranges: 0.4% for AGIs $25k-50k, 0.8% for AGIs $50k-75k, 1.0% for AGIs $75k-100k, 1.4% for AGIs $100k-200k, 9.9% for AGIs over 200k)
Profit/loss from business: +$14,566 (reported on 18.4% of returns)
Here:
+$14,566
State:
+$13,732
(% of AGI for various income ranges: 9.8% for AGIs below $25k, 5.1% for AGIs $25k-50k, 2.8% for AGIs $50k-75k, 4.0% for AGIs $75k-100k, 4.7% for AGIs $100k-200k, 5.1% for AGIs over 200k)
Taxable individual retirement arrangement distribution: $16,494 (reported on 7.8% of returns)
78602:
$16,494
Texas:
$19,511
(% of AGI for various income ranges: 1.6% for AGIs below $25k, 1.9% for AGIs $25k-50k, 2.1% for AGIs $50k-75k, 3.0% for AGIs $75k-100k, 3.1% for AGIs $100k-200k, 1.7% for AGIs over 200k)
Self-employment retirement plans: $15,975 (reported on 0.4% of returns)
78602:
$15,975
Texas:
$23,938
Total itemized deductions: $20,482 (19% of AGI, reported on 25.6% of returns)
Here:
$20,482
State:
$24,724
Here:
19.4% of AGI
State:
15.9% of AGI
(% of AGI for various income ranges: 7.0% for AGIs below $25k, 8.5% for AGIs $25k-50k, 12.5% for AGIs $50k-75k, 10.5% for AGIs $75k-100k, 11.2% for AGIs $100k-200k, 6.4% for AGIs over 200k)
Charity contributions: $3,955 (reported on 18.4% of returns)
Here:
$3,955
State:
$6,808
(% of AGI for various income ranges: 0.5% for AGIs below $25k, 0.9% for AGIs $25k-50k, 1.3% for AGIs $50k-75k, 1.5% for AGIs $75k-100k, 1.7% for AGIs $100k-200k, 1.5% for AGIs over 200k)
Taxes paid: $6,327 (reported on 25.0% of returns)
78602:
$6,327
State:
$6,921
(% of AGI for various income ranges: 1.5% for AGIs below $25k, 2.1% for AGIs $25k-50k, 3.8% for AGIs $50k-75k, 3.2% for AGIs $75k-100k, 3.5% for AGIs $100k-200k, 2.5% for AGIs over 200k)
Earned income credit: $2,375 (reported on 20.5% of returns)
Here:
$2,375
State:
$2,570
(% of AGI for various income ranges: 7.7% for AGIs below $25k, 1.3% for AGIs $25k-50k)
Percentage of individuals using paid preparers for their 2012 taxes: 45.7%
Here:
46%
State:
51%
(% for various income ranges: 43.3% for AGIs below $25k, 44.0% for AGIs $25k-50k, 46.9% for AGIs $50k-75k, 45.7% for AGIs $75k-100k, 51.8% for AGIs $100k-200k, 68.0% for AGIs over 200k)
Averages for the 2004 tax year for zip code 78602, filed in 2005:
Average Adjusted Gross Income (AGI) in 2004: $45,267 (Individual Income Tax Returns)
Here:
$45,267
State:
$47,881
Salary/wage: $40,369 (reported on 84.5% of returns)
Here:
$40,369
State:
$41,947
(% of AGI for various income ranges: 134.6% for AGIs below $10k, 77.5% for AGIs $10k-25k, 82.1% for AGIs $25k-50k, 80.8% for AGIs $50k-75k, 83.3% for AGIs $75k-100k, 59.6% for AGIs over 100k)
Taxable interest for individuals: $1,735 (reported on 34.3% of returns)
This zip code:
$1,735
Texas:
$2,255
(% of AGI for various income ranges: 8.3% for AGIs below $10k, 2.0% for AGIs $10k-25k, 1.2% for AGIs $25k-50k, 1.0% for AGIs $50k-75k, 0.7% for AGIs $75k-100k, 1.5% for AGIs over 100k)
Taxable dividends: $2,751 (reported on 17.2% of returns)
Here:
$2,751
State:
$4,261
(% of AGI for various income ranges: 4.0% for AGIs below $10k, 1.0% for AGIs $10k-25k, 0.5% for AGIs $25k-50k, 0.6% for AGIs $50k-75k, 0.6% for AGIs $75k-100k, 1.9% for AGIs over 100k)
Net capital gain/loss: +$14,341 (reported on 15.6% of returns)
Here:
+$14,341
State:
+$16,110
(% of AGI for various income ranges: -0.7% for AGIs below $10k, 0.5% for AGIs $10k-25k, 0.7% for AGIs $25k-50k, 0.9% for AGIs $50k-75k, 1.2% for AGIs $75k-100k, 14.3% for AGIs over 100k)
Profit/loss from business: +$9,313 (reported on 19.8% of returns)
Here:
+$9,313
State:
+$11,013
(% of AGI for various income ranges: 2.5% for AGIs below $10k, 7.2% for AGIs $10k-25k, 3.8% for AGIs $25k-50k, 2.8% for AGIs $50k-75k, 2.5% for AGIs $75k-100k, 5.2% for AGIs over 100k)
IRA payment deduction: $3,123 (reported on 2.0% of returns)
78602:
$3,123
Texas:
$3,120
(% of AGI for various income ranges: 0.3% for AGIs $10k-25k, 0.1% for AGIs $25k-50k, 0.2% for AGIs $50k-75k, 0.1% for AGIs $75k-100k, 0.1% for AGIs over 100k)
Self-employed pension: $11,038 (reported on 0.6% of returns)
Here:
$11,038
Texas:
$16,401
(% of AGI for various income ranges: 0.1% for AGIs $10k-25k, 0.1% for AGIs $50k-75k, 0.4% for AGIs over 100k)
Total itemized deductions: $16,131 (21% of AGI, reported on 32.2% of returns)
Here:
$16,131
State:
$19,631
Here:
21.1% of AGI
State:
18.9% of AGI
(% of AGI for various income ranges: 17.1% for AGIs below $10k, 8.7% for AGIs $10k-25k, 11.3% for AGIs $25k-50k, 13.3% for AGIs $50k-75k, 13.3% for AGIs $75k-100k, 9.9% for AGIs over 100k)
Charity contributions deductions: $3,006 (4% of AGI, reported on 24.4% of returns)
Here:
$3,006
State:
$4,753
Here:
3.6% of AGI
State:
4.2% of AGI
(% of AGI for various income ranges: 1.0% for AGIs below $10k, 0.8% for AGIs $10k-25k, 1.2% for AGIs $25k-50k, 1.6% for AGIs $50k-75k, 1.8% for AGIs $75k-100k, 2.1% for AGIs over 100k)
Total tax: $6,659 (reported on 74.8% of returns)
78602:
$6,659
State:
$9,058
(% of AGI for various income ranges: 5.2% for AGIs below $10k, 4.2% for AGIs $10k-25k, 6.8% for AGIs $25k-50k, 8.6% for AGIs $50k-75k, 10.5% for AGIs $75k-100k, 18.1% for AGIs over 100k)
Earned income credit: $1,792 (reported on 19.3% of returns)
Here:
$1,792
State:
$2,024
Percentage of individuals using paid preparers for their 2004 taxes: 51.2%
Here:
51%
State:
57%
(% for various income ranges: 45.4% for AGIs below $10k, 57.0% for AGIs $10k-25k, 50.0% for AGIs $25k-50k, 50.7% for AGIs $50k-75k, 45.7% for AGIs $75k-100k, 59.0% for AGIs over 100k)
Likely homosexual households (counted as self-reported same-sex unmarried-partner households)
Lesbian couples: 0.1% of all households
Gay men: 0.5% of all households
Household received Food Stamps/SNAP in the past 12 months: 750 Household did not receive Food Stamps/SNAP in the past 12 months: 12,151
Women who had a birth in the past 12 months: 224 (183 now married, 42 unmarried) Women who did not have a birth in the past 12 months: 7,589 (3,781 now married, 3,794 unmarried)
Housing units in zip code 78602 with a mortgage: 5,639 (180 second mortgage, 131 both second mortgage and home equity loan) Houses without a mortgage: 20
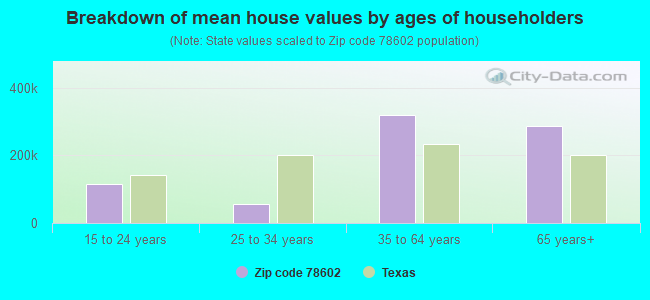
Median monthly owner costs for units with a mortgage: $1,706 Median monthly owner costs for units without a mortgage: $658
Residents with income below the poverty level in 2022:
This zip code:
10.4%
Whole state:
14.0%
Residents with income below 50% of the poverty level in 2022:
This zip code:
5.4%
Whole state:
7.4%
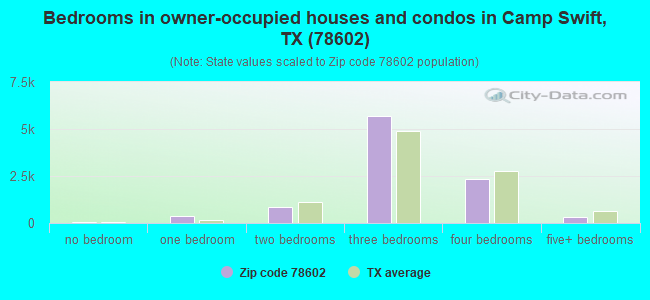
Median number of rooms in houses and condos:
Here:
6.0
State:
6.3
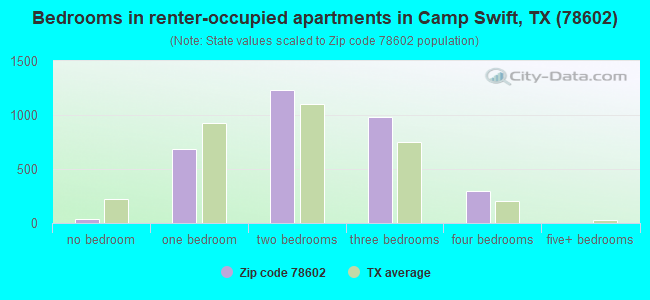
Median number of rooms in apartments:
Here:
4.1
State:
4.0
Notable locations in this zip code not listed on our city pages
Notable locations in zip code 78602: Poyston School (A), Garwood Ranch (B), Humble Camp (C), Bastrop County Courthouse (D), Cuero Public Library (E), Bastrop Fire Department Station 1 Headquarters (F), Bastrop Volunteer Fire Department Station 2 (G), Lake Bastrop Volunteer Fire Department (H), Circle D Fire Station (I), Texas Forest Service Bastrop Office (J), MetroCare Services Austin (K), Crocheron-McDowall House (L), Allen-Bell House (M), Abraham Wiley Hill House (N). Display/hide their locations on the map
Churches in zip code 78602 include: Prince of Peace Lutheran Church (A), Church of the Nazarene (B), Church of Christ (C), Ascension Catholic Church (D), New Faith Missionary Baptist Church (E), Macedonia First Baptist Church (F), First Baptist Church (G), Dorcas Chapel Primitive Baptist Church (H). Display/hide their locations on the map
Cemeteries: Meridith Cemetery (1), Pleasant Chapel Cemetery (2), Wolfenberger Cemetery (3), Walker-Watson Cemetery (4). Display/hide their locations on the map
Reservoirs: Tuck Lake (A), Hicks Lake (B), Egger Lake (C), Duke Lake Number 1 (D), Duke Lake Number 2 (E), Harmon Lake (F), Sanders Lake (G), Bastrop State Park Lake (H). Display/hide their locations on the map
Streams, rivers, and creeks: Big Sandy Creek (A), Spicer Creek (B), Wilbarger Creek (C), Piney Creek (D), McLaughlin Creek (E), Walnut Creek (F), Gills Branch (G), Little Sandy Creek (H), Lentz Branch (I). Display/hide their locations on the map
Parks in zip code 78602 include: Lake Bastrop - North Shores Park (1), Lake Bastrop - South Shores Park (2), Bastrop State Park (3), Bastrop Erhard Field (4), Firemans Park (5), City Park (6), Bastrop Commons Park (7). Display/hide their locations on the map
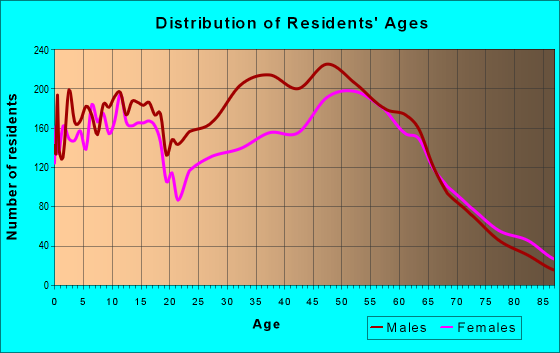
4,810 married couples with children.
1,881 single-parent households (350 men, 1,531 women).
74.1% of residents of 78602 zip code speak English at home.
23.4% of residents speak Spanish at home (79% very well, 12% well, 7% not well, 1% not at all).
1.5% of residents speak other Indo-European language at home (73% very well, 19% well, 8% not well).
0.7% of residents speak Asian or Pacific Island language at home (52% very well, 48% well).
0.1% of residents speak other language at home (100% very well).
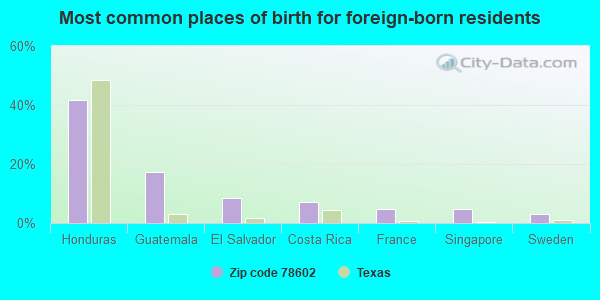
Foreign born population: 3,020 (8.4%) (44.8% of them are naturalized citizens)
This zip code:
8.4%
Whole state:
17.2%
42%Honduras
17%Guatemala
9%El Salvador
7%Costa Rica
5%France
5%Singapore
3%Sweden
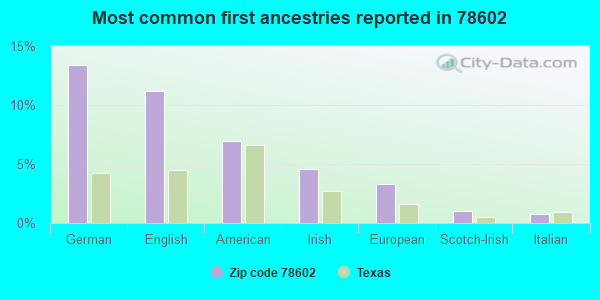
13%German
11%English
7%American
5%Irish
3%European
1%Scotch-Irish
1%Italian
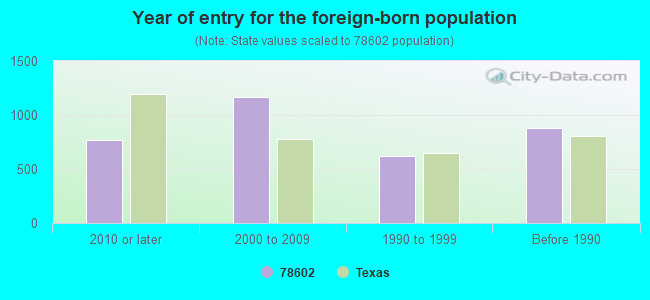
Year of entry for the foreign-born population
7692010 or later
1,1672000 to 2009
6201990 to 1999
876Before 1990
Facilities with environmental interests located in this zip code:
AQUA WATER SUPPLY CORP.- WWTP (2.1M W/NW FMR 1624&CO RD 322,& in BASTROP, TX)
National Pollutant Discharge Elimination System NON-MAJOR (Tracking pollutant discharge elimination systems) - permit National Pollutant Discharge Elimination System NON-MAJOR (Tracking pollutant discharge elimination systems) - permit Business SIC classification: WATER SUPPLY Organizations: AQUA WATER SUPPLY CORPORATION (CONTACT/OWNER)
Alternative names: AQUA WATER SUPPLY CORPORATION, AQUA WSC
AMERICAN TELEPHONE AND TELEGRAPH COMPANY (HIGHWAY 21 1.2 MI E in BASTROP, TX)
(Resource Conservation and Recovery Act (tracking hazardous waste)) Organizations: AMERICAN TEL & TEL COMPANY (CONTACT/OPERATOR)
Alternative names: AMERICAN TEL & TEL CO LONG LINES
Housing units lacking complete plumbing facilities: 1.1% Housing units lacking complete kitchen facilities: 2.2%
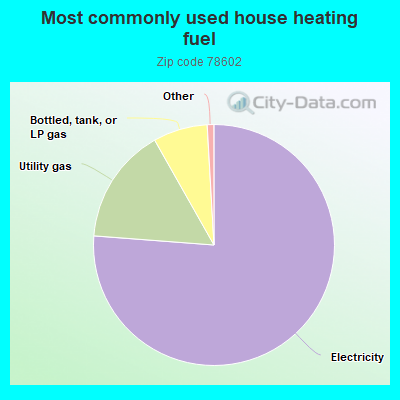
76.3%Electricity
15.6%Utility gas
7.3%Bottled, tank, or LP gas
Population in 1990: 10,588. Population change in the 1990s: +7,641 (+72.2%).
Place of birth for U.S.-born residents:
This state: 23,162
Northeast: 1,001
Midwest: 3,008
South: 2,253
West: 2,935
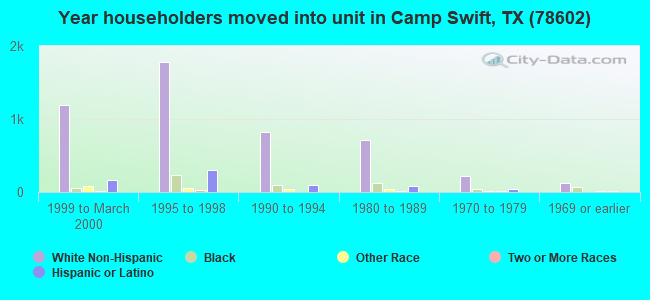
49% of the 78602 zip code residents lived in the same house 5 years ago. Out of people who lived in different houses, 35% lived in this county. Out of people who lived in different counties, 50% lived in Texas.
88% of the 78602 zip code residents lived in the same house 1 year ago. Out of people who lived in different houses, 25% moved from this county. Out of people who lived in different houses, 66% moved from different county within same state. Out of people who lived in different houses, 12% moved from different state. Out of people who lived in different houses, 1% moved from abroad.
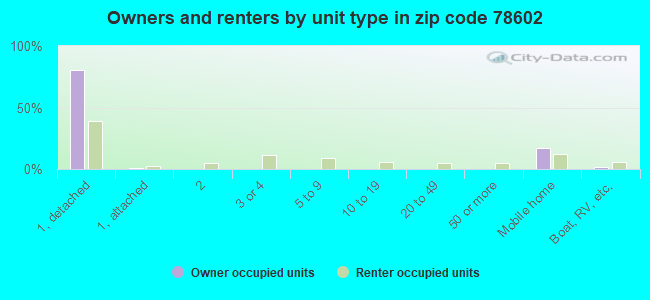
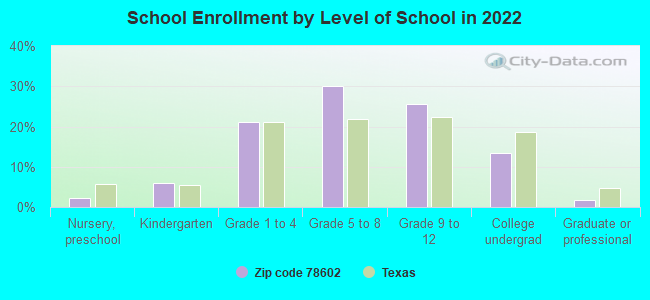
Private vs. public school enrollment:
Students in private schools in grades 1 to 8 (elementary and middle school): 564
Here:
16.5%
Texas:
8.8%
Students in private schools in grades 9 to 12 (high school): 107
Here:
6.3%
Texas:
8.0%
Students in private undergraduate colleges: 176
Here:
19.8%
Texas:
16.2%
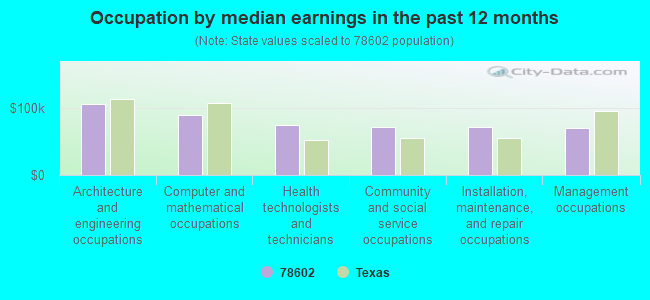
Occupation by median earnings in the past 12 months ($)
105,844Architecture and engineering occupations
90,355Computer and mathematical occupations
74,859Health technologists and technicians
71,719Community and social service occupations
71,303Installation, maintenance, and repair occupations
70,186Management occupations
Companies with federal contracts located in this zip code (BASTROP, TX):
THE UNIVERSITY OF TEXAS M D AN (HWY 95 AT FM 2336) : $1,434,000 in 5 contractsfrom 2000 to 2003
Contracts for Veterinary/Animal Care Services by National Institutes of Health Signed by year:2000: $437,000; 2001: $454,000; 2002: $232,000; 2003: $311,000; 2004: $0; 2005: $0; 2006: $0.
Biggest contracts:
$454,000 with National Institutes of Health for Veterinary/Animal Care Services. Signed on 2001-09-15. Completion date: 2002-08-15.
$364,000, same as above.Signed on 2000-09-15. Completion date: 2007-08-15.
$311,000, same as above.Signed on 2003-05-15. Completion date: 2004-08-15.
$232,000, same as above.Signed on 2002-06-15. Completion date: 2002-08-15.
CECIL R REYNOLDS (1 REYNOLDS CT; small business) : $590,000 in 2 contractsin 2000
$545,000 with Offices, Boards and Divisions (includes Attorney General, Deputy Attorney General, etc.) for Expert Witness. Taking place in DC. Signed on 2000-01-15. Completion date: 2000-09-15.
$45,000, same as above.Signed on 2000-05-15. Completion date: 2000-08-15.
DESIGNED SECURITY, INC (1402 HAWTHORNE ST; small business)
$92,134 with Navy for Miscellaneous Alarm, Signal and Security Detection Systems. Signed on 2003-08-23. Completion date: 2003-11-07.
TERRY E ORR AND ASSOCIATES, I (1109 PECAN STREET; small business) : $55,271 in 2 contractsin 2001
$29,752 with Navy for Connectors, Electrical. Signed on 2001-05-10. Completion date: 2001-06-22.
$25,519 with Navy for Underwater Sound Equipment. Signed on 2001-01-22. Completion date: 2001-02-01.
MC DONALD, CURTIS J, DDS, & EM (301 HWY 71 W STE 200; small business) : $35,000 in 2 contractsin 2003
$20,000 with Army for Radiology Services. Signed on 2003-01-30. Completion date: 2003-02-01.
$15,000 with Army for Maintenance, Repair and Rebuilding of Equipment -- Medical, Dental, and Veterinary Equipment and Supplies. Signed on 2003-03-04. Completion date: 2003-09-30.
DELI DEPOT (1006 MAIN ST; small business)
$7,498 with Army for Food Services. Signed on 2003-03-12. Completion date: 2003-03-09.
MS KS BAIL BOND SERVICE (803 WALNUT ST; small business)
$2,990 with Army for Food Services. Signed on 2004-11-04. Completion date: 2004-11-06.
Top industries in this zip code by the number of employees in 2005:
2002 - 2018 National Fire Incident Reporting System (NFIRS) incidents
Based on the data from the years 2002 - 2018 the average number of fire incidents per year is 147. The highest number of reported fires - 223 took place in 2017, and the least - 98 in 2012. The data has a rising trend.
When looking into fire subcategories, the most reports belonged to: Outside Fires (56.3%), and Structure Fires (26.0%).
Fire incident types reported to NFIRS in Zip Code 78602


 Nearest zip codes: 78612, 78957, 78650, 78662, 78621, 78659.
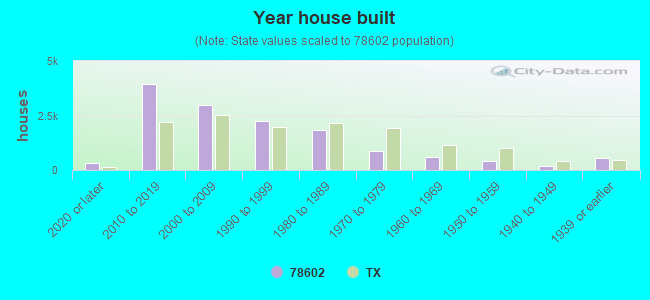


 Based on the data from the years 2002 - 2018 the average number of fire incidents per year is 147. The highest number of reported fires - 223 took place in 2017, and the least - 98 in 2012. The data has a rising trend.
 When looking into fire subcategories, the most reports belonged to: Outside Fires (56.3%), and Structure Fires (26.0%).