Estimated zip code population in 2022: 50,781 Zip code population in 2010: 42,820 Zip code population in 2000: 33,706
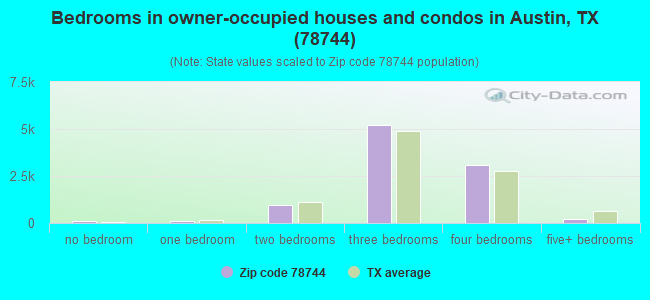
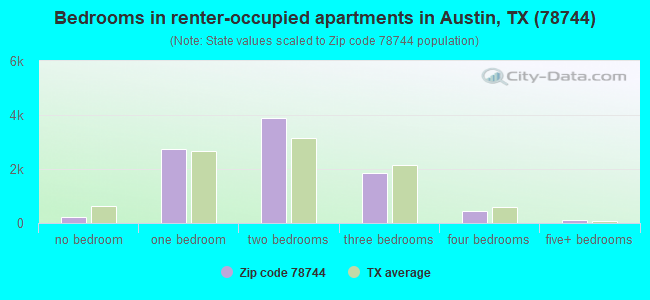
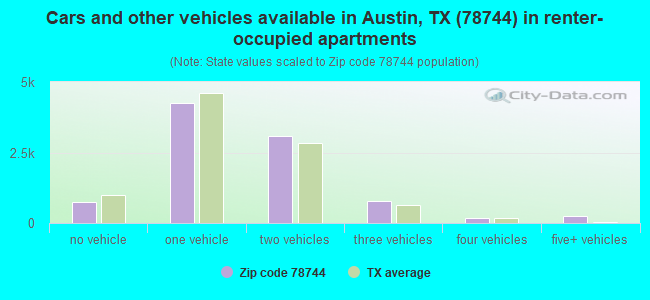
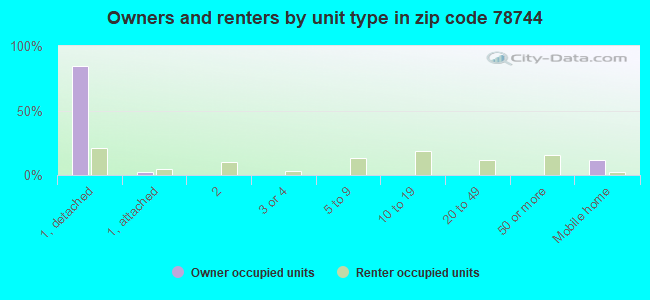
Houses and condos: 19,619 Renter-occupied apartments: 9,354
% of renters here:
49%
State:
38%
March 2022 cost of living index in zip code 78744: 93.3 (less than average, U.S. average is 100)
Land area: 21.4 sq. mi. Water area: 0.0 sq. mi.
Population density: 2,372 people per square mile
(low).
OSM Map
General Map
Google Map
MSN Map
OSM Map
General Map
Google Map
MSN Map
OSM Map
General Map
Google Map
MSN Map
OSM Map
General Map
Google Map
MSN Map
Please wait while loading the map...
Real estate property taxes paid for housing units in 2022:
This zip code:
1.4% ($4,161)
Texas:
1.5% ($4,050)
Median real estate property taxes paid for housing units with mortgages in 2022: $4,530 (1.3%) Median real estate property taxes paid for housing units with no mortgage in 2022: $2,834 (1.2%)
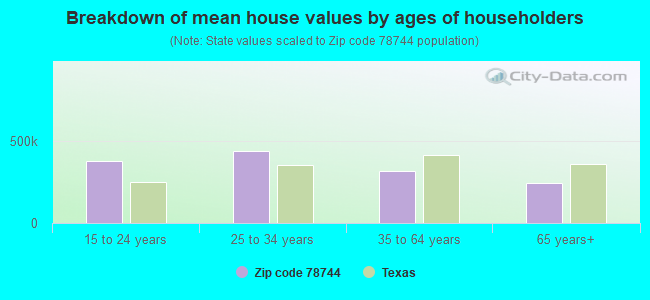
Estimated median house/condo value in 2022: $307,684
78744:
$307,684
Texas:
$275,400
According to our research of Texas and other state lists, there were 104 registered sex offenders living in 78744 zip code as of April 27, 2024. The ratio of all residents to sex offenders in zip code 78744 is 460 to 1. The ratio of registered sex offenders to all residents in this zip code is near the state average.
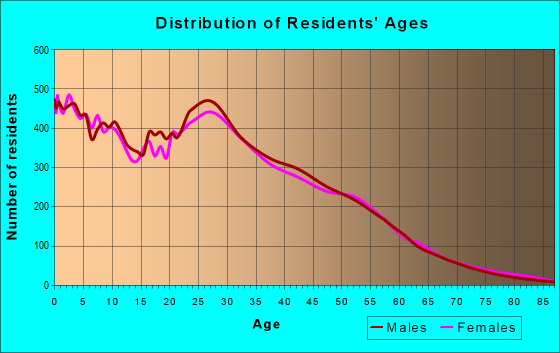
Median resident age:
This zip code:
32.6 years
Texas median age:
35.6 years
Average household size:
This zip code:
2.7 people
Texas:
2.6 people
Averages for the 2020 tax year for zip code 78744, filed in 2021:
Average Adjusted Gross Income (AGI) in 2020: $52,868 (Individual Income Tax Returns)
Here:
$52,868
State:
$77,054
Salary/wage: $50,599 (reported on 87.7% of returns)
Here:
$50,599
State:
$62,766
(% of AGI for various income ranges: 1256.3% for AGIs below $25k, 3855.2% for AGIs $25k-50k, 7072.7% for AGIs $50k-75k, 10599.9% for AGIs $75k-100k, 19266.5% for AGIs $100k-200k, 142876.4% for AGIs over 200k)
Taxable interest for individuals: $1,073 (reported on 11.9% of returns)
This zip code:
$1,073
Texas:
$2,665
(% of AGI for various income ranges: 2.4% for AGIs below $25k, 3.5% for AGIs $25k-50k, 11.0% for AGIs $50k-75k, 11.8% for AGIs $75k-100k, 30.5% for AGIs $100k-200k, 1404.3% for AGIs over 200k)
Ordinary dividends: $2,105 (reported on 7.4% of returns)
Here:
$2,105
State:
$10,044
(% of AGI for various income ranges: 4.2% for AGIs below $25k, 4.1% for AGIs $25k-50k, 8.8% for AGIs $50k-75k, 18.3% for AGIs $75k-100k, 56.3% for AGIs $100k-200k, 1557.9% for AGIs over 200k)
Net capital gain/loss in AGI: +$12,808 (reported on 8.0% of returns)
Here:
+$12,808
State:
+$39,590
(% of AGI for various income ranges: 2.4% for AGIs below $25k, 4.6% for AGIs $25k-50k, 28.0% for AGIs $50k-75k, 77.0% for AGIs $75k-100k, 364.2% for AGIs $100k-200k, 13630.7% for AGIs over 200k)
Profit/loss from business: +$13,218 (reported on 20.1% of returns)
Here:
+$13,218
State:
+$10,888
(% of AGI for various income ranges: 273.2% for AGIs below $25k, 247.4% for AGIs $25k-50k, 347.7% for AGIs $50k-75k, 429.1% for AGIs $75k-100k, 578.0% for AGIs $100k-200k, 6699.3% for AGIs over 200k)
Taxable individual retirement arrangement distribution: $13,743 (reported on 1.7% of returns)
78744:
$13,743
Texas:
$24,740
(% of AGI for various income ranges: 7.2% for AGIs below $25k, 10.3% for AGIs $25k-50k, 31.8% for AGIs $50k-75k, 81.1% for AGIs $75k-100k, 129.8% for AGIs $100k-200k, 857.1% for AGIs over 200k)
Self-employed (Keogh) retirement plans: $21,933 (reported on 0.1% of returns)
78744:
$21,933
Texas:
$29,298
(% of AGI for various income ranges: 57.2% for AGIs $100k-200k)
Total itemized deductions: $25,532 (reported on 4.2% of returns)
Here:
$25,532
State:
$40,428
(% of AGI for various income ranges: 13.2% for AGIs below $25k, 40.4% for AGIs $25k-50k, 167.5% for AGIs $50k-75k, 403.1% for AGIs $75k-100k, 549.2% for AGIs $100k-200k, 4899.3% for AGIs over 200k)
Charity contributions: $8,022 (reported on 2.4% of returns)
Here:
$8,022
State:
$18,201
(% of AGI for various income ranges: 1.1% for AGIs below $25k, 4.9% for AGIs $25k-50k, 14.9% for AGIs $50k-75k, 34.1% for AGIs $75k-100k, 100.2% for AGIs $100k-200k, 1720.0% for AGIs over 200k)
Taxes paid: $6,863 (reported on 4.1% of returns)
78744:
$6,863
State:
$7,821
(% of AGI for various income ranges: 4.0% for AGIs below $25k, 11.0% for AGIs $25k-50k, 50.8% for AGIs $50k-75k, 117.4% for AGIs $75k-100k, 180.2% for AGIs $100k-200k, 724.3% for AGIs over 200k)
Earned income credit: $2,485 (reported on 20.5% of returns)
Here:
$2,485
State:
$2,584
(% of AGI for various income ranges: 126.0% for AGIs below $25k, 65.2% for AGIs $25k-50k, 0.6% for AGIs $50k-75k)
Percentage of individuals using paid preparers for their 2020 taxes: 91.5%
Here:
91%
State:
92%
(% for various income ranges: 88.9% for AGIs below $25k, 92.5% for AGIs $25k-50k, 92.2% for AGIs $50k-75k, 93.0% for AGIs $75k-100k, 94.1% for AGIs $100k-200k, 97.4% for AGIs over 200k)
Averages for the 2012 tax year for zip code 78744, filed in 2013:
Average Adjusted Gross Income (AGI) in 2012: $30,946 (Individual Income Tax Returns)
Here:
$30,946
State:
$65,384
Salary/wage: $29,310 (reported on 90.0% of returns)
Here:
$29,310
State:
$52,524
(% of AGI for various income ranges: 82.2% for AGIs below $25k, 92.1% for AGIs $25k-50k, 88.4% for AGIs $50k-75k, 85.7% for AGIs $75k-100k, 77.7% for AGIs $100k-200k, 45.5% for AGIs over 200k)
Taxable interest for individuals: $676 (reported on 8.9% of returns)
This zip code:
$676
Texas:
$2,372
(% of AGI for various income ranges: 0.1% for AGIs below $25k, 0.1% for AGIs $50k-75k, 0.1% for AGIs $75k-100k, 0.4% for AGIs $100k-200k, 1.4% for AGIs over 200k)
Ordinary dividends: $5,022 (reported on 3.3% of returns)
Here:
$5,022
State:
$9,721
(% of AGI for various income ranges: 1.2% for AGIs below $25k, 0.2% for AGIs $25k-50k, 0.1% for AGIs $50k-75k, 0.5% for AGIs $75k-100k, 0.9% for AGIs $100k-200k, 1.2% for AGIs over 200k)
Net capital gain/loss in AGI: +$5,143 (reported on 2.4% of returns)
Here:
+$5,143
State:
+$35,319
(% of AGI for various income ranges: 0.1% for AGIs $50k-75k, 0.4% for AGIs $75k-100k, 2.0% for AGIs $100k-200k, 3.8% for AGIs over 200k)
Profit/loss from business: +$11,030 (reported on 15.6% of returns)
Here:
+$11,030
State:
+$13,732
(% of AGI for various income ranges: 12.7% for AGIs below $25k, 3.5% for AGIs $25k-50k, 2.3% for AGIs $50k-75k, 2.3% for AGIs $75k-100k, 6.1% for AGIs $100k-200k, 3.9% for AGIs over 200k)
Taxable individual retirement arrangement distribution: $8,747 (reported on 2.0% of returns)
78744:
$8,747
Texas:
$19,511
(% of AGI for various income ranges: 0.4% for AGIs below $25k, 0.5% for AGIs $25k-50k, 0.8% for AGIs $50k-75k, 1.8% for AGIs $75k-100k)
Total itemized deductions: $15,135 (23% of AGI, reported on 9.0% of returns)
Here:
$15,135
State:
$24,724
Here:
22.8% of AGI
State:
15.9% of AGI
(% of AGI for various income ranges: 2.1% for AGIs below $25k, 3.8% for AGIs $25k-50k, 5.7% for AGIs $50k-75k, 6.3% for AGIs $75k-100k, 7.4% for AGIs $100k-200k, 7.8% for AGIs over 200k)
Charity contributions: $2,885 (reported on 5.5% of returns)
Here:
$2,885
State:
$6,808
(% of AGI for various income ranges: 0.1% for AGIs below $25k, 0.3% for AGIs $25k-50k, 0.6% for AGIs $50k-75k, 0.8% for AGIs $75k-100k, 1.4% for AGIs $100k-200k, 1.8% for AGIs over 200k)
Taxes paid: $3,871 (reported on 8.7% of returns)
78744:
$3,871
State:
$6,921
(% of AGI for various income ranges: 0.6% for AGIs below $25k, 0.9% for AGIs $25k-50k, 1.4% for AGIs $50k-75k, 1.5% for AGIs $75k-100k, 1.9% for AGIs $100k-200k, 1.8% for AGIs over 200k)
Earned income credit: $2,669 (reported on 32.1% of returns)
Here:
$2,669
State:
$2,570
(% of AGI for various income ranges: 9.0% for AGIs below $25k, 1.7% for AGIs $25k-50k)
Percentage of individuals using paid preparers for their 2012 taxes: 42.0%
Here:
42%
State:
51%
(% for various income ranges: 42.2% for AGIs below $25k, 41.2% for AGIs $25k-50k, 41.3% for AGIs $50k-75k, 43.8% for AGIs $75k-100k, 50.0% for AGIs $100k-200k, 75.0% for AGIs over 200k)
Averages for the 2004 tax year for zip code 78744, filed in 2005:
Average Adjusted Gross Income (AGI) in 2004: $26,498 (Individual Income Tax Returns)
Here:
$26,498
State:
$47,881
Salary/wage: $25,851 (reported on 91.8% of returns)
Here:
$25,851
State:
$41,947
(% of AGI for various income ranges: 91.4% for AGIs below $10k, 89.6% for AGIs $10k-25k, 92.9% for AGIs $25k-50k, 88.0% for AGIs $50k-75k, 86.0% for AGIs $75k-100k, 66.3% for AGIs over 100k)
Taxable interest for individuals: $588 (reported on 14.0% of returns)
This zip code:
$588
Texas:
$2,255
(% of AGI for various income ranges: 0.4% for AGIs below $10k, 0.2% for AGIs $10k-25k, 0.2% for AGIs $25k-50k, 0.5% for AGIs $50k-75k, 0.2% for AGIs $75k-100k, 1.5% for AGIs over 100k)
Taxable dividends: $665 (reported on 4.0% of returns)
Here:
$665
State:
$4,261
(% of AGI for various income ranges: 0.1% for AGIs below $10k, 0.1% for AGIs $10k-25k, 0.1% for AGIs $25k-50k, 0.1% for AGIs $50k-75k, 0.1% for AGIs $75k-100k, 0.1% for AGIs over 100k)
Net capital gain/loss: +$2,728 (reported on 3.7% of returns)
Here:
+$2,728
State:
+$16,110
(% of AGI for various income ranges: 0.2% for AGIs below $10k, -0.0% for AGIs $10k-25k, 0.1% for AGIs $25k-50k, 0.2% for AGIs $50k-75k, 1.5% for AGIs $75k-100k, 4.9% for AGIs over 100k)
Profit/loss from business: +$8,079 (reported on 12.3% of returns)
Here:
+$8,079
State:
+$11,013
(% of AGI for various income ranges: 9.9% for AGIs below $10k, 6.4% for AGIs $10k-25k, 2.6% for AGIs $25k-50k, 2.2% for AGIs $50k-75k, 2.4% for AGIs $75k-100k, 4.2% for AGIs over 100k)
IRA payment deduction: $1,800 (reported on 0.9% of returns)
78744:
$1,800
Texas:
$3,120
Total itemized deductions: $12,029 (27% of AGI, reported on 11.9% of returns)
Here:
$12,029
State:
$19,631
Here:
26.6% of AGI
State:
18.9% of AGI
(% of AGI for various income ranges: 3.5% for AGIs below $10k, 3.2% for AGIs $10k-25k, 5.7% for AGIs $25k-50k, 6.7% for AGIs $50k-75k, 7.5% for AGIs $75k-100k, 8.3% for AGIs over 100k)
Charity contributions deductions: $2,099 (4% of AGI, reported on 7.5% of returns)
Here:
$2,099
State:
$4,753
Here:
4.2% of AGI
State:
4.2% of AGI
(% of AGI for various income ranges: 0.1% for AGIs below $10k, 0.2% for AGIs $10k-25k, 0.5% for AGIs $25k-50k, 0.9% for AGIs $50k-75k, 1.3% for AGIs $75k-100k, 1.8% for AGIs over 100k)
Total tax: $2,800 (reported on 61.1% of returns)
78744:
$2,800
State:
$9,058
(% of AGI for various income ranges: 2.9% for AGIs below $10k, 3.4% for AGIs $10k-25k, 5.6% for AGIs $25k-50k, 8.9% for AGIs $50k-75k, 11.3% for AGIs $75k-100k, 18.0% for AGIs over 100k)
Earned income credit: $2,018 (reported on 32.9% of returns)
Here:
$2,018
State:
$2,024
Percentage of individuals using paid preparers for their 2004 taxes: 55.9%
Here:
56%
State:
57%
(% for various income ranges: 54.7% for AGIs below $10k, 61.9% for AGIs $10k-25k, 53.3% for AGIs $25k-50k, 46.6% for AGIs $50k-75k, 40.8% for AGIs $75k-100k, 45.8% for AGIs over 100k)
Likely homosexual households (counted as self-reported same-sex unmarried-partner households)
Lesbian couples: 0.2% of all households
Gay men: 0.1% of all households
Household received Food Stamps/SNAP in the past 12 months: 2,401 Household did not receive Food Stamps/SNAP in the past 12 months: 16,640
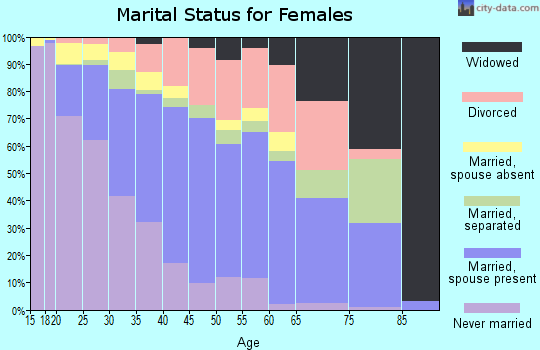
Women who had a birth in the past 12 months: 793 (662 now married, 136 unmarried) Women who did not have a birth in the past 12 months: 13,700 (5,246 now married, 8,478 unmarried)
Housing units in zip code 78744 with a mortgage: 6,521 (234 second mortgage, 224 both second mortgage and home equity loan) Houses without a mortgage: 39
Median monthly owner costs for units with a mortgage: $1,703 Median monthly owner costs for units without a mortgage: $631
Residents with income below the poverty level in 2022:
This zip code:
11.4%
Whole state:
14.0%
Residents with income below 50% of the poverty level in 2022:
This zip code:
5.8%
Whole state:
7.4%
Median number of rooms in houses and condos:
Here:
5.8
State:
6.3
Median number of rooms in apartments:
Here:
4.0
State:
4.0
Notable locations in this zip code not listed on our city pages
Notable locations in zip code 78744: McKinney Homestead (A), Austin Fire Department Station 24 (B), Austin Fire Department Station 35 (C), Southeast Austin Branch Austin City Library (D), Austin / Travis County Emergency Medical Service - Medic 28 (E). Display/hide their locations on the map
Churches in zip code 78744 include: Boulevard Church (A), First Independent Baptist Church (B), Crossroads Baptist Church (C), Dove Springs United Methodist Church (D), Beautiful Savior Lutheran Church (E), Saint Peter Apostle Church (F), Teri Road Baptist Child Care Center (G), Teri Road Baptist Church (H), Embassy Nation Church (I). Display/hide their locations on the map
6,117 married couples with children.
4,243 single-parent households (813 men, 3,430 women).
52.2% of residents of 78744 zip code speak English at home.
45.0% of residents speak Spanish at home (59% very well, 19% well, 15% not well, 7% not at all).
0.9% of residents speak other Indo-European language at home (74% very well, 26% well).
0.8% of residents speak Asian or Pacific Island language at home (78% very well, 21% well, 2% not at all).
0.4% of residents speak other language at home (87% very well, 13% well).
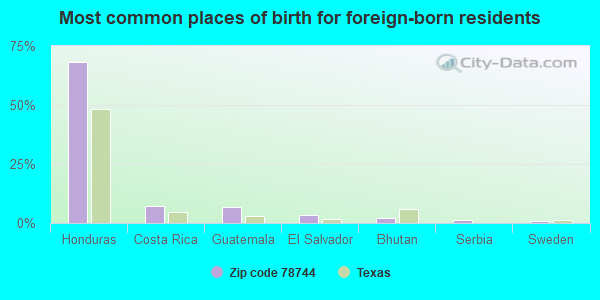
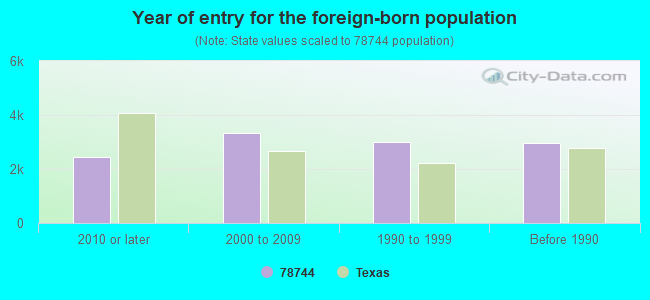
Foreign born population: 11,062 (21.8%) (35.6% of them are naturalized citizens)
Facilities with environmental interests located in this zip code:
AUSTIN ISD (5106 VILLAGE SQUARE in AUSTIN, TX)
(National Center for Education Statistics) - STATE ID-227901058 (Resource Conservation and Recovery Act (tracking hazardous waste)) Alternative names: MENDEZ MIDDLE SCH
AIR PRODUCTS ECD (2307 BUSINESS CENTER DRIVE in AUSTIN, TX)
ENFORCEMENT/COMPLIANCE ACTIVITY (Integrated Compliance Information System) HAZARDOUS WASTE BIENNIAL REPORTER (Resource Conservation and Recovery Act (tracking hazardous waste)) (Resource Conservation and Recovery Act (tracking hazardous waste)) Organizations: AIR PRODUCTS AND CHEMICALS INC (CONTACT/OPERATOR)
Alternative names: ASHLAND DISTRIBUTION COMPANY AUSTIN TX, ASHLAND SPECIALTY CHEMICAL CO
ADVANCED MICRO DEVICES INC (4115 FREIDRICH LN in AUSTIN, TX)
(Resource Conservation and Recovery Act (tracking hazardous waste)) Alternative names: ADVANCED MICRO DEVICES-IPD
ADVANCED STAINLESS TECHNOLOGIES (5812 TRADE CENTER DR STE 200 in AUSTIN, TX)
ENFORCEMENT/COMPLIANCE ACTIVITY (Integrated Compliance Information System) COMPLIANCE ACTIVITY (Tracking inspections of insecticide, fungicide, and rodenticide, and toxic substances) Small Quantity Generators, between 100 kg and 1000 kg of hazardous waste/month (Resource Conservation and Recovery Act (tracking hazardous waste)) - notification Business SIC classification: STEEL PIPE AND TUBES Business NAICS classification: OTHER METAL VALVE AND PIPE FITTING MANUFACTURING. Organizations: EMDERICHARD C (CONTACT/OPERATOR)
AMBION INC (2130 WOODWARD ST STE 200 in AUSTIN, TX)
Large Quantity Generators, more that 1000 kg of hazardous waste/month (Resource Conservation and Recovery Act (tracking hazardous waste)) Business NAICS classification: BIOLOGICAL PRODUCT (EXCEPT DIAGNOSTIC) MANUFACTURING.
ARDEX INC (3910 S INDUSTRIAL DR in AUSTIN, TX)
(Resource Conservation and Recovery Act (tracking hazardous waste))
ASHLAND INC (4918 BURLESON RD in AUSTIN, TX)
(Resource Conservation and Recovery Act (tracking hazardous waste)) Organizations: ASHLAND SPECIALTY CHEMICAL COMPANY (CONTACT/OPERATOR)
Alternative names: ASHLAND SPECIALTY CHEMICAL CO
AUSTIN SCIENTIFIC CO (4114 TODD LN in AUSTIN, TX)
(Resource Conservation and Recovery Act (tracking hazardous waste)) Business NAICS classification: CONSUMER ELECTRONICS REPAIR AND MAINTENANCE.
AXCESS TECHNOLOGIES LLP (4801 FREIDRICH LANE BLDG 1 SUITE 10 in AUSTIN, TX)
ABC CONCRETE, INC (8000 D. G. COLLINS ROAD in AUSTIN, TX)
National Pollutant Discharge Elimination System NON-MAJOR (Tracking pollutant discharge elimination systems) - permit Business SIC classification: READY-MIXED CONCRETE Organizations: ABC CONCRETE, INC. (CONTACT/OWNER)
ASURAGEN INC (2170 WOODWARD ST in AUSTIN, TX)
Small Quantity Generators, between 100 kg and 1000 kg of hazardous waste/month (Resource Conservation and Recovery Act (tracking hazardous waste))
Housing units lacking complete plumbing facilities: 0.6% Housing units lacking complete kitchen facilities: 0.6%
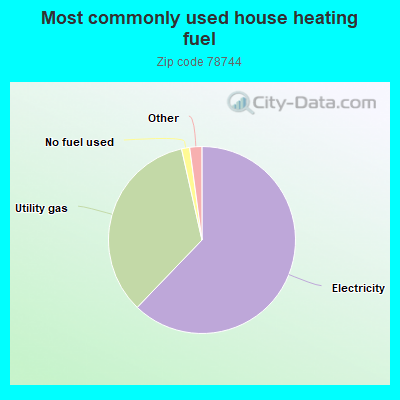
62.2%Electricity
34.3%Utility gas
1.4%No fuel used
0.6%Wood
0.5%Solar energy
Population in 1990: 23,418. Population change in the 1990s: +10,288 (+43.9%).
Place of birth for U.S.-born residents:
This state: 29,917
Northeast: 896
Midwest: 1,971
South: 3,235
West: 2,599
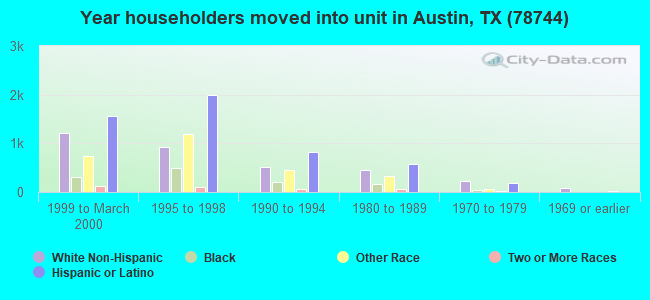
43% of the 78744 zip code residents lived in the same house 5 years ago. Out of people who lived in different houses, 71% lived in this county. Out of people who lived in different counties, 50% lived in Texas.
83% of the 78744 zip code residents lived in the same house 1 year ago. Out of people who lived in different houses, 53% moved from this county. Out of people who lived in different houses, 17% moved from different county within same state. Out of people who lived in different houses, 24% moved from different state. Out of people who lived in different houses, 6% moved from abroad.
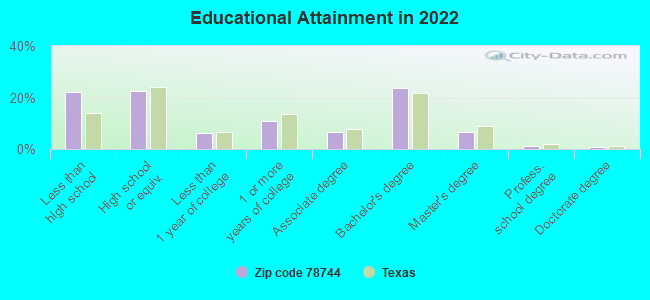
Private vs. public school enrollment:
Students in private schools in grades 1 to 8 (elementary and middle school): 455
Here:
8.9%
Texas:
8.8%
Students in private schools in grades 9 to 12 (high school): 316
Here:
9.7%
Texas:
8.0%
Students in private undergraduate colleges: 523
Here:
26.5%
Texas:
16.2%
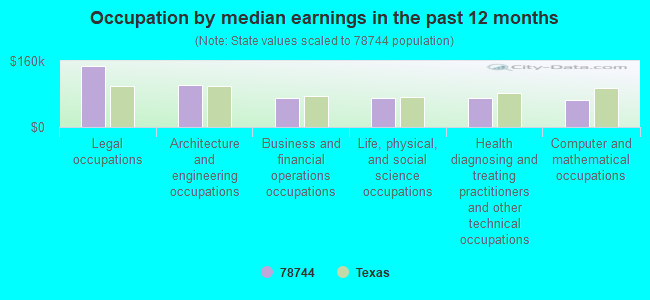
Occupation by median earnings in the past 12 months ($)
146,806Legal occupations
100,608Architecture and engineering occupations
70,788Business and financial operations occupations
70,347Life, physical, and social science occupations
70,286Health diagnosing and treating practitioners and other technical occupations
65,862Computer and mathematical occupations
Companies with biggest federal contracts located in this zip code (AUSTIN, TX):
SYMTX, INC (4401 FREIDRICH LN STE 200; small business) : $10,561,676 in 7 contractsfrom 2004 to 2005
Contracts for Electrical and Electronic Properties Measuring and Testing Instruments, Electrical Control Equipment by Navy, Air Force, Department of Defense, NASA, and others Signed by year:2000: $0; 2001: $0; 2002: $0; 2003: $0; 2004: $1,989,728; 2005: $8,571,948; 2006: $0.
Biggest contracts:
$6,136,850 with Navy for Electrical and Electronic Properties Measuring and Testing Instruments. Signed on 2005-09-26. Completion date: 2005-09-15.
$2,220,700 with Air Force for Electrical and Electronic Properties Measuring and Testing Instruments. Signed on 2005-09-23. Completion date: 2006-01-31.
$1,789,928 with Navy for Electrical and Electronic Properties Measuring and Testing Instruments. Signed on 2004-11-12. Completion date: 2005-09-15.
$199,800 with Air Force for Electrical and Electronic Properties Measuring and Testing Instruments. Signed on 2004-12-27. Completion date: 2005-09-01.
RSI, INC (7901 E RIVERSIDE DR; small business) : $2,240,665 in 222 contractsfrom 1999 to 2006
Contracts for ADP Input/Output and Storage Devices, ADPE System Configuration, Miscellaneous Electrical and Electronic Components, Electrical Insulators and Insulating Materials, and moreby Navy, Army, Defense Logistics Agency, Air Force, and others Signed by year:2000: $71,729; 2001: $6,473; 2002: $55,129; 2003: $53,419; 2004: $555,035; 2005: $1,061,975; 2006: $401,705.
Biggest contracts:
$98,347 with Navy for ADP Input/Output and Storage Devices. Signed on 2006-06-16. Completion date: 2006-09-15.
$71,729 with Army for ADPE System Configuration. Signed on 2000-03-13. Completion date: 2000-04-15.
$67,481 with Defense Logistics Agency for Miscellaneous Electrical and Electronic Components. Signed on 2005-04-23. Completion date: 2005-05-25.
$44,469 with Defense Logistics Agency for Electrical Insulators and Insulating Materials. Signed on 2003-12-23. Completion date: 2004-02-26.
ESOTERIX INC (4509 FRIEDRICH LANE SUITE) : $1,568,687 in 33 contractsfrom 2000 to 2005
Contracts for Other Professional Services, Other Medical -- Management and Support (R&D), Medical and Surgical Instruments, Equipment, and Supplies, Scientific Data Studies, and moreby Army, National Institutes of Health, Navy Signed by year:2000: $4,000; 2001: $214,000; 2002: $724,113; 2003: $517,138; 2004: $28,566; 2005: $80,870; 2006: $0.
Biggest contracts:
$694,113 with Army for Other Professional Services. Taking place in CA. Signed on 2002-09-25. Completion date: 2004-03-31.
$268,403, same as above.Signed on 2003-09-05. Completion date: 2005-08-31.
$114,000 with National Institutes of Health for Other Medical -- Management and Support (R&D). Taking place in MD. Signed on 2001-08-15. Completion date: 2001-11-15.
$100,000 with Army for Medical and Surgical Instruments, Equipment, and Supplies. Taking place in HI. Signed on 2001-03-15. Completion date: 2002-09-30.
A D WILLIS CO INC (4266 FELTER LANE; small business) : $1,458,100 in 28 contractsfrom 2001 to 2005
Contracts for Maintenance, Repair or Alteration of Real Property -- Miscellaneous Buildings, Maintenance, Repair or Alteration of Real Property -- Office Buildings, Maintenance, Repair or Alteration of Real Property -- Family Housing Facilities by Army, Drug Enforcement Administration Signed by year:2000: $0; 2001: $271,830; 2002: $203,118; 2003: $412,551; 2004: $254,399; 2005: $316,202; 2006: $0.
Biggest contracts:
$300,000 with Army for Maintenance, Repair or Alteration of Real Property -- Miscellaneous Buildings. Signed on 2005-08-31. Completion date: 2006-05-15.
$178,530 with Drug Enforcement Administration for Maintenance, Repair or Alteration of Real Property -- Office Buildings. Signed on 2003-06-15. Completion date: 2003-07-15.
$135,000 with Army for Maintenance, Repair or Alteration of Real Property -- Family Housing Facilities. Signed on 2002-04-09. Completion date: 2002-06-21.
$110,250, same as above.Signed on 2001-08-15. Completion date: 2001-12-21.
EXTREME DEVICES INCORPORATED (3500 COMSOUTH DR; small business) : $580,000 in 4 contractsfrom 2000 to 2001
$350,000 with Air Force for Defense Electronics and Communication Equipment -- Management and Support (R&D). Signed on 2001-03-21. Completion date: 2003-09-30.
$100,000, same as above.Signed on 2000-01-11. Completion date: 2000-11-18.
$65,000 with Navy for Ammunition -- Basic Research (R&D). Signed on 2001-05-10. Completion date: 2001-11-10.
$65,000 with Army for Defense Missile and Space Systems -- Advanced Development (R&D). Signed on 2001-05-09. Completion date: 2002-01-09.
QUEST DESIGN SERVICES, INC (3709A PROMONTORY POINT; small business) : $278,562 in 2 contractsfrom 2003 to 2005
$331,051 with Department of Defense for Miscellaneous Communication Equipment. Signed on 2003-08-15. Completion date: 2006-08-14.
-$52,489, same as above.Signed on 2005-07-01. Completion date: 2006-08-14.
RS EQUIPMENT CO, LLC (4714 NUCKOLS CROSSING RD; small business) : $192,879 in 15 contractsfrom 2001 to 2005
Contracts for Lease or Rental of Equipment -- Special Industry Machinery, Lease or Rental of Equipment -- Service and Trade Equipment, Lease or Rental of Equipment -- Cleaning Equipment and Supplies, Floor Polishers and Vacuum Cleaning Equipment by Army Signed by year:2000: $0; 2001: $4,700; 2002: $45,919; 2003: $24,900; 2004: $0; 2005: $117,360; 2006: $0.
Biggest contracts:
$117,360 with Army for Lease or Rental of Equipment -- Special Industry Machinery. Signed on 2005-12-21. Completion date: 2006-07-14.
$13,500 with Army for Lease or Rental of Equipment -- Service and Trade Equipment. Signed on 2002-07-31. Completion date: 2001-12-08.
$9,480 with Army for Lease or Rental of Equipment -- Cleaning Equipment and Supplies. Signed on 2003-01-22. Completion date: 2003-03-23.
$9,020 with Army for Lease or Rental of Equipment -- Special Industry Machinery. Signed on 2002-05-06. Completion date: 2002-08-01.
WHITE SWAN, INC (5330 FLEMING COURT; small business) : $90,973 in 12 contractsfrom 2000 to 2006
Contracts for Food Services, Condiments and Related Products, Food Items For Resale, Kitchen Equipment and Appliances, and moreby Army Signed by year:2000: $37,691; 2001: $0; 2002: $2,900; 2003: $20,227; 2004: $15,031; 2005: $14,585; 2006: $539.
Biggest contracts:
$37,691 with Army for Food Services. Signed on 2000-05-04. Completion date: 2000-09-29.
$7,745 with Army for Condiments and Related Products. Signed on 2004-05-05. Completion date: 2004-05-02.
$7,730, same as above.Signed on 2005-04-01. Completion date: 2005-04-24.
$7,286, same as above.Signed on 2004-03-10. Completion date: 2004-03-21.
INDUSTRIAL AIR SERVICES INC (6606 HIGHWAY 183 S; small business) : $67,848 in 2 contractsfrom 2002 to 2004
$39,689 with Air Force for Fire Fighting Equipment. Signed on 2004-02-12. Completion date: 2004-06-04.
$28,159 with Army for Compressors and Vacuum Pumps. Signed on 2002-06-11. Completion date: 2002-08-20.
AUSTIN SCIENTIFIC COMPANY (4114 TODD LN; small business) : $43,120 in 2 contractsfrom 2000 to 2004
$37,083 with Navy for Other Defense -- Applied Research and Exploratory Development (R&D). Signed on 2000-08-16. Completion date: 2000-09-20.
$6,037, same as above.Signed on 2004-10-20. Completion date: 2004-11-17.
Top industries in this zip code by the number of employees in 2005:
2002 - 2018 National Fire Incident Reporting System (NFIRS) incidents
Based on the data from the years 2002 - 2018 the average number of fire incidents per year is 122. The highest number of reported fires - 172 took place in 2008, and the least - 24 in 2017. The data has a growing trend.
When looking into fire subcategories, the most incidents belonged to: Outside Fires (53.6%), and Structure Fires (22.5%).
Fire incident types reported to NFIRS in Zip Code 78744


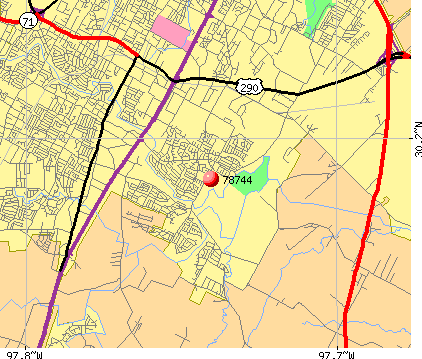 Nearest zip codes: 78719, 78747, 78741, 78745, 78704, 78702.
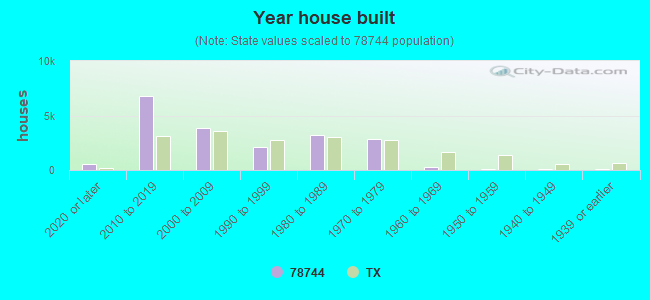


 Based on the data from the years 2002 - 2018 the average number of fire incidents per year is 122. The highest number of reported fires - 172 took place in 2008, and the least - 24 in 2017. The data has a growing trend.
 When looking into fire subcategories, the most incidents belonged to: Outside Fires (53.6%), and Structure Fires (22.5%).