Crime rate in Austin, Texas (TX): murders, rapes, robberies, assaults, burglaries, thefts, auto thefts, arson, law enforcement employees, police officers, crime map
Crime rate in Austin, TX
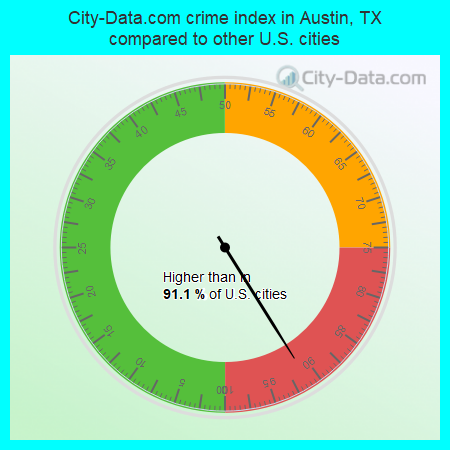
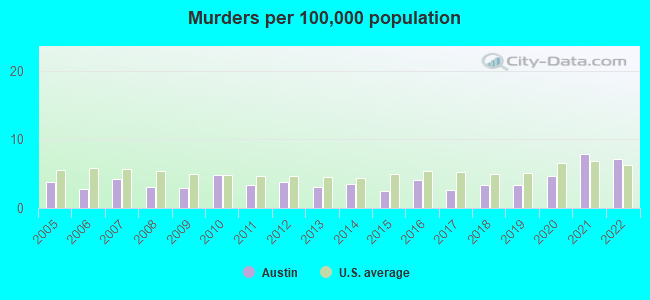
The 2022 crime rate in Austin, TX is 344 (City-Data.com crime index), which is 1.4 times greater than the U.S. average. It was higher than in 91.1% U.S. cities. The 2022 Austin crime rate rose by 6% compared to 2021. The number of homicides stood at 69 - a decrease of 11 compared to 2021. In the last 5 years Austin has seen rise of violent crime and rise of property crime.(Note: Higher means more crime)
| Austin: | 344.2 |
| Rollingwood: | 129.5 |
| West Lake Hills: | 116.1 |
| Sunset Valley: | 1,422.3 |
| Manor: | 122.1 |
| Bee Cave: | 125.4 |
| Pflugerville: | 135.1 |
| Lakeway: | 74.0 |
| Cedar Park: | 109.5 |
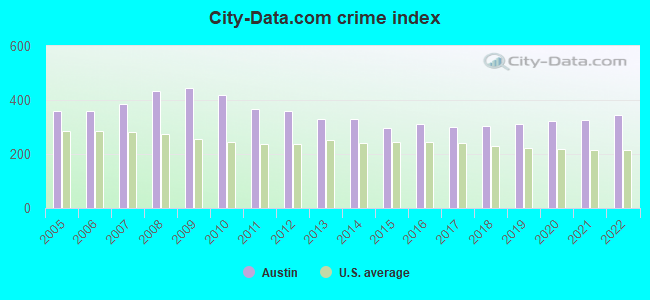
The City-Data.com crime index weighs serious crimes and violent crimes more heavily. Higher means more crime, U.S. average is 246.1. It adjusts for the number of visitors and daily workers commuting into cities.
- means the value is smaller than the state average.- means the value is about the same as the state average.
- means the value is bigger than the state average.
- means the value is much bigger than the state average.
According to our research of Texas and other state lists, there were 1,428 registered sex offenders living in Austin, Texas as of April 27, 2024.
The ratio of all residents to sex offenders in Austin is 664 to 1.
The ratio of registered sex offenders to all residents in this city is lower than the state average.
Violent crime rate in 2022
| Austin: | 308.2 |
| U.S. Average: | 219.8 |
Violent crime rate in 2021
| Austin: | 289.7 |
| U.S. Average: | 224.8 |
Violent crime rate in 2020
| Austin: | 271.2 |
| U.S. Average: | 228.2 |
Violent crime rate in 2019
| Austin: | 243.0 |
| U.S. Average: | 219.9 |
Violent crime rate in 2018
| Austin: | 236.5 |
| U.S. Average: | 221.2 |
Violent crime rate in 2017
| Austin: | 254.4 |
| U.S. Average: | 226.2 |
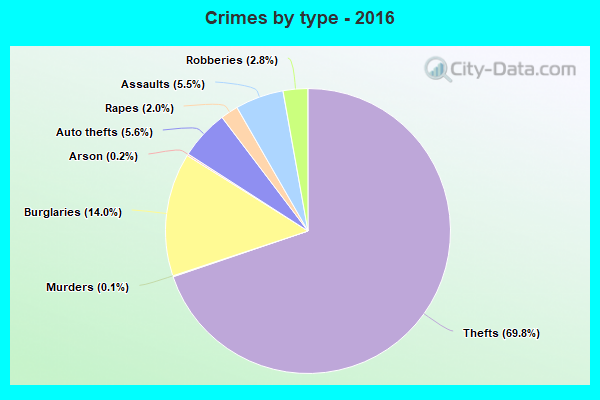
Violent crime rate in 2016
| Austin: | 249.1 |
| U.S. Average: | 227.3 |
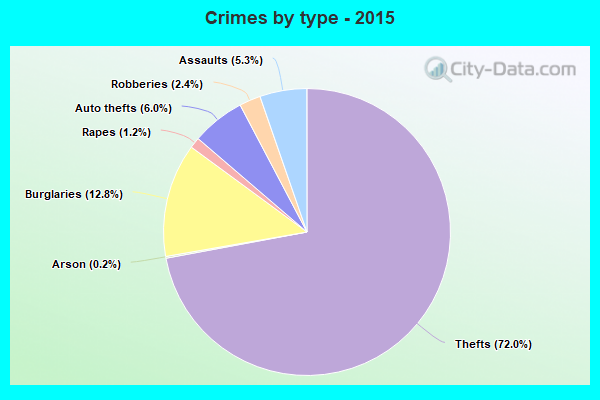
Violent crime rate in 2015
| Austin: | 215.9 |
| U.S. Average: | 219.3 |
Violent crime rate in 2014
| Austin: | 235.0 |
| U.S. Average: | 211.1 |
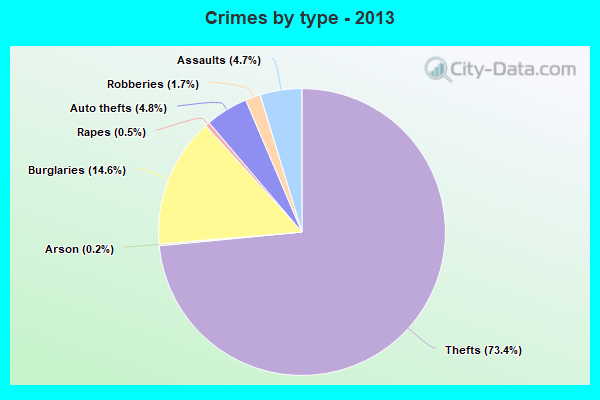
Violent crime rate in 2013
| Austin: | 198.9 |
| U.S. Average: | 214.2 |
Violent crime rate in 2012
| Austin: | 222.5 |
| U.S. Average: | 187.4 |
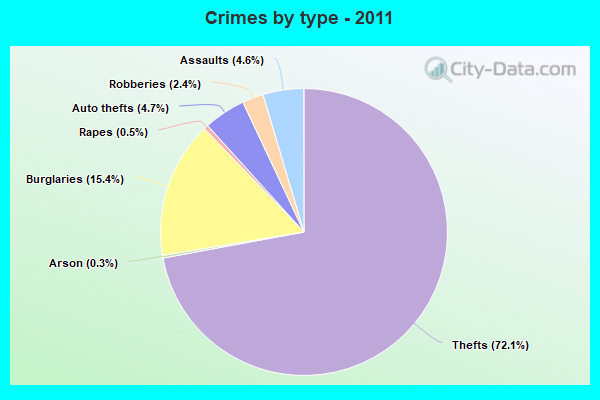
Violent crime rate in 2011
| Austin: | 233.1 |
| U.S. Average: | 187.1 |
Violent crime rate in 2010
| Austin: | 263.7 |
| U.S. Average: | 195.7 |
Violent crime rate in 2009
| Austin: | 283.2 |
| U.S. Average: | 208.9 |
Violent crime rate in 2008
| Austin: | 283.8 |
| U.S. Average: | 222.5 |
Violent crime rate in 2007
| Austin: | 248.1 |
| U.S. Average: | 229.1 |
Violent crime rate in 2006
| Austin: | 235.8 |
| U.S. Average: | 232.6 |
Violent crime rate in 2005
| Austin: | 226.3 |
| U.S. Average: | 227.0 |
Property crime rate in 2022
| Austin: | 309.8 |
| U.S. Average: | 166.5 |
Property crime rate in 2021
| Austin: | 283.9 |
| U.S. Average: | 157.8 |
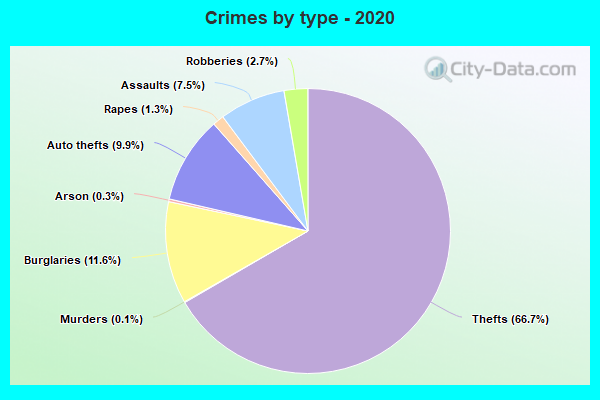
Property crime rate in 2020
| Austin: | 295.0 |
| U.S. Average: | 169.6 |
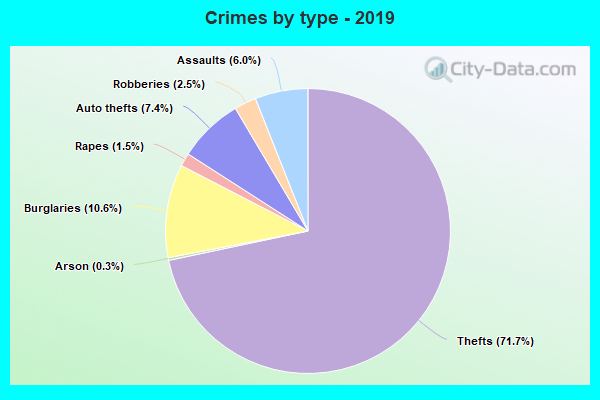
Property crime rate in 2019
| Austin: | 283.1 |
| U.S. Average: | 179.7 |
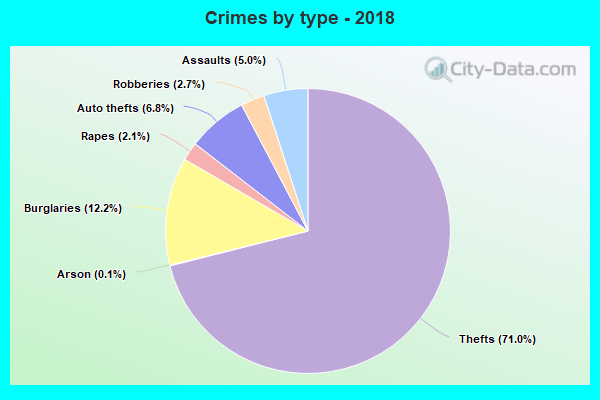
Property crime rate in 2018
| Austin: | 269.1 |
| U.S. Average: | 190.2 |
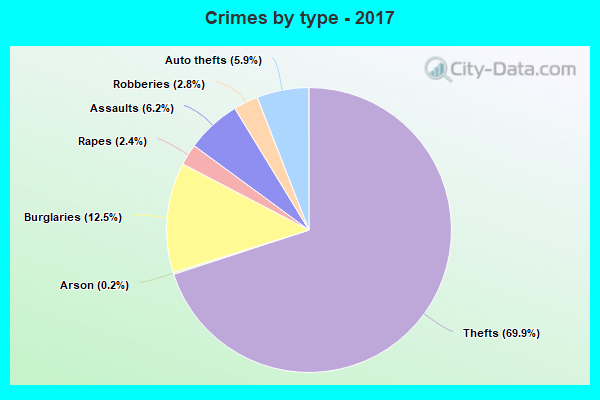
Property crime rate in 2017
| Austin: | 248.5 |
| U.S. Average: | 206.4 |
Property crime rate in 2016
| Austin: | 279.9 |
| U.S. Average: | 216.6 |
Property crime rate in 2015
| Austin: | 293.3 |
| U.S. Average: | 221.5 |
Property crime rate in 2014
| Austin: | 327.6 |
| U.S. Average: | 230.8 |
Property crime rate in 2013
| Austin: | 382.1 |
| U.S. Average: | 250.4 |
Property crime rate in 2012
| Austin: | 419.2 |
| U.S. Average: | 267.3 |
Property crime rate in 2011
| Austin: | 419.2 |
| U.S. Average: | 273.5 |
Property crime rate in 2010
| Austin: | 484.4 |
| U.S. Average: | 276.4 |
Property crime rate in 2009
| Austin: | 511.9 |
| U.S. Average: | 285.6 |
Property crime rate in 2008
| Austin: | 503.1 |
| U.S. Average: | 302.2 |
Property crime rate in 2007
| Austin: | 436.5 |
| U.S. Average: | 309.2 |
Property crime rate in 2006
| Austin: | 403.4 |
| U.S. Average: | 317.3 |
Property crime rate in 2005
| Austin: | 410.5 |
| U.S. Average: | 322.3 |
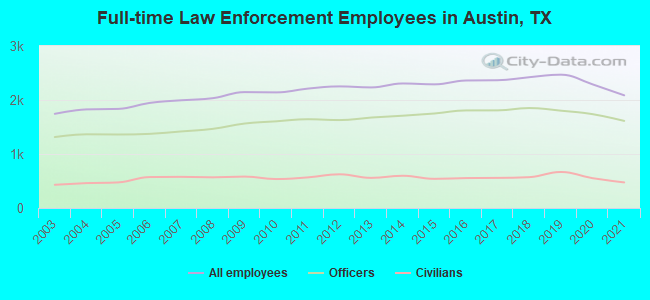
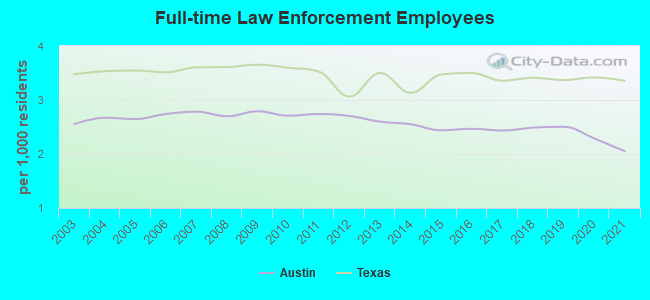
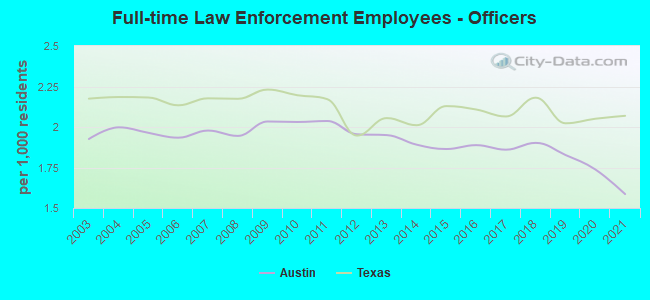
Full-time law enforcement employees in 2021, including police officers: 2,087 (1,613 officers - 1,436 male; 177 female).
| Officers per 1,000 residents here: | 1.59 |
| Texas average: | 2.07 |
Full-time law enforcement employees in 2020, including police officers: 2,290 (1,738 officers - 1,552 male; 186 female).
| Officers per 1,000 residents here: | 1.74 |
| Texas average: | 2.05 |
Full-time law enforcement employees in 2019, including police officers: 2,469 (1,802 officers - 1,616 male; 186 female).
| Officers per 1,000 residents here: | 1.83 |
| Texas average: | 2.02 |
Full-time law enforcement employees in 2018, including police officers: 2,422 (1,851 officers - 1,663 male; 188 female).
| Officers per 1,000 residents here: | 1.90 |
| Texas average: | 2.18 |
Full-time law enforcement employees in 2017, including police officers: 2,366 (1,808 officers - 1,630 male; 178 female).
| Officers per 1,000 residents here: | 1.86 |
| Texas average: | 2.06 |
Full-time law enforcement employees in 2016, including police officers: 2,361 (1,807 officers - 1,635 male; 172 female).
| Officers per 1,000 residents here: | 1.89 |
| Texas average: | 2.11 |
Full-time law enforcement employees in 2015, including police officers: 2,290 (1,750 officers - 1,575 male; 175 female).
| Officers per 1,000 residents here: | 1.86 |
| Texas average: | 2.13 |
Full-time law enforcement employees in 2014, including police officers: 2,306 (1,709 officers - 1,538 male; 171 female).
| Officers per 1,000 residents here: | 1.89 |
| Texas average: | 2.01 |
Full-time law enforcement employees in 2013, including police officers: 2,233 (1,675 officers - 1,505 male; 170 female).
| Officers per 1,000 residents here: | 1.95 |
| Texas average: | 2.05 |
Full-time law enforcement employees in 2012, including police officers: 2,252 (1,628 officers - 1,454 male; 174 female).
| Officers per 1,000 residents here: | 1.95 |
| Texas average: | 1.95 |
Full-time law enforcement employees in 2011, including police officers: 2,211 (1,644 officers - 1,465 male; 179 female).
| Officers per 1,000 residents here: | 2.04 |
| Texas average: | 2.17 |
Full-time law enforcement employees in 2010, including police officers: 2,141 (1,605 officers - 1,431 male; 174 female).
| Officers per 1,000 residents here: | 2.03 |
| Texas average: | 2.20 |
Full-time law enforcement employees in 2009, including police officers: 2,146 (1,564 officers - 1,383 male; 181 female).
| Officers per 1,000 residents here: | 2.03 |
| Texas average: | 2.23 |
Full-time law enforcement employees in 2008, including police officers: 2,034 (1,466 officers - 1,291 male; 175 female).
| Officers per 1,000 residents here: | 1.95 |
| Texas average: | 2.17 |
Full-time law enforcement employees in 2007, including police officers: 1,995 (1,418 officers - 1,253 male; 165 female).
| Officers per 1,000 residents here: | 1.98 |
| Texas average: | 2.18 |
Full-time law enforcement employees in 2006, including police officers: 1,946 (1,373 officers - 1,216 male; 157 female).
| Officers per 1,000 residents here: | 1.93 |
| Texas average: | 2.13 |
Full-time law enforcement employees in 2005, including police officers: 1,835 (1,361 officers - 1,207 male; 154 female).
| Officers per 1,000 residents here: | 1.96 |
| Texas average: | 2.18 |
Full-time law enforcement employees in 2004, including police officers: 1,826 (1,365 officers - 1,204 male; 161 female).
| Officers per 1,000 residents here: | 2.00 |
| Texas average: | 2.19 |
Full-time law enforcement employees in 2003, including police officers: 1,744 (1,314 officers - 1,162 male; 152 female).
| Officers per 1,000 residents here: | 1.93 |
| Texas average: | 2.17 |


Zip codes: 78610, 78613, 78617, 78641, 78652, 78653, 78660, 78664, 78681, 78701, 78702, 78703, 78704, 78705, 78712, 78717, 78719, 78721, 78722, 78723, 78724, 78725, 78726, 78727, 78728, 78729, 78730, 78731, 78732, 78733, 78734, 78735, 78736, 78737, 78738, 78739, 78741, 78742, 78744, 78745, 78746, 78747, 78748, 78749, 78750, 78751, 78752, 78753, 78754, 78756, 78757, 78758, 78759.