Crime rate in Baytown, Texas (TX): murders, rapes, robberies, assaults, burglaries, thefts, auto thefts, arson, law enforcement employees, police officers, crime map
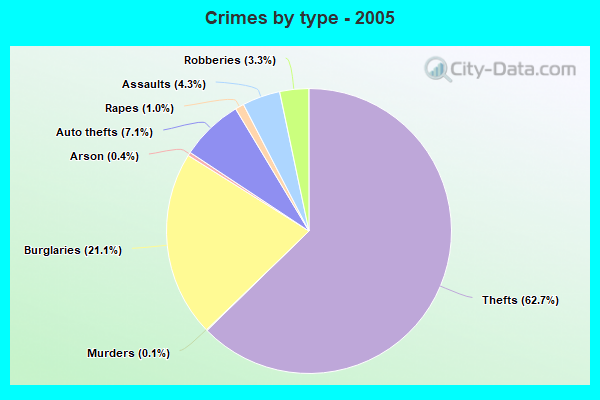
Crime rate in Baytown, TX
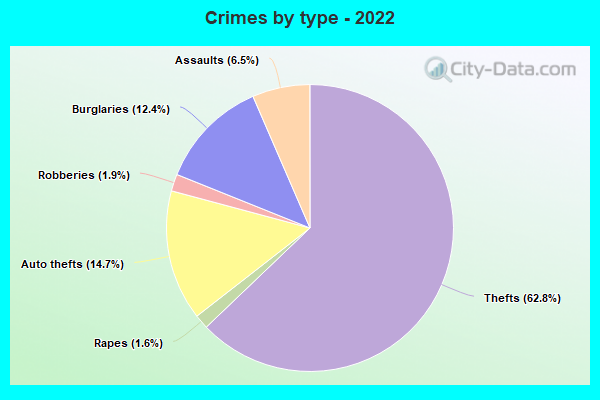
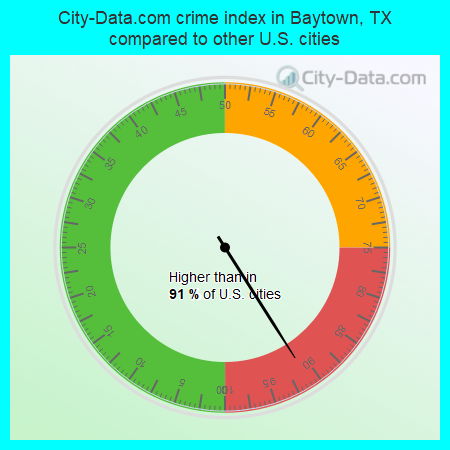
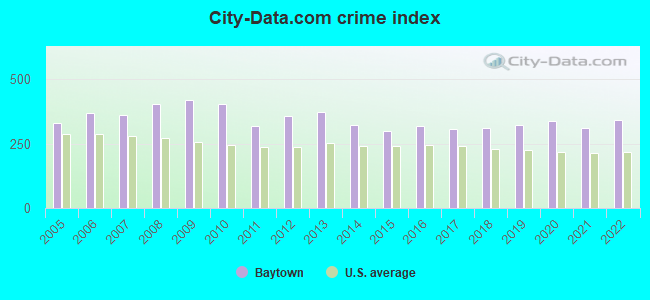
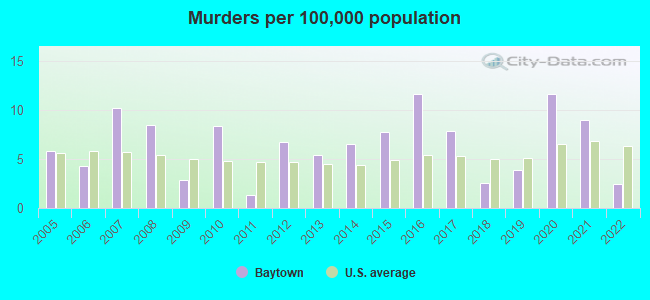
The 2022 crime rate in Baytown, TX is 341 (City-Data.com crime index), which is 1.4 times higher than the U.S. average. It was higher than in 91.0% U.S. cities. The 2022 Baytown crime rate rose by 9% compared to 2021. The number of homicides stood at 2 - a decrease of 5 compared to 2021. In the last 5 years Baytown has seen rise of violent crime and rise of property crime.See how dangerous Baytown, TX is compared to the nearest cities:
(Note: Higher means more crime)
(Note: Higher means more crime)
| Baytown: | 341.2 |
| La Porte: | 135.1 |
| Shoreacres: | 36.9 |
| Mont Belvieu: | 188.6 |
| Deer Park: | 114.1 |
| Seabrook: | 174.6 |
| Pasadena: | 337.1 |
| Kemah: | 365.7 |
| Nassau Bay: | 156.7 |
The City-Data.com crime index weighs serious crimes and violent crimes more heavily. Higher means more crime, U.S. average is 246.1. It adjusts for the number of visitors and daily workers commuting into cities.
- means the value is smaller than the state average.- means the value is about the same as the state average.
- means the value is bigger than the state average.
- means the value is much bigger than the state average.
According to our research of Texas and other state lists, there were 240 registered sex offenders living in Baytown, Texas as of May 05, 2024.
The ratio of all residents to sex offenders in Baytown is 325 to 1.
Violent crime rate in 2022
| Baytown: | 259.0 |
| U.S. Average: | 219.8 |
Violent crime rate in 2021
| Baytown: | 230.0 |
| U.S. Average: | 224.8 |
Violent crime rate in 2020
| Baytown: | 259.6 |
| U.S. Average: | 228.2 |
Violent crime rate in 2019
| Baytown: | 246.4 |
| U.S. Average: | 219.9 |
Violent crime rate in 2018
| Baytown: | 221.2 |
| U.S. Average: | 221.2 |
Violent crime rate in 2017
| Baytown: | 224.2 |
| U.S. Average: | 226.2 |
Violent crime rate in 2016
| Baytown: | 229.2 |
| U.S. Average: | 227.3 |
Violent crime rate in 2015
| Baytown: | 184.7 |
| U.S. Average: | 219.3 |
Violent crime rate in 2014
| Baytown: | 188.8 |
| U.S. Average: | 211.1 |
Violent crime rate in 2013
| Baytown: | 214.4 |
| U.S. Average: | 214.2 |
Violent crime rate in 2012
| Baytown: | 186.1 |
| U.S. Average: | 187.4 |
Violent crime rate in 2011
| Baytown: | 155.5 |
| U.S. Average: | 187.1 |
Violent crime rate in 2010
| Baytown: | 236.8 |
| U.S. Average: | 195.7 |
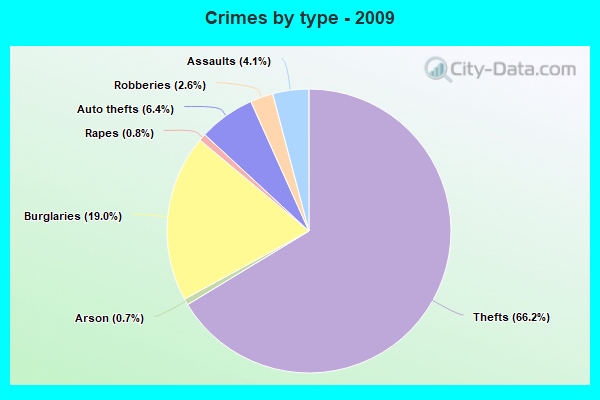
Violent crime rate in 2009
| Baytown: | 261.4 |
| U.S. Average: | 208.9 |
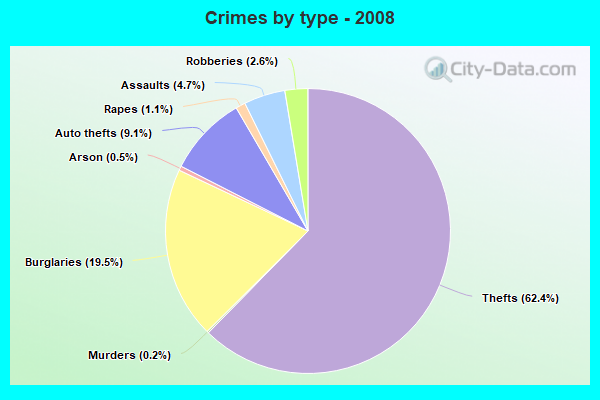
Violent crime rate in 2008
| Baytown: | 271.3 |
| U.S. Average: | 222.5 |
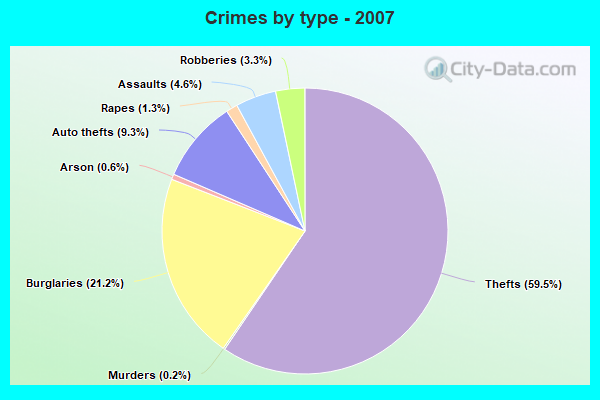
Violent crime rate in 2007
| Baytown: | 258.1 |
| U.S. Average: | 229.1 |
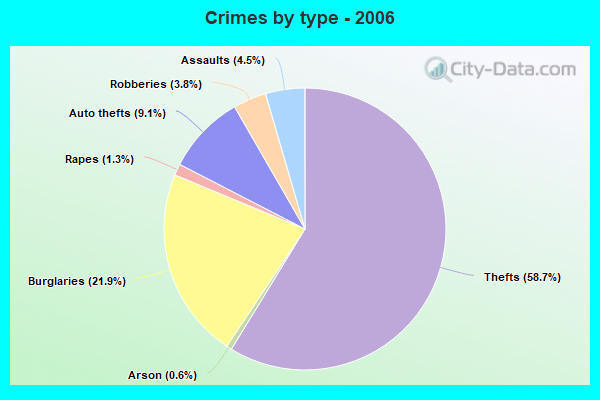
Violent crime rate in 2006
| Baytown: | 263.9 |
| U.S. Average: | 232.6 |
Violent crime rate in 2005
| Baytown: | 224.3 |
| U.S. Average: | 227.0 |
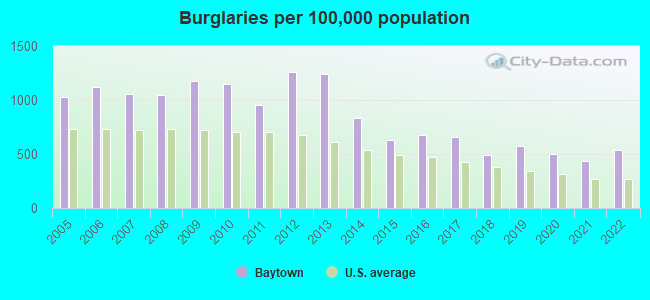
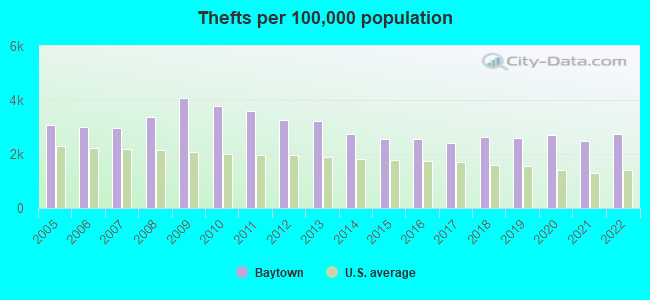
Property crime rate in 2022
| Baytown: | 339.6 |
| U.S. Average: | 166.5 |
Property crime rate in 2021
| Baytown: | 300.6 |
| U.S. Average: | 157.8 |
Property crime rate in 2020
| Baytown: | 316.7 |
| U.S. Average: | 169.6 |
Property crime rate in 2019
| Baytown: | 318.6 |
| U.S. Average: | 179.7 |
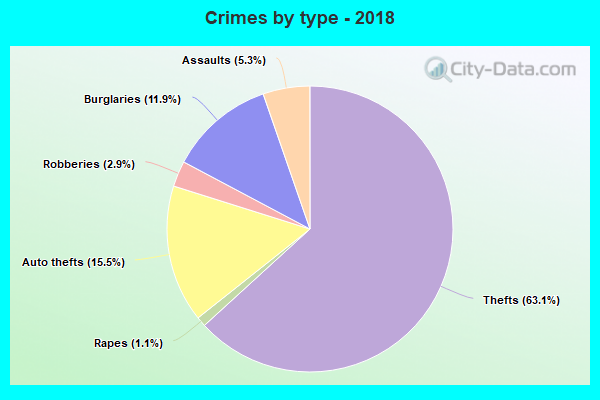
Property crime rate in 2018
| Baytown: | 326.4 |
| U.S. Average: | 190.2 |
Property crime rate in 2017
| Baytown: | 316.0 |
| U.S. Average: | 206.4 |
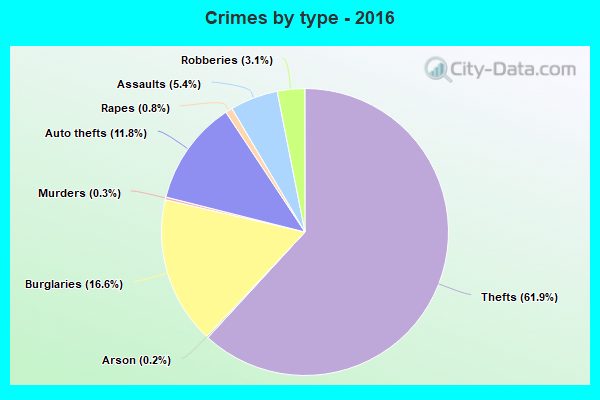
Property crime rate in 2016
| Baytown: | 335.3 |
| U.S. Average: | 216.6 |
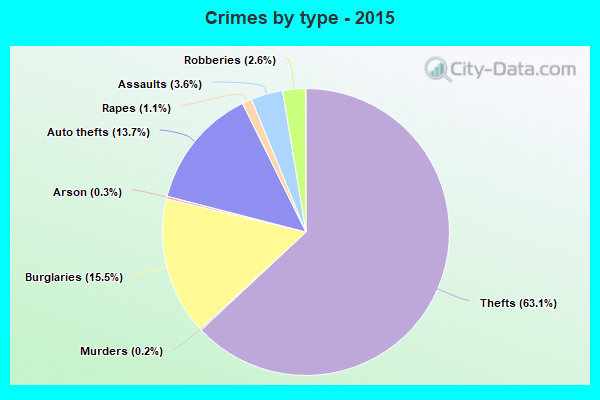
Property crime rate in 2015
| Baytown: | 335.5 |
| U.S. Average: | 221.5 |
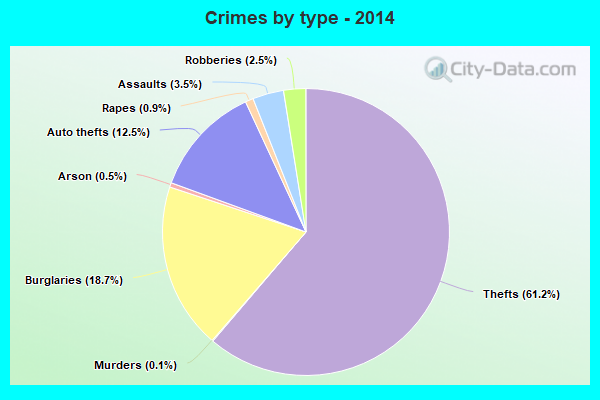
Property crime rate in 2014
| Baytown: | 388.6 |
| U.S. Average: | 230.8 |
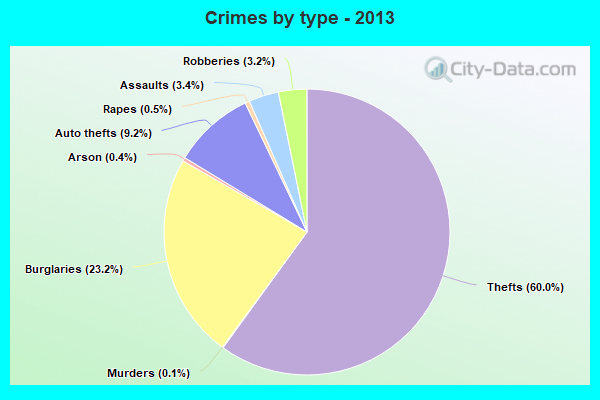
Property crime rate in 2013
| Baytown: | 483.6 |
| U.S. Average: | 250.4 |
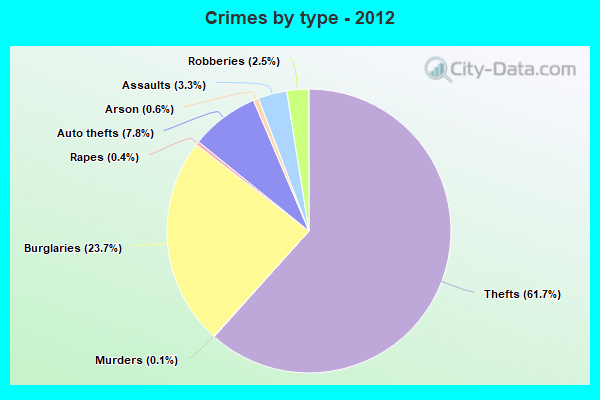
Property crime rate in 2012
| Baytown: | 478.0 |
| U.S. Average: | 267.3 |
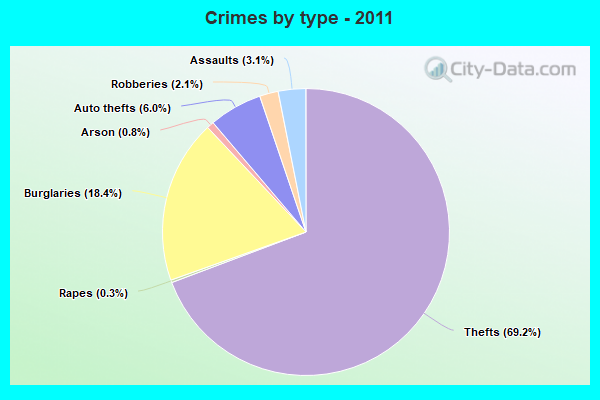
Property crime rate in 2011
| Baytown: | 416.6 |
| U.S. Average: | 273.5 |
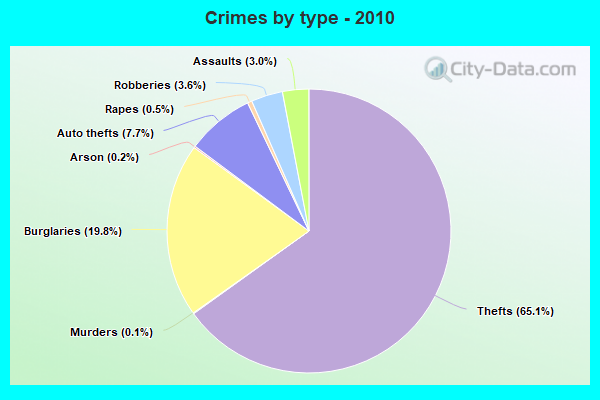
Property crime rate in 2010
| Baytown: | 484.3 |
| U.S. Average: | 276.4 |
Property crime rate in 2009
| Baytown: | 498.6 |
| U.S. Average: | 285.6 |
Property crime rate in 2008
| Baytown: | 451.2 |
| U.S. Average: | 302.2 |
Property crime rate in 2007
| Baytown: | 393.4 |
| U.S. Average: | 309.2 |
Property crime rate in 2006
| Baytown: | 407.7 |
| U.S. Average: | 317.3 |
Property crime rate in 2005
| Baytown: | 377.0 |
| U.S. Average: | 322.3 |
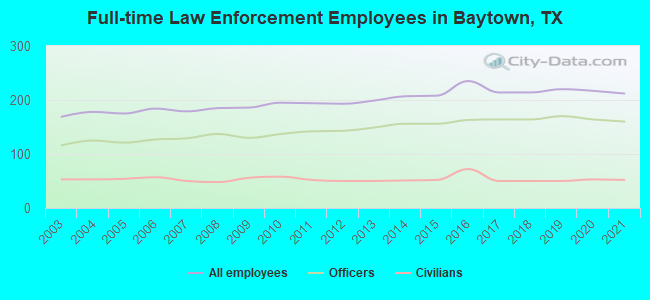
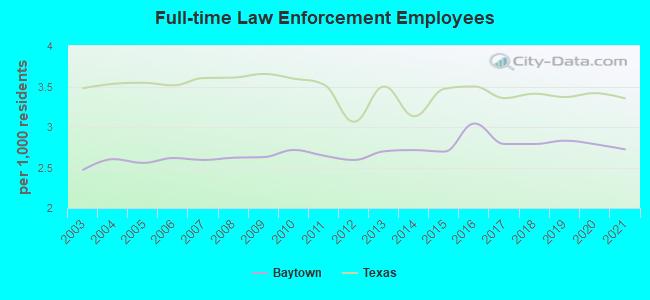
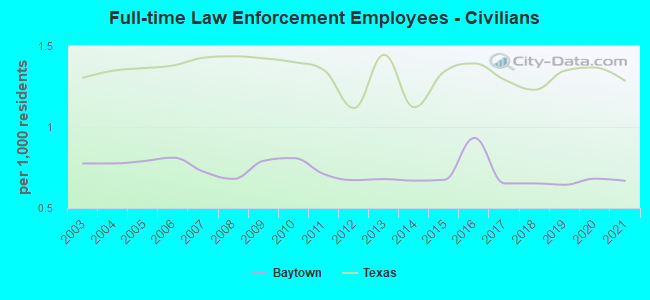
Full-time law enforcement employees in 2021, including police officers: 212 (160 officers - 142 male; 18 female).
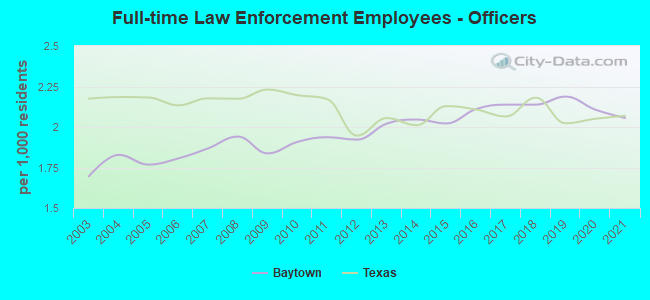
| Officers per 1,000 residents here: | 2.06 |
| Texas average: | 2.07 |
Full-time law enforcement employees in 2020, including police officers: 217 (164 officers - 146 male; 18 female).
| Officers per 1,000 residents here: | 2.11 |
| Texas average: | 2.05 |
Full-time law enforcement employees in 2019, including police officers: 220 (170 officers - 152 male; 18 female).
| Officers per 1,000 residents here: | 2.19 |
| Texas average: | 2.02 |
Full-time law enforcement employees in 2017, including police officers: 214 (164 officers - 151 male; 13 female).
| Officers per 1,000 residents here: | 2.14 |
| Texas average: | 2.06 |
Full-time law enforcement employees in 2016, including police officers: 235 (163 officers - 149 male; 14 female).
| Officers per 1,000 residents here: | 2.11 |
| Texas average: | 2.11 |
Full-time law enforcement employees in 2015, including police officers: 208 (156 officers - 141 male; 15 female).
| Officers per 1,000 residents here: | 2.02 |
| Texas average: | 2.13 |
Full-time law enforcement employees in 2014, including police officers: 207 (156 officers - 141 male; 15 female).
| Officers per 1,000 residents here: | 2.05 |
| Texas average: | 2.01 |
Full-time law enforcement employees in 2013, including police officers: 199 (149 officers - 137 male; 12 female).
| Officers per 1,000 residents here: | 2.02 |
| Texas average: | 2.05 |
Full-time law enforcement employees in 2012, including police officers: 193 (143 officers - 130 male; 13 female).
| Officers per 1,000 residents here: | 1.92 |
| Texas average: | 1.95 |
Full-time law enforcement employees in 2011, including police officers: 194 (142 officers - 128 male; 14 female).
| Officers per 1,000 residents here: | 1.94 |
| Texas average: | 2.17 |
Full-time law enforcement employees in 2010, including police officers: 195 (137 officers - 124 male; 13 female).
| Officers per 1,000 residents here: | 1.91 |
| Texas average: | 2.20 |
Full-time law enforcement employees in 2009, including police officers: 186 (130 officers - 120 male; 10 female).
| Officers per 1,000 residents here: | 1.84 |
| Texas average: | 2.23 |
Full-time law enforcement employees in 2008, including police officers: 185 (137 officers - 128 male; 9 female).
| Officers per 1,000 residents here: | 1.94 |
| Texas average: | 2.17 |
Full-time law enforcement employees in 2007, including police officers: 179 (129 officers - 118 male; 11 female).
| Officers per 1,000 residents here: | 1.87 |
| Texas average: | 2.18 |
Full-time law enforcement employees in 2006, including police officers: 184 (127 officers - 116 male; 11 female).
| Officers per 1,000 residents here: | 1.81 |
| Texas average: | 2.13 |
Full-time law enforcement employees in 2005, including police officers: 175 (121 officers - 110 male; 11 female).
| Officers per 1,000 residents here: | 1.77 |
| Texas average: | 2.18 |
Full-time law enforcement employees in 2004, including police officers: 178 (125 officers - 114 male; 11 female).
| Officers per 1,000 residents here: | 1.83 |
| Texas average: | 2.19 |
Full-time law enforcement employees in 2003, including police officers: 169 (116 officers - 105 male; 11 female).
| Officers per 1,000 residents here: | 1.70 |
| Texas average: | 2.17 |