Crime rate in Green Bay, Wisconsin (WI): murders, rapes, robberies, assaults, burglaries, thefts, auto thefts, arson, law enforcement employees, police officers, crime map
Crime rate in Green Bay, WI
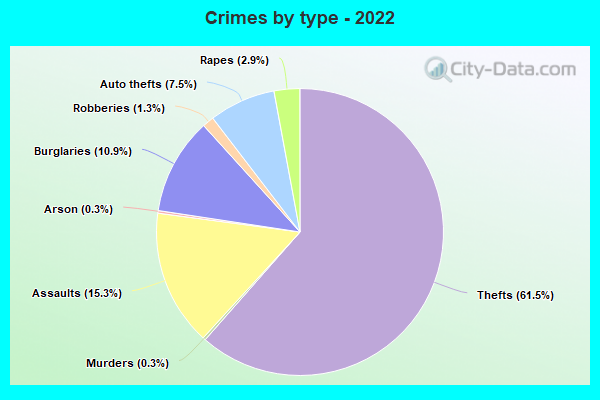
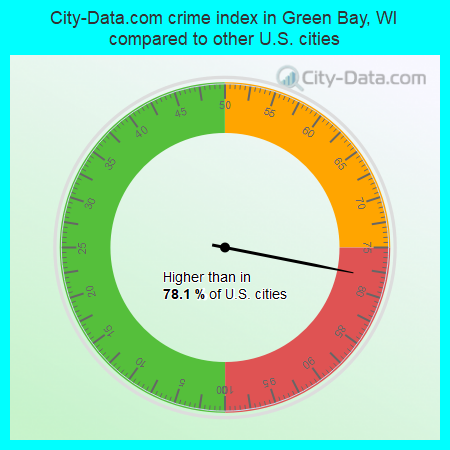
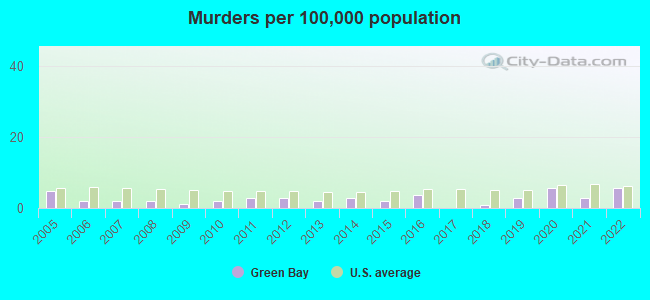
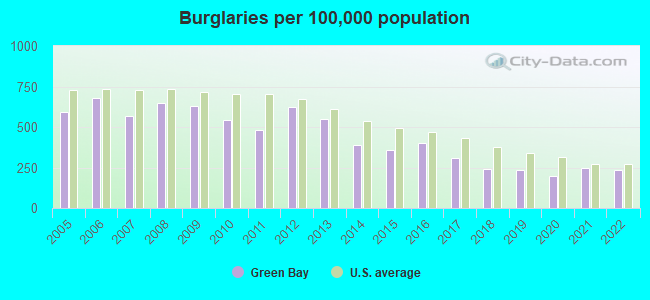
The 2022 crime rate in Green Bay, WI is 218 (City-Data.com crime index), which is about the average for the U.S. cities. It was higher than in 78.1% U.S. cities. The 2022 Green Bay crime rate fell by 5% compared to 2021. The number of homicides stood at 6 - an increase of 3 compared to 2021. In the last 5 years Green Bay has seen decline of violent crime and rise of property crime.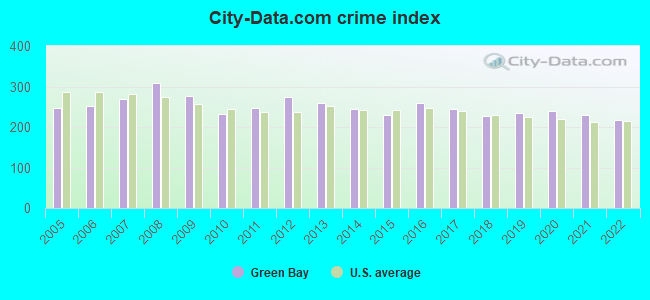
The City-Data.com crime index weighs serious crimes and violent crimes more heavily. Higher means more crime, U.S. average is 246.1. It adjusts for the number of visitors and daily workers commuting into cities.
- means the value is smaller than the state average.- means the value is about the same as the state average.
- means the value is bigger than the state average.
- means the value is much bigger than the state average.
According to our research of Wisconsin and other state lists, there were 486 registered sex offenders living in Green Bay, Wisconsin as of April 28, 2024.
The ratio of all residents to sex offenders in Green Bay is 216 to 1.
Violent crime rate in 2022
| Green Bay: | 253.0 |
| U.S. Average: | 219.8 |
Violent crime rate in 2021
| Green Bay: | 284.6 |
| U.S. Average: | 224.8 |
Violent crime rate in 2020
| Green Bay: | 313.9 |
| U.S. Average: | 228.2 |
Violent crime rate in 2019
| Green Bay: | 295.3 |
| U.S. Average: | 219.9 |
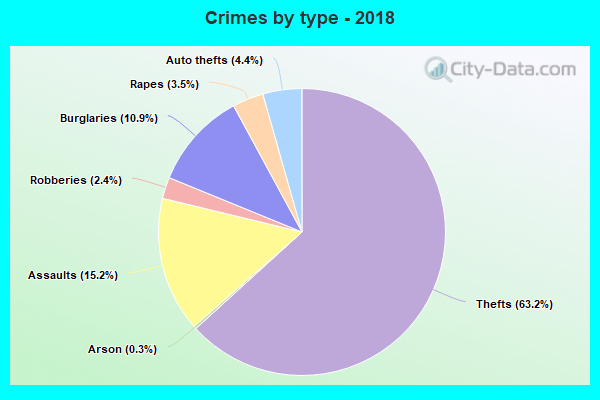
Violent crime rate in 2018
| Green Bay: | 271.7 |
| U.S. Average: | 221.2 |
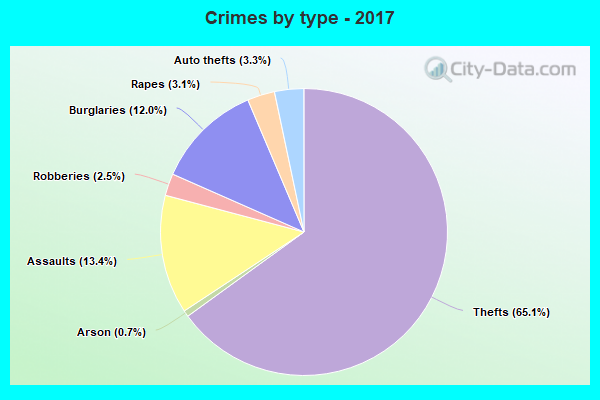
Violent crime rate in 2017
| Green Bay: | 279.6 |
| U.S. Average: | 226.2 |
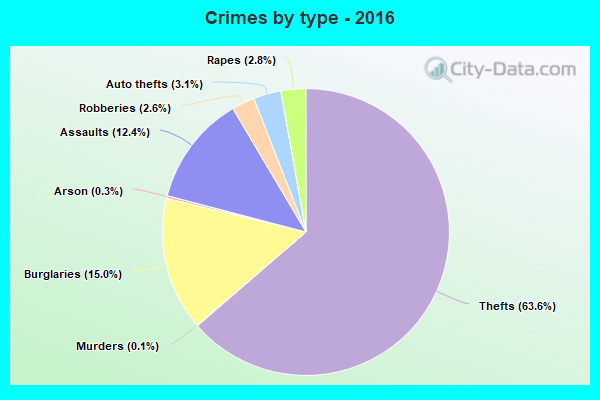
Violent crime rate in 2016
| Green Bay: | 284.5 |
| U.S. Average: | 227.3 |
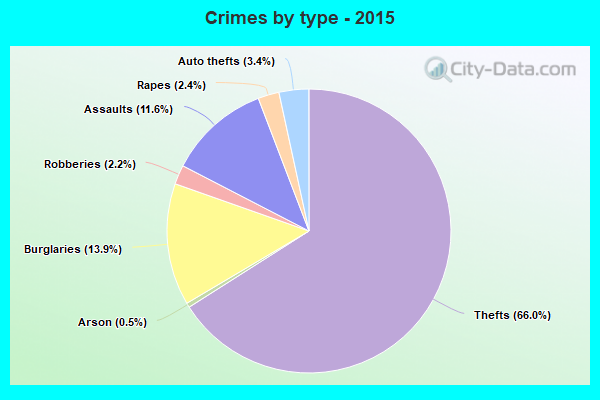
Violent crime rate in 2015
| Green Bay: | 241.6 |
| U.S. Average: | 219.3 |
Violent crime rate in 2014
| Green Bay: | 278.2 |
| U.S. Average: | 211.1 |
Violent crime rate in 2013
| Green Bay: | 267.3 |
| U.S. Average: | 214.2 |
Violent crime rate in 2012
| Green Bay: | 271.5 |
| U.S. Average: | 187.4 |
Violent crime rate in 2011
| Green Bay: | 243.5 |
| U.S. Average: | 187.1 |
Violent crime rate in 2010
| Green Bay: | 206.6 |
| U.S. Average: | 195.7 |
Violent crime rate in 2009
| Green Bay: | 268.8 |
| U.S. Average: | 208.9 |
Violent crime rate in 2008
| Green Bay: | 290.5 |
| U.S. Average: | 222.5 |
Violent crime rate in 2007
| Green Bay: | 294.3 |
| U.S. Average: | 229.1 |
Violent crime rate in 2006
| Green Bay: | 258.2 |
| U.S. Average: | 232.6 |
Violent crime rate in 2005
| Green Bay: | 238.8 |
| U.S. Average: | 227.0 |
Property crime rate in 2022
| Green Bay: | 137.7 |
| U.S. Average: | 166.5 |
Property crime rate in 2021
| Green Bay: | 129.1 |
| U.S. Average: | 157.8 |
Property crime rate in 2020
| Green Bay: | 117.8 |
| U.S. Average: | 169.6 |
Property crime rate in 2019
| Green Bay: | 129.2 |
| U.S. Average: | 179.7 |
Property crime rate in 2018
| Green Bay: | 131.2 |
| U.S. Average: | 190.2 |
Property crime rate in 2017
| Green Bay: | 156.8 |
| U.S. Average: | 206.4 |
Property crime rate in 2016
| Green Bay: | 178.2 |
| U.S. Average: | 216.6 |
Property crime rate in 2015
| Green Bay: | 168.8 |
| U.S. Average: | 221.5 |
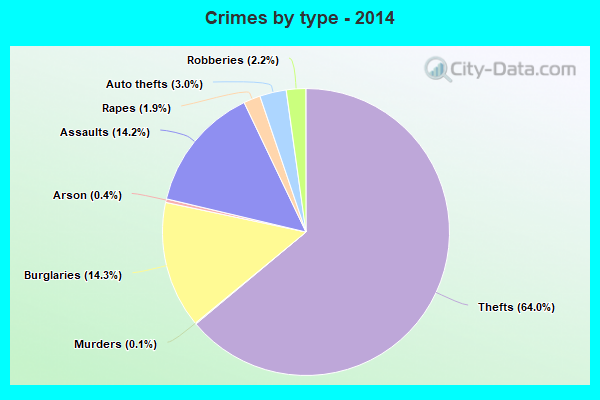
Property crime rate in 2014
| Green Bay: | 176.3 |
| U.S. Average: | 230.8 |
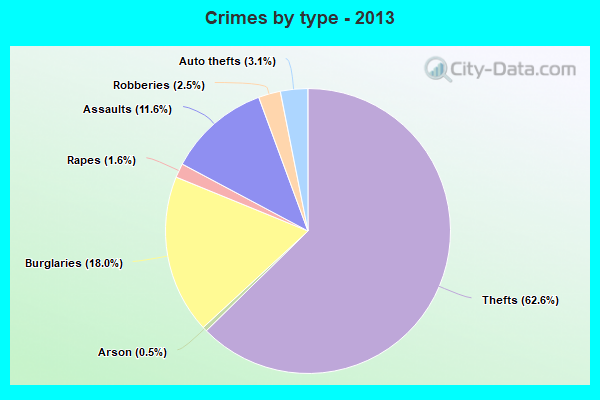
Property crime rate in 2013
| Green Bay: | 219.3 |
| U.S. Average: | 250.4 |
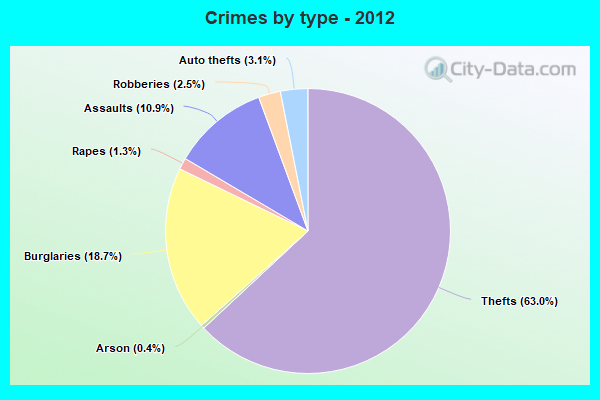
Property crime rate in 2012
| Green Bay: | 244.7 |
| U.S. Average: | 267.3 |
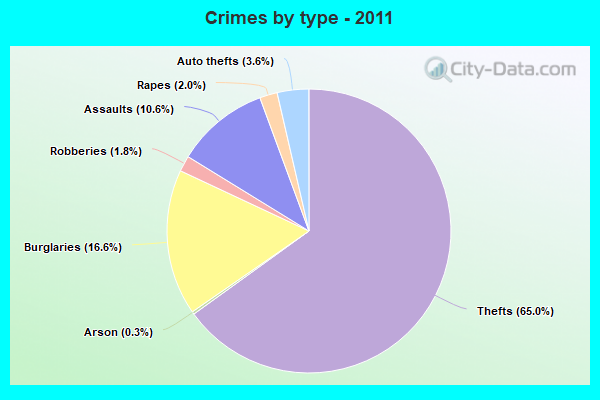
Property crime rate in 2011
| Green Bay: | 206.2 |
| U.S. Average: | 273.5 |
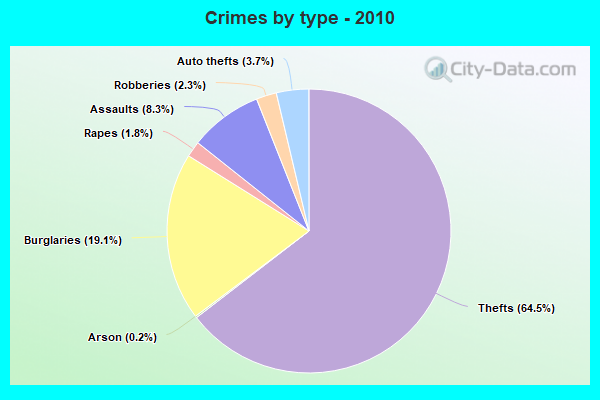
Property crime rate in 2010
| Green Bay: | 217.1 |
| U.S. Average: | 276.4 |
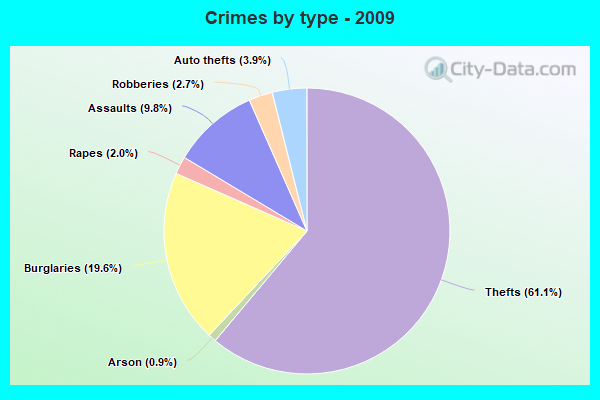
Property crime rate in 2009
| Green Bay: | 243.1 |
| U.S. Average: | 285.6 |
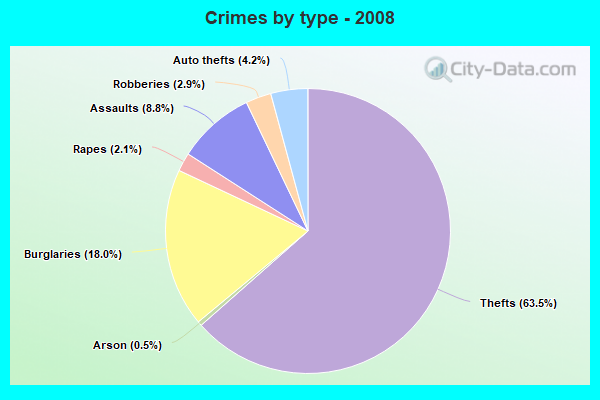
Property crime rate in 2008
| Green Bay: | 266.9 |
| U.S. Average: | 302.2 |
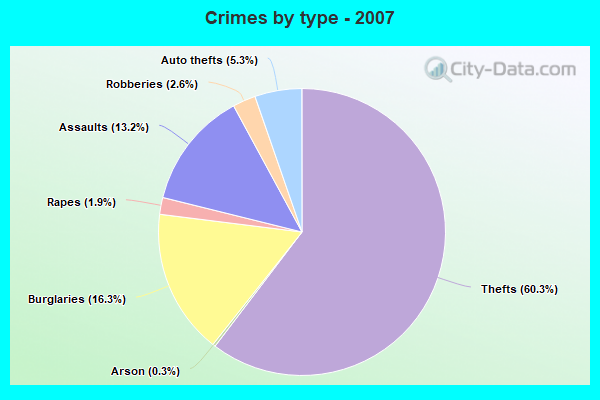
Property crime rate in 2007
| Green Bay: | 209.5 |
| U.S. Average: | 309.2 |
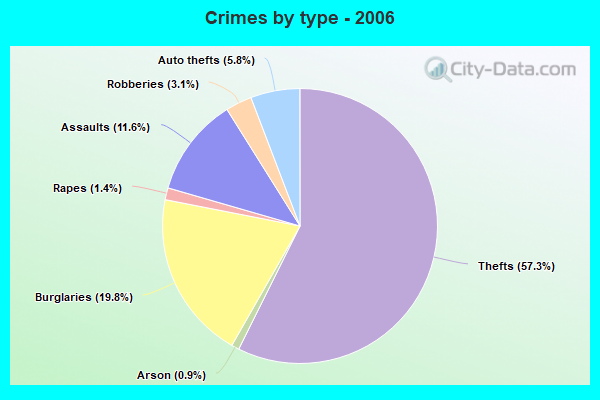
Property crime rate in 2006
| Green Bay: | 224.4 |
| U.S. Average: | 317.3 |
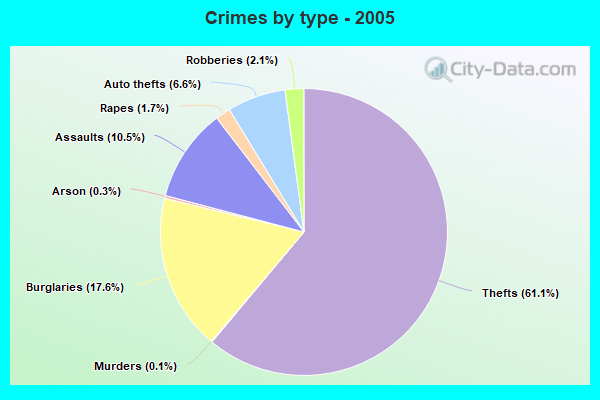
Property crime rate in 2005
| Green Bay: | 218.6 |
| U.S. Average: | 322.3 |
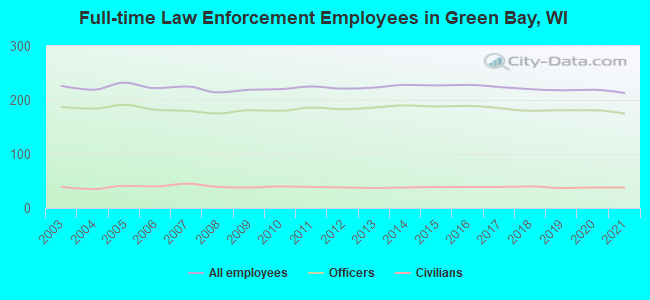
Full-time law enforcement employees in 2021, including police officers: 213 (175 officers - 145 male; 30 female).
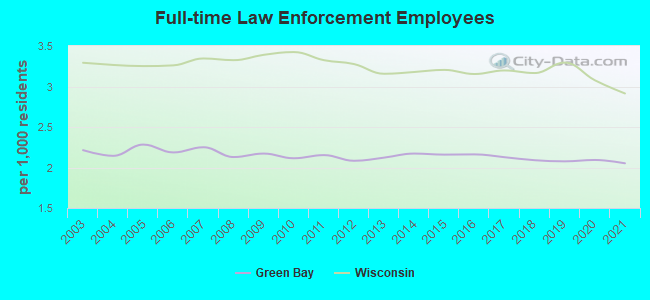
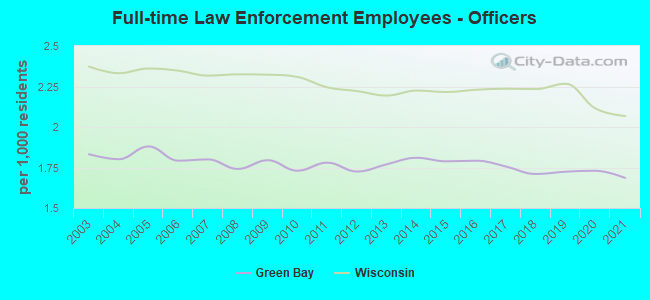
| Officers per 1,000 residents here: | 1.69 |
| Wisconsin average: | 2.07 |
Full-time law enforcement employees in 2020, including police officers: 219 (181 officers - 153 male; 28 female).
| Officers per 1,000 residents here: | 1.73 |
| Wisconsin average: | 2.11 |
Full-time law enforcement employees in 2019, including police officers: 218 (181 officers - 154 male; 27 female).
| Officers per 1,000 residents here: | 1.72 |
| Wisconsin average: | 2.27 |
Full-time law enforcement employees in 2018, including police officers: 220 (180 officers - 155 male; 25 female).
| Officers per 1,000 residents here: | 1.71 |
| Wisconsin average: | 2.23 |
Full-time law enforcement employees in 2017, including police officers: 224 (185 officers - 161 male; 24 female).
| Officers per 1,000 residents here: | 1.76 |
| Wisconsin average: | 2.24 |
Full-time law enforcement employees in 2016, including police officers: 228 (189 officers - 166 male; 23 female).
| Officers per 1,000 residents here: | 1.79 |
| Wisconsin average: | 2.23 |
Full-time law enforcement employees in 2015, including police officers: 227 (188 officers - 163 male; 25 female).
| Officers per 1,000 residents here: | 1.79 |
| Wisconsin average: | 2.22 |
Full-time law enforcement employees in 2014, including police officers: 228 (190 officers - 168 male; 22 female).
| Officers per 1,000 residents here: | 1.81 |
| Wisconsin average: | 2.23 |
Full-time law enforcement employees in 2013, including police officers: 223 (186 officers - 165 male; 21 female).
| Officers per 1,000 residents here: | 1.77 |
| Wisconsin average: | 2.19 |
Full-time law enforcement employees in 2012, including police officers: 221 (183 officers - 165 male; 18 female).
| Officers per 1,000 residents here: | 1.73 |
| Wisconsin average: | 2.22 |
Full-time law enforcement employees in 2011, including police officers: 225 (186 officers - 170 male; 16 female).
| Officers per 1,000 residents here: | 1.78 |
| Wisconsin average: | 2.24 |
Full-time law enforcement employees in 2010, including police officers: 220 (180 officers - 165 male; 15 female).
| Officers per 1,000 residents here: | 1.73 |
| Wisconsin average: | 2.31 |
Full-time law enforcement employees in 2009, including police officers: 219 (181 officers - 167 male; 14 female).
| Officers per 1,000 residents here: | 1.79 |
| Wisconsin average: | 2.32 |
Full-time law enforcement employees in 2008, including police officers: 214 (175 officers - 160 male; 15 female).
| Officers per 1,000 residents here: | 1.74 |
| Wisconsin average: | 2.32 |
Full-time law enforcement employees in 2007, including police officers: 225 (180 officers - 164 male; 16 female).
| Officers per 1,000 residents here: | 1.80 |
| Wisconsin average: | 2.32 |
Full-time law enforcement employees in 2006, including police officers: 222 (182 officers - 166 male; 16 female).
| Officers per 1,000 residents here: | 1.79 |
| Wisconsin average: | 2.35 |
Full-time law enforcement employees in 2005, including police officers: 232 (191 officers - 175 male; 16 female).
| Officers per 1,000 residents here: | 1.88 |
| Wisconsin average: | 2.36 |
Full-time law enforcement employees in 2004, including police officers: 219 (184 officers - 171 male; 13 female).
| Officers per 1,000 residents here: | 1.80 |
| Wisconsin average: | 2.33 |
Full-time law enforcement employees in 2003, including police officers: 226 (187 officers - 173 male; 14 female).
| Officers per 1,000 residents here: | 1.83 |
| Wisconsin average: | 2.37 |