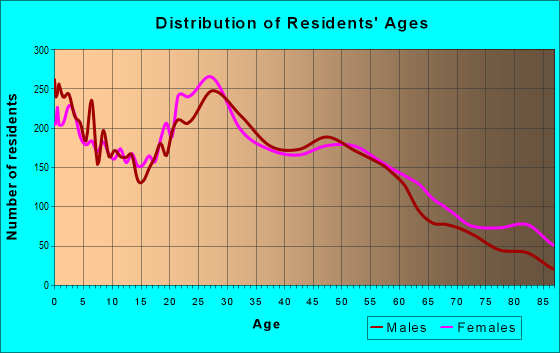
Estimated zip code population in 2022: 27,414 Zip code population in 2010: 27,041 Zip code population in 2000: 27,638
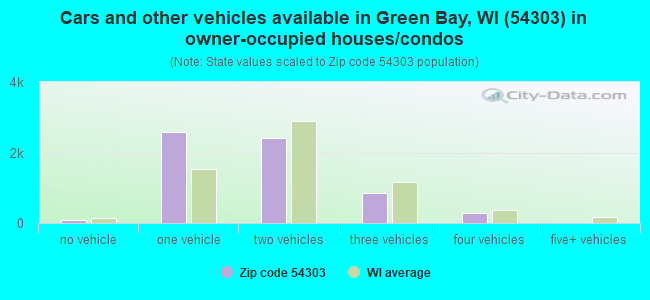
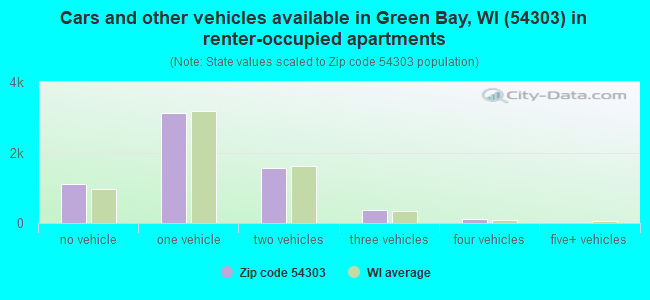
Houses and condos: 12,952 Renter-occupied apartments: 6,239
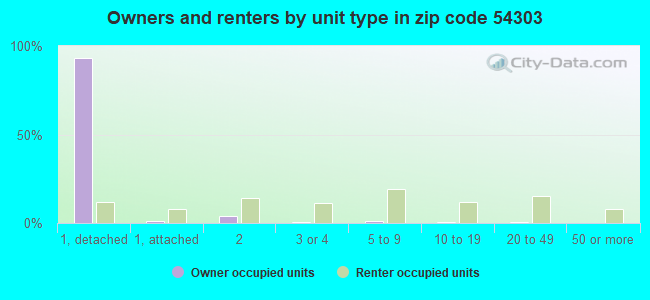
% of renters here:
50%
State:
32%
March 2022 cost of living index in zip code 54303: 91.2 (less than average, U.S. average is 100)
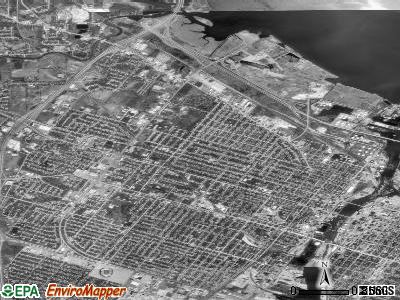
Land area: 10.9 sq. mi. Water area: 0.2 sq. mi.
Population density: 2,507 people per square mile
(average).
OSM Map
General Map
Google Map
MSN Map
OSM Map
General Map
Google Map
MSN Map
OSM Map
General Map
Google Map
MSN Map
OSM Map
General Map
Google Map
MSN Map
Please wait while loading the map...
Real estate property taxes paid for housing units in 2022:
This zip code:
1.5% ($2,351)
Wisconsin:
1.4% ($3,497)
Median real estate property taxes paid for housing units with mortgages in 2022: $2,374 (1.5%) Median real estate property taxes paid for housing units with no mortgage in 2022: $2,289 (1.4%)
Averages for the 2020 tax year for zip code 54303, filed in 2021:
Average Adjusted Gross Income (AGI) in 2020: $40,754 (Individual Income Tax Returns)
Here:
$40,754
State:
$72,319
Salary/wage: $37,637 (reported on 86.8% of returns)
Here:
$37,637
State:
$59,242
(% of AGI for various income ranges: 1231.4% for AGIs below $25k, 3793.8% for AGIs $25k-50k, 6579.4% for AGIs $50k-75k, 10011.5% for AGIs $75k-100k, 15126.8% for AGIs $100k-200k)
Taxable interest for individuals: $571 (reported on 26.0% of returns)
This zip code:
$571
Wisconsin:
$1,431
(% of AGI for various income ranges: 11.0% for AGIs below $25k, 11.7% for AGIs $25k-50k, 24.0% for AGIs $50k-75k, 50.6% for AGIs $75k-100k, 73.2% for AGIs $100k-200k)
Ordinary dividends: $3,118 (reported on 12.2% of returns)
Here:
$3,118
State:
$6,481
(% of AGI for various income ranges: 15.8% for AGIs below $25k, 19.7% for AGIs $25k-50k, 59.1% for AGIs $50k-75k, 77.9% for AGIs $75k-100k, 314.7% for AGIs $100k-200k)
Net capital gain/loss in AGI: +$4,048 (reported on 10.1% of returns)
Here:
+$4,048
State:
+$18,329
(% of AGI for various income ranges: 3.0% for AGIs below $25k, 20.1% for AGIs $25k-50k, 47.1% for AGIs $50k-75k, 165.4% for AGIs $75k-100k, 386.6% for AGIs $100k-200k)
Profit/loss from business: +$9,583 (reported on 8.2% of returns)
Here:
+$9,583
State:
+$14,562
(% of AGI for various income ranges: 74.9% for AGIs below $25k, 68.9% for AGIs $25k-50k, 98.4% for AGIs $50k-75k, 167.9% for AGIs $75k-100k, 534.5% for AGIs $100k-200k)
Taxable individual retirement arrangement distribution: $14,390 (reported on 7.7% of returns)
54303:
$14,390
Wisconsin:
$19,348
(% of AGI for various income ranges: 69.3% for AGIs below $25k, 82.2% for AGIs $25k-50k, 175.2% for AGIs $50k-75k, 409.9% for AGIs $75k-100k, 803.2% for AGIs $100k-200k)
Total itemized deductions: $24,829 (reported on 2.2% of returns)
Here:
$24,829
State:
$33,000
(% of AGI for various income ranges: 27.0% for AGIs below $25k, 26.7% for AGIs $25k-50k, 110.5% for AGIs $50k-75k, 186.8% for AGIs $75k-100k, 531.9% for AGIs $100k-200k)
Charity contributions: $5,952 (reported on 1.5% of returns)
Here:
$5,952
State:
$12,044
(% of AGI for various income ranges: 1.4% for AGIs below $25k, 4.4% for AGIs $25k-50k, 16.2% for AGIs $50k-75k, 28.1% for AGIs $75k-100k, 120.0% for AGIs $100k-200k)
Taxes paid: $6,417 (reported on 2.2% of returns)
54303:
$6,417
State:
$8,228
(% of AGI for various income ranges: 3.6% for AGIs below $25k, 5.1% for AGIs $25k-50k, 31.5% for AGIs $50k-75k, 61.0% for AGIs $75k-100k, 138.9% for AGIs $100k-200k)
Earned income credit: $2,248 (reported on 20.9% of returns)
Here:
$2,248
State:
$2,155
(% of AGI for various income ranges: 104.9% for AGIs below $25k, 60.7% for AGIs $25k-50k, 1.3% for AGIs $50k-75k)
Percentage of individuals using paid preparers for their 2020 taxes: 95.1%
Here:
95%
State:
94%
(% for various income ranges: 94.0% for AGIs below $25k, 95.8% for AGIs $25k-50k, 96.2% for AGIs $50k-75k, 94.9% for AGIs $75k-100k, 96.0% for AGIs $100k-200k, 85.7% for AGIs over 200k)
Averages for the 2012 tax year for zip code 54303, filed in 2013:
Average Adjusted Gross Income (AGI) in 2012: $33,157 (Individual Income Tax Returns)
Here:
$33,157
State:
$57,939
Salary/wage: $30,333 (reported on 87.3% of returns)
Here:
$30,333
State:
$48,248
(% of AGI for various income ranges: 79.2% for AGIs below $25k, 85.8% for AGIs $25k-50k, 81.7% for AGIs $50k-75k, 79.5% for AGIs $75k-100k, 80.0% for AGIs $100k-200k)
Taxable interest for individuals: $615 (reported on 28.8% of returns)
This zip code:
$615
Wisconsin:
$1,224
(% of AGI for various income ranges: 0.7% for AGIs below $25k, 0.3% for AGIs $25k-50k, 0.5% for AGIs $50k-75k, 0.6% for AGIs $75k-100k, 0.9% for AGIs $100k-200k)
Ordinary dividends: $2,314 (reported on 14.0% of returns)
Here:
$2,314
State:
$5,137
(% of AGI for various income ranges: 0.9% for AGIs below $25k, 0.6% for AGIs $25k-50k, 0.8% for AGIs $50k-75k, 1.3% for AGIs $75k-100k, 2.4% for AGIs $100k-200k)
Net capital gain/loss in AGI: +$2,223 (reported on 9.2% of returns)
Here:
+$2,223
State:
+$11,137
(% of AGI for various income ranges: 0.2% for AGIs $25k-50k, 0.5% for AGIs $50k-75k, 0.7% for AGIs $75k-100k, 3.5% for AGIs $100k-200k)
Profit/loss from business: +$7,541 (reported on 7.9% of returns)
Here:
+$7,541
State:
+$11,943
(% of AGI for various income ranges: 3.9% for AGIs below $25k, 1.6% for AGIs $25k-50k, 1.5% for AGIs $50k-75k, 1.1% for AGIs $75k-100k, 0.8% for AGIs $100k-200k)
Taxable individual retirement arrangement distribution: $10,948 (reported on 9.4% of returns)
54303:
$10,948
Wisconsin:
$14,087
(% of AGI for various income ranges: 3.7% for AGIs below $25k, 2.4% for AGIs $25k-50k, 2.7% for AGIs $50k-75k, 3.4% for AGIs $75k-100k, 5.5% for AGIs $100k-200k)
Total itemized deductions: $14,418 (24% of AGI, reported on 20.5% of returns)
Here:
$14,418
State:
$22,257
Here:
23.7% of AGI
State:
20.1% of AGI
(% of AGI for various income ranges: 5.0% for AGIs below $25k, 7.5% for AGIs $25k-50k, 10.2% for AGIs $50k-75k, 12.0% for AGIs $75k-100k, 13.4% for AGIs $100k-200k, 9.1% for AGIs over 200k)
Charity contributions: $2,011 (reported on 14.7% of returns)
Here:
$2,011
State:
$3,370
(% of AGI for various income ranges: 0.4% for AGIs below $25k, 0.6% for AGIs $25k-50k, 1.1% for AGIs $50k-75k, 1.2% for AGIs $75k-100k, 2.2% for AGIs $100k-200k)
Taxes paid: $5,764 (reported on 20.4% of returns)
54303:
$5,764
State:
$10,731
(% of AGI for various income ranges: 1.2% for AGIs below $25k, 2.7% for AGIs $25k-50k, 4.2% for AGIs $50k-75k, 5.3% for AGIs $75k-100k, 7.6% for AGIs $100k-200k)
Earned income credit: $2,183 (reported on 24.1% of returns)
Here:
$2,183
State:
$2,094
(% of AGI for various income ranges: 6.8% for AGIs below $25k, 1.0% for AGIs $25k-50k)
Percentage of individuals using paid preparers for their 2012 taxes: 49.0%
Here:
49%
State:
54%
(% for various income ranges: 45.7% for AGIs below $25k, 49.9% for AGIs $25k-50k, 55.4% for AGIs $50k-75k, 56.9% for AGIs $75k-100k, 58.3% for AGIs $100k-200k)
Averages for the 2004 tax year for zip code 54303, filed in 2005:
Average Adjusted Gross Income (AGI) in 2004: $30,208 (Individual Income Tax Returns)
Here:
$30,208
State:
$47,735
Salary/wage: $28,030 (reported on 88.2% of returns)
Here:
$28,030
State:
$41,540
(% of AGI for various income ranges: 90.2% for AGIs below $10k, 82.4% for AGIs $10k-25k, 86.8% for AGIs $25k-50k, 83.6% for AGIs $50k-75k, 78.3% for AGIs $75k-100k, 52.5% for AGIs over 100k)
Taxable interest for individuals: $1,033 (reported on 38.7% of returns)
This zip code:
$1,033
Wisconsin:
$1,420
(% of AGI for various income ranges: 3.6% for AGIs below $10k, 1.5% for AGIs $10k-25k, 0.9% for AGIs $25k-50k, 0.9% for AGIs $50k-75k, 1.3% for AGIs $75k-100k, 3.2% for AGIs over 100k)
Taxable dividends: $1,844 (reported on 18.6% of returns)
Here:
$1,844
State:
$2,869
(% of AGI for various income ranges: 1.9% for AGIs below $10k, 1.2% for AGIs $10k-25k, 0.7% for AGIs $25k-50k, 0.9% for AGIs $50k-75k, 1.6% for AGIs $75k-100k, 2.7% for AGIs over 100k)
Net capital gain/loss: +$4,242 (reported on 13.2% of returns)
Here:
+$4,242
State:
+$9,569
(% of AGI for various income ranges: -1.5% for AGIs below $10k, 0.2% for AGIs $10k-25k, 0.4% for AGIs $25k-50k, 1.1% for AGIs $50k-75k, 1.7% for AGIs $75k-100k, 17.2% for AGIs over 100k)
Profit/loss from business: +$7,155 (reported on 8.1% of returns)
Here:
+$7,155
State:
+$10,417
(% of AGI for various income ranges: -0.8% for AGIs below $10k, 2.5% for AGIs $10k-25k, 1.6% for AGIs $25k-50k, 1.2% for AGIs $50k-75k, 2.0% for AGIs $75k-100k, 5.4% for AGIs over 100k)
IRA payment deduction: $2,353 (reported on 2.0% of returns)
54303:
$2,353
Wisconsin:
$2,900
(% of AGI for various income ranges: 0.1% for AGIs below $10k, 0.1% for AGIs $10k-25k, 0.2% for AGIs $25k-50k, 0.2% for AGIs $50k-75k, 0.1% for AGIs $75k-100k)
Self-employed pension: $9,931 (reported on 0.2% of returns)
Here:
$9,931
Wisconsin:
$11,934
Total itemized deductions: $13,132 (25% of AGI, reported on 27.1% of returns)
Here:
$13,132
State:
$18,160
Here:
25.1% of AGI
State:
21.1% of AGI
(% of AGI for various income ranges: 8.9% for AGIs below $10k, 6.7% for AGIs $10k-25k, 11.3% for AGIs $25k-50k, 14.1% for AGIs $50k-75k, 15.8% for AGIs $75k-100k, 13.8% for AGIs over 100k)
Charity contributions deductions: $1,634 (3% of AGI, reported on 22.5% of returns)
Here:
$1,634
State:
$2,711
Here:
3.0% of AGI
State:
3.0% of AGI
(% of AGI for various income ranges: 0.5% for AGIs below $10k, 0.5% for AGIs $10k-25k, 0.9% for AGIs $25k-50k, 1.5% for AGIs $50k-75k, 1.8% for AGIs $75k-100k, 2.7% for AGIs over 100k)
Total tax: $3,227 (reported on 72.1% of returns)
54303:
$3,227
State:
$7,114
(% of AGI for various income ranges: 1.7% for AGIs below $10k, 4.3% for AGIs $10k-25k, 7.2% for AGIs $25k-50k, 8.4% for AGIs $50k-75k, 10.0% for AGIs $75k-100k, 15.5% for AGIs over 100k)
Earned income credit: $1,552 (reported on 18.2% of returns)
Here:
$1,552
State:
$1,544
Percentage of individuals using paid preparers for their 2004 taxes: 52.9%
Here:
53%
State:
57%
(% for various income ranges: 48.8% for AGIs below $10k, 52.5% for AGIs $10k-25k, 54.4% for AGIs $25k-50k, 55.2% for AGIs $50k-75k, 53.8% for AGIs $75k-100k, 64.5% for AGIs over 100k)
Likely homosexual households (counted as self-reported same-sex unmarried-partner households)
Lesbian couples: 0.6% of all households
Gay men: 0.2% of all households
Household received Food Stamps/SNAP in the past 12 months: 2,722 Household did not receive Food Stamps/SNAP in the past 12 months: 9,931
Women who had a birth in the past 12 months: 308 (238 now married, 70 unmarried) Women who did not have a birth in the past 12 months: 6,427 (2,082 now married, 4,345 unmarried)
Housing units in zip code 54303 with a mortgage: 4,348 (578 second mortgage, 49 home equity loan, 416 both second mortgage and home equity loan) Houses without a mortgage: 83
Median monthly owner costs for units with a mortgage: $1,057 Median monthly owner costs for units without a mortgage: $442
Residents with income below the poverty level in 2022:
This zip code:
18.0%
Whole state:
10.7%
Residents with income below 50% of the poverty level in 2022:
This zip code:
11.6%
Whole state:
5.7%
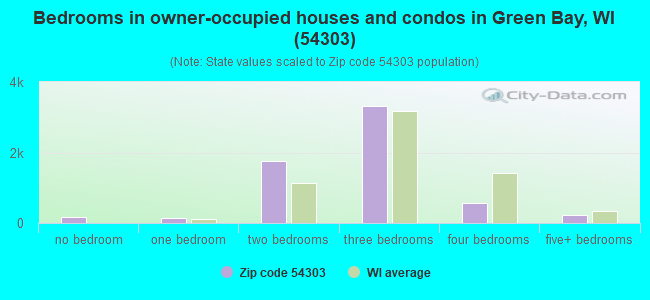
Median number of rooms in houses and condos:
Here:
5.6
State:
6.5
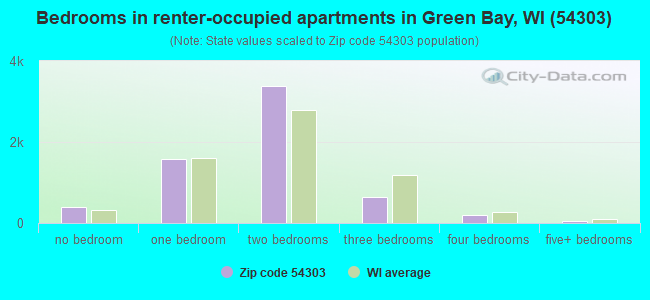
Median number of rooms in apartments:
Here:
3.9
State:
4.1
Notable locations in this zip code not listed on our city pages
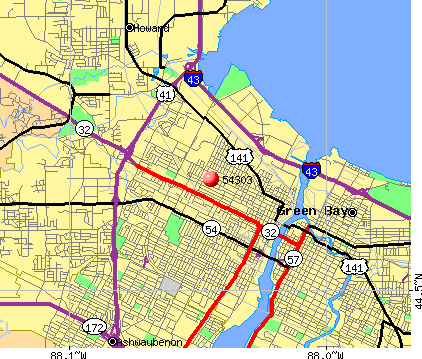
Notable locations in zip code 54303: Neville Public Museum of Brown County (A), J P Pulliam Power Plant (B), Libertas Treatment Center (C), Fort Howard Branch Kellogg Public Library (D), Green Bay Fire Department Station 3 (E). Display/hide their locations on the map
Churches in zip code 54303 include: Redeemer Lutheran Church (A), Trinity Evangelical Lutheran Church (B), The Resurrection United Evangelical Lutheran Church (C), Seventh Day Adventist Church (D), Saint Pauls United Methodist Church (E), Saint Patricks Roman Catholic Church (F), Saint Judes Roman Catholic Church (G), Redeemer Evangelical Lutheran Church (H), First Presbyterian Church (I). Display/hide their locations on the map
Parks in zip code 54303 include: Hiram Fisk Park (1), Fort Howard Park (2), Murphy Park (3), Perkins Park (4), Frank B Seymour Park (5), Mather Heights Park (6), Otto Tank Park (7), Tower Park (8), Barney Williams Park (9). Display/hide their locations on the map
2,716 married couples with children.
2,507 single-parent households (915 men, 1,592 women).
89.0% of residents of 54303 zip code speak English at home.
4.9% of residents speak Spanish at home (41% very well, 23% well, 26% not well, 9% not at all).
0.5% of residents speak other Indo-European language at home (54% very well, 13% well, 26% not well, 7% not at all).
3.9% of residents speak Asian or Pacific Island language at home (44% very well, 18% well, 36% not well, 2% not at all).
1.3% of residents speak other language at home (65% very well, 11% well, 7% not well, 17% not at all).
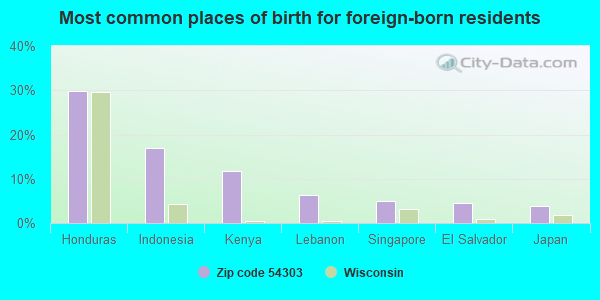
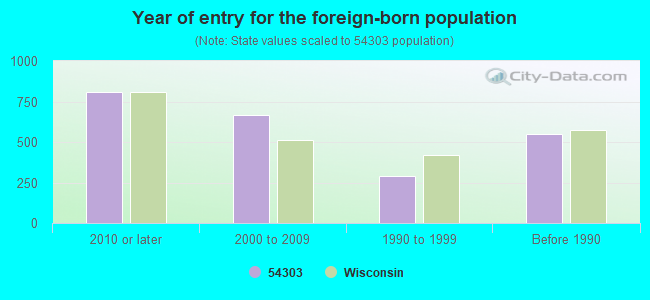
Foreign born population: 1,705 (6.2%) (34.3% of them are naturalized citizens)
Major facilities with environmental interests located in this zip code:
BROWN COUNTY HIGHWAY DEPARTMENT (2198 GLENDALE AVENUE in GREEN BAY, WI)
AIR MINOR (AIRS/AFS) (Integrated Compliance Information System) - ICIS-05-2000-0665, FORMAL ENFORCEMENT ACTION National Pollutant Discharge Elimination System NON-MAJOR (Tracking pollutant discharge elimination systems) - permit HAZARDOUS WASTE BIENNIAL REPORTER (Resource Conservation and Recovery Act (tracking hazardous waste)) Small Quantity Generators, between 100 kg and 1000 kg of hazardous waste/month (Resource Conservation and Recovery Act (tracking hazardous waste)) - notification STATE MASTER (Wisconsin database) - RCRAINFO-WID982063950, CESQG Business SIC classification: HIGHWAY AND STREET CONSTRUCTION, EXCEPT ELEVATED HIGHWAYS; ASPHALT PAVING MIXTURES AND BLOCKS; GENERAL GOVERNMENT Business NAICS classification: OTHER GENERAL GOVERNMENT SUPPORT. Organizations: BROWN CNTY HWY DEPT Alternative names: BROWN CO HIGHWAY DEPT, BROWN COUNTY HIGHWAY COMMISSIO, BROWN COUNTY HIGHWAY COMMISSION
CITGO PETROLEUM CORP (1391 BYLSBY AVE in GREEN BAY, WI)
AIR SYNTHETIC MINOR (AIRS/AFS) OIL CONTROL (Facility Response Plan for oil discharge) CRITERIA AND HAZARDOUS AIR POLLUTANT INVENTORY (Inventory of air pollution sources) HAZARDOUS WASTE BIENNIAL REPORTER (Resource Conservation and Recovery Act (tracking hazardous waste)) Large Quantity Generators, more that 1000 kg of hazardous waste/month (Resource Conservation and Recovery Act (tracking hazardous waste)) - notification STATE MASTER (Wisconsin database) - NEI-WI405033420, AIR PROGRAM, RCRAINFO-WID000713222, LQG Business SIC and NAICS classification: PETROLEUM BULK STATIONS AND TERMINALS Organizations: CITGO PETROLEUM CORPORATION (CONTACT/GENERAL)
, CITIES SERVICE COMPANY (CONTACT/OPERATOR)
Alternative names: CITGO PETROLEUM CORPORATION GREEN BAY TERMINAL
ALWIN MANUFACTURING CO. (1206 VELP AVE in GREEN BAY, WI)
AIR SYNTHETIC MINOR (AIRS/AFS) COMPLIANCE ACTIVITY (Tracking inspections of insecticide, fungicide, and rodenticide, and toxic substances) CRITERIA AND HAZARDOUS AIR POLLUTANT INVENTORY (Inventory of air pollution sources) HAZARDOUS WASTE BIENNIAL REPORTER (Resource Conservation and Recovery Act (tracking hazardous waste)) Small Quantity Generators, between 100 kg and 1000 kg of hazardous waste/month (Resource Conservation and Recovery Act (tracking hazardous waste)) TRI REPORTER (Tracking of toxic chemicals releasing facilities) STATE MASTER (Wisconsin database) - TRIS-54306LWNMF1206V, TRI REPORTER, NEI-WI405007790, AIR PROGRAM, RCRAINFO-WID006129191, SQG Business SIC classification: METAL STAMPINGS; FABRICATED METAL PRODUCTS Business NAICS classification: METAL STAMPING.; KITCHEN UTENSIL, POT, AND PAN MANUFACTURING.
ANAMAX CORPORATION (2099 SHAWANO AVENUE in HOWARD, WI)
AIR SYNTHETIC MINOR (AIRS/AFS) CRITERIA AND HAZARDOUS AIR POLLUTANT INVENTORY (Inventory of air pollution sources) Small Quantity Generators, between 100 kg and 1000 kg of hazardous waste/month (Resource Conservation and Recovery Act (tracking hazardous waste)) - notification TRI REPORTER (Tracking of toxic chemicals releasing facilities) STATE MASTER (Wisconsin database) - TRIS-54303NMXCR2099S, TRI REPORTER, NEI-WI405042880, AIR PROGRAM, RCRAINFO-WID006125520, SQG Business SIC classification: ANIMAL AND MARINE FATS AND OILS Business NAICS classification: RENDERING AND MEAT BYPRODUCT PROCESSING.; RENDERING AND MEAT BYPRODUCT PROCESSING.
CALWIS CO INC (901 HINKLE ST in GREEN BAY, WI)
COMPLIANCE ACTIVITY (Tracking inspections of insecticide, fungicide, and rodenticide, and toxic substances) CRITERIA AND HAZARDOUS AIR POLLUTANT INVENTORY (Inventory of air pollution sources) Conditionally Exempt Small Quantity Generators, less than 100 kg/month of hazardous waste (Resource Conservation and Recovery Act (tracking hazardous waste)) - notification TRI REPORTER (Tracking of toxic chemicals releasing facilities) STATE MASTER (Wisconsin database) - TRIS-54303CLWSC901HI, TRI REPORTER, RCRAINFO-WID981794050, CESQG Business SIC classification: COMMERCIAL PRINTING; SPECIALTY CLEANING, POLISHING, AND SANITATION PREPARATIONS Business NAICS classification: POLISH AND OTHER SANITATION GOOD MANUFACTURING.
BAY WEST DIV MOSINEE PAPER CORP (1100 W MASON ST in GREEN BAY, WI)
(Resource Conservation and Recovery Act (tracking hazardous waste)) STATE MASTER (Wisconsin database) - RCRAINFO-WID988575783, CESQG Alternative names: MOSINEE PAPER CORP BAY WEST DIV
BRABAZON PUMP COMPANY LIMITED (2484 CENTURY ROAD in GREEN BAY, WI)
Conditionally Exempt Small Quantity Generators, less than 100 kg/month of hazardous waste (Resource Conservation and Recovery Act (tracking hazardous waste)) STATE MASTER (Wisconsin database) - RCRAINFO-WIR000113423, SQG Organizations: BRABAZON PUMP CO LTD, CHERYL A BRABAZON (CONTACT/OWNER)
CLOUD 9 (2490 GLENDALE AVE in GREEN BAY, WI)
Conditionally Exempt Small Quantity Generators, less than 100 kg/month of hazardous waste (Resource Conservation and Recovery Act (tracking hazardous waste)) - notification STATE MASTER (Wisconsin database) - RCRAINFO-WID093422046, CESQG Organizations: WILLIQUETTE DAVID (CONTACT/OWNER)
AMOCO SERVICE STATION (612 S MILITARY in GREEN BAY, WI)
Small Quantity Generators, between 100 kg and 1000 kg of hazardous waste/month (Resource Conservation and Recovery Act (tracking hazardous waste)) - notification STATE MASTER (Wisconsin database) - RCRAINFO-WID988612800, CESQG Business SIC classification: GASOLINE SERVICE STATIONS Organizations: VALENTINES AMOCO, AMOCO OIL COMPANY (CONTACT/OWNER)
Alternative names: RCO
AMOCO STATION #10093 (130 S TAYLOR in HOWARD, WI)
Small Quantity Generators, between 100 kg and 1000 kg of hazardous waste/month (Resource Conservation and Recovery Act (tracking hazardous waste)) - notification STATE MASTER (Wisconsin database) - RCRAINFO-WID988594255, CESQG Business SIC classification: GASOLINE SERVICE STATIONS Organizations: AMOCO OIL (CONTACT/OWNER)
Alternative names: LYNNS AMOCO
BOB ZEGERS AUTO TRUCK REBLDG INC (2552 ELMHURST AVE in GREEN BAY, WI)
Conditionally Exempt Small Quantity Generators, less than 100 kg/month of hazardous waste (Resource Conservation and Recovery Act (tracking hazardous waste)) - notification STATE MASTER (Wisconsin database) - RCRAINFO-WID988579983, CESQG Business SIC classification: TOP, BODY, AND UPHOLSTERY REPAIR SHOPS AND PAINT SHOPS Organizations: ZEGERS ROBERT M (CONTACT/OWNER)
Alternative names: ZEGERS BOB AUTO TRUCK REBUILDERS INC
BUSY BEE CONVENIENCE MART (1754 MEMORIAL DR in GREEN BAY, WI)
Conditionally Exempt Small Quantity Generators, less than 100 kg/month of hazardous waste (Resource Conservation and Recovery Act (tracking hazardous waste)) - notification STATE MASTER (Wisconsin database) - RCRAINFO-WIR000036160, HAZARDOUS WASTE PROGRAM Organizations: RUTHANN KROLL (CONTACT/OWNER)
AHNAPEE & WESTERN RAILWAY CO (FORMER) (2155 HUDSON ROAD in GREEN BAY, WI) . Tribal Land
(Resource Conservation and Recovery Act (tracking hazardous waste)) TRANSPORTER (Resource Conservation and Recovery Act (tracking hazardous waste)) Organizations: GREEN BAY & WESTERN RAILROAD COMPANY (CONTACT/OWNER)
Alternative names: AHNAPEE AND WESTERN RAILWAY CO, GREEN BAY AND WESTERN RAILROAD CO
Housing units lacking complete plumbing facilities: 0.1% Housing units lacking complete kitchen facilities: 0.4%
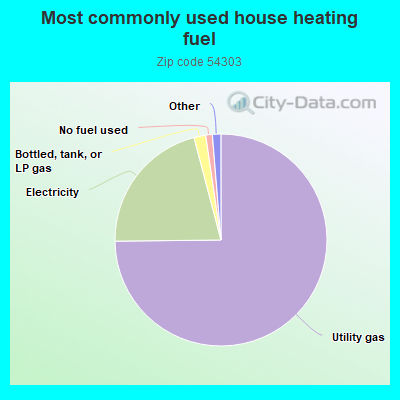
74.9%Utility gas
21.1%Electricity
1.8%Bottled, tank, or LP gas
1.0%No fuel used
0.7%Fuel oil, kerosene, etc.
0.6%Other fuel
Population in 1990: 27,046. Population change in the 1990s: +592 (+2.2%).
Place of birth for U.S.-born residents:
This state: 19,874
Northeast: 370
Midwest: 2,928
South: 1,069
West: 821
49% of the 54303 zip code residents lived in the same house 5 years ago. Out of people who lived in different houses, 67% lived in this county. Out of people who lived in different counties, 50% lived in Wisconsin.
85% of the 54303 zip code residents lived in the same house 1 year ago. Out of people who lived in different houses, 62% moved from this county. Out of people who lived in different houses, 17% moved from different county within same state. Out of people who lived in different houses, 16% moved from different state. Out of people who lived in different houses, 2% moved from abroad.
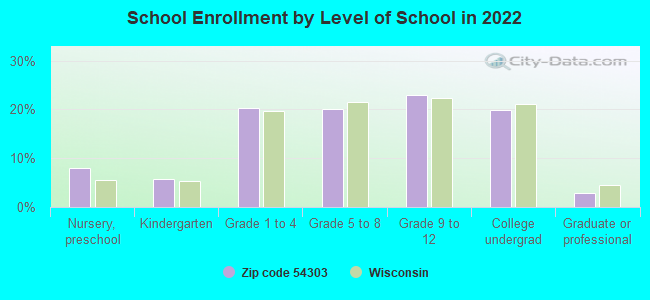
Private vs. public school enrollment:
Students in private schools in grades 1 to 8 (elementary and middle school): 255
Here:
11.3%
Wisconsin:
16.7%
Students in private schools in grades 9 to 12 (high school): 112
Here:
8.8%
Wisconsin:
12.5%
Students in private undergraduate colleges: 203
Here:
18.2%
Wisconsin:
17.5%
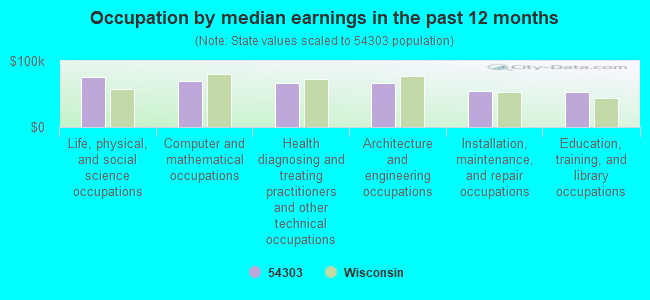
Occupation by median earnings in the past 12 months ($)
75,204Life, physical, and social science occupations
69,183Computer and mathematical occupations
67,242Health diagnosing and treating practitioners and other technical occupations
66,832Architecture and engineering occupations
54,112Installation, maintenance, and repair occupations
52,551Education, training, and library occupations
Companies with federal contracts located in this zip code (GREEN BAY, WI):
CONOPCO (909 PACKERLAND DR) : $45,478,179 in 59 contractsfrom 1999 to 2006
Contracts for Food Items For Resale by Defense Commissary Agency, Department of Defense Signed by year:2000: $3,198,702; 2001: $2,258,368; 2002: $5,450,431; 2003: $2,436,928; 2004: $10,140,083; 2005: $12,852,373; 2006: $7,629,006.
Biggest contracts:
$9,556,043 with Defense Commissary Agency for Food Items For Resale. Signed on 2005-04-01. Completion date: 2005-08-31.
$6,378,442, same as above.Signed on 2006-01-01. Completion date: 2006-03-31.
$5,509,316, same as above.Signed on 2004-10-01. Completion date: 2005-02-28.
$2,836,174, same as above.Signed on 2005-01-01. Completion date: 2005-03-31.
YALE MATERIALS HANDLING-GREEN (2140 HUTSON RD; small business) : $1,186,864 in 5 contractsin 2005
Contracts for Miscellaneous Construction Equipment by Army Signed by year:2000: $0; 2001: $0; 2002: $0; 2003: $0; 2004: $0; 2005: $1,186,864; 2006: $0.
Biggest contracts:
$407,040 with Army for Miscellaneous Construction Equipment. Signed on 2005-03-24. Completion date: 2005-06-07.
$360,011, same as above.Signed on 2005-02-03. Completion date: 2005-02-18.
$226,064, same as above.Signed on 2005-02-24. Completion date: 2005-03-28.
$212,000, same as above.Signed on 2005-04-01. Completion date: 2005-06-07.
BRABAZON PUMP CO LTD (2484 CENTURY RD; small business) : $14,372 in 2 contractsin 2004
$7,186 with Army for Compressors and Vacuum Pumps. Signed on 2004-09-30. Completion date: 2004-10-13.
$7,186 with U.S. Army Corps of Engineers - civil program financing only for Compressors and Vacuum Pumps. Signed on 2004-09-30. Completion date: 2004-10-13.
NORTHEAST WISCONSIN TECHNICAL (2740 W MASON ST) : $11,246 in 3 contractsfrom 2005 to 2006
$3,859 with Army for Training Aids. Signed on 2005-11-08. Completion date: 2005-11-12.
$3,859 with Army for Other Education and Training Services. Signed on 2006-03-22. Completion date: 2006-04-08.
$3,528 with Army for Training Aids. Signed on 2006-03-07. Completion date: 2006-04-01.
JULIE'S CAFE (1685 MAIN ST; small business)
$8,190 with Army for Food Services. Signed on 2005-06-02. Completion date: 2005-06-06.
AAAW ENTERPRISES OF GREEN BAY (1951 BOND ST; small business)
$8,040 with Army for Lodging - Hotel/Motel. Signed on 2005-06-06. Completion date: 2005-06-06.
ANAMAX CORPORATION (2099 SHAWANO AVE; small business) : $3,605 in 4 contractsfrom 2002 to 2005
$3,000 with Army for Waste Treatment and Storage. Signed on 2005-01-10. Completion date: 2005-01-21.
$220, same as above.Signed on 2002-10-01. Completion date: 2003-04-30.
$220, same as above.Signed on 2002-10-01. Completion date: 2003-04-30.
$165, same as above.Signed on 2003-05-01. Completion date: 2003-06-30.
VH OUTDOORS, LLC (808 N PACKERLAND DR; small business)
$3,045 with Army for Soil Preparation Equipment. Taking place in ND. Signed on 2005-09-07. Completion date: 2005-09-28.
TURF PRO (858 SHAWANO AVENUE; small business) : $2,616 in 2 contractsin 2003
$2,616 with Army for Landscaping/Groundskeeping Services. Signed on 2003-03-18. Completion date: 2004-03-31.
$0, same as above.Signed on 2003-03-18. Completion date: 2004-03-31.
Top industries in this zip code by the number of employees in 2005:
Health Care and Social Assistance: Offices of Physicians (except Mental Health Specialists) (250-499: 1, 100-249: 3, 50-99: 1, 20-49: 4, 10-19: 2, 1-4: 6)
Administrative and Support and Waste Management and Remediation Services: Temporary Help Services (250-499: 1, 100-249: 1, 50-99: 3, 20-49: 1, 5-9: 1, 1-4: 1)
2002 - 2018 National Fire Incident Reporting System (NFIRS) incidents
According to the data from the years 2002 - 2018 the average number of fire incidents per year is 77. The highest number of reported fire incidents - 111 took place in 2006, and the least - 51 in 2008. The data has a rising trend.
When looking into fire subcategories, the most reports belonged to: Structure Fires (52.5%), and Outside Fires (25.9%).
Fire incident types reported to NFIRS in Zip Code 54303
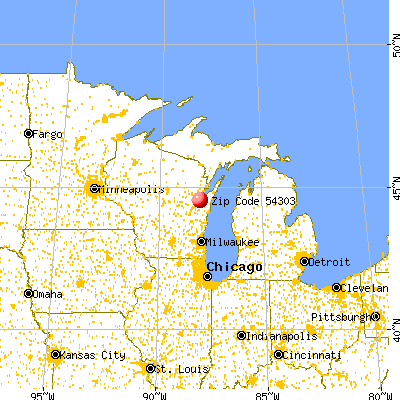


 Nearest zip codes: 54304, 54301, 54307, 54302, 54313, 54173.
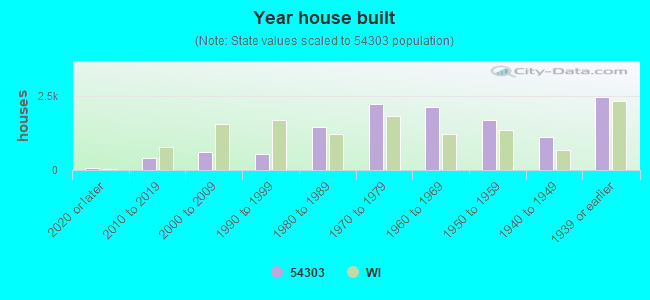


 According to the data from the years 2002 - 2018 the average number of fire incidents per year is 77. The highest number of reported fire incidents - 111 took place in 2006, and the least - 51 in 2008. The data has a rising trend.
 When looking into fire subcategories, the most reports belonged to: Structure Fires (52.5%), and Outside Fires (25.9%).