Estimated zip code population in 2022: 31,483 Zip code population in 2010: 30,611 Zip code population in 2000: 30,295
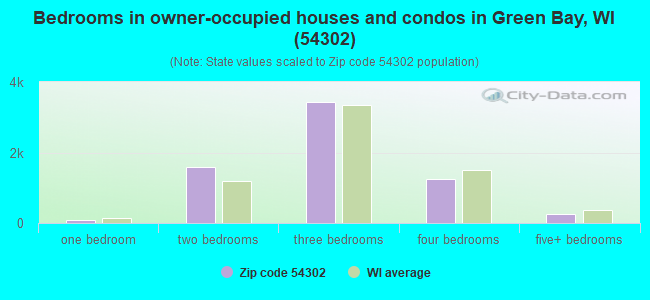
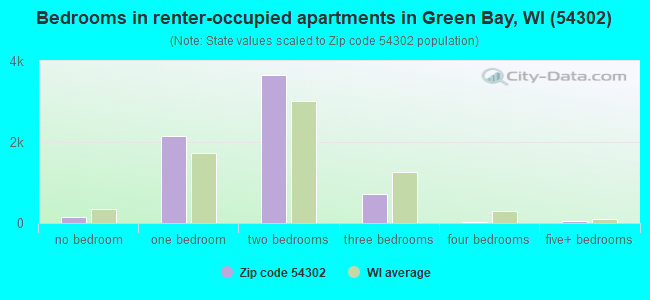
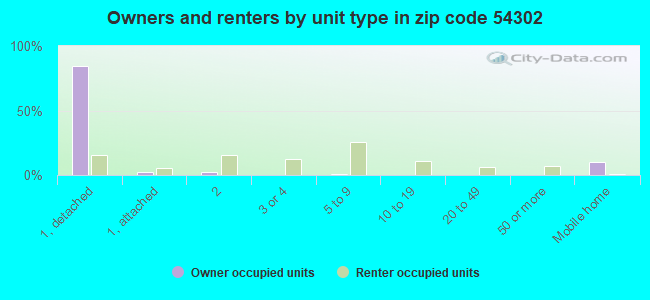
Houses and condos: 13,696 Renter-occupied apartments: 6,708
% of renters here:
50%
State:
32%
March 2022 cost of living index in zip code 54302: 91.2 (less than average, U.S. average is 100)
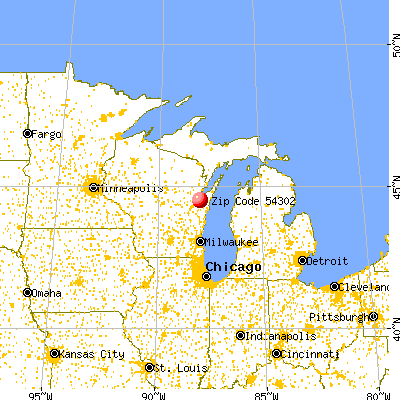
Land area: 9.6 sq. mi. Water area: 0.3 sq. mi.
Population density: 3,294 people per square mile
(average).
OSM Map
General Map
Google Map
MSN Map
OSM Map
General Map
Google Map
MSN Map
OSM Map
General Map
Google Map
MSN Map
OSM Map
General Map
Google Map
MSN Map
Please wait while loading the map...
Real estate property taxes paid for housing units in 2022:
This zip code:
1.5% ($2,487)
Wisconsin:
1.4% ($3,497)
Median real estate property taxes paid for housing units with mortgages in 2022: $2,573 (1.5%) Median real estate property taxes paid for housing units with no mortgage in 2022: $2,383 (1.6%)
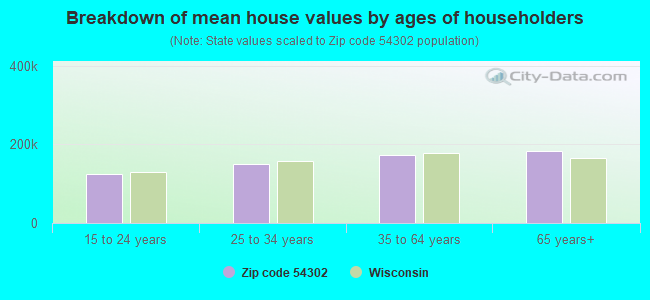
Estimated median house/condo value in 2022: $165,183
54302:
$165,183
Wisconsin:
$252,800
According to our research of Wisconsin and other state lists, there were 88 registered sex offenders living in 54302 zip code as of April 26, 2024. The ratio of all residents to sex offenders in zip code 54302 is 360 to 1. The ratio of registered sex offenders to all residents in this zip code is near the state average.
Median resident age:
This zip code:
34.2 years
Wisconsin median age:
40.4 years
Average household size:
This zip code:
2.3 people
Wisconsin:
2.3 people
Averages for the 2020 tax year for zip code 54302, filed in 2021:
Average Adjusted Gross Income (AGI) in 2020: $45,828 (Individual Income Tax Returns)
Here:
$45,828
State:
$72,319
Salary/wage: $40,116 (reported on 87.7% of returns)
Here:
$40,116
State:
$59,242
(% of AGI for various income ranges: 1298.7% for AGIs below $25k, 4043.4% for AGIs $25k-50k, 6950.2% for AGIs $50k-75k, 10521.4% for AGIs $75k-100k, 16378.2% for AGIs $100k-200k, 59581.7% for AGIs over 200k)
Taxable interest for individuals: $967 (reported on 24.1% of returns)
This zip code:
$967
Wisconsin:
$1,431
(% of AGI for various income ranges: 9.8% for AGIs below $25k, 9.9% for AGIs $25k-50k, 27.5% for AGIs $50k-75k, 68.1% for AGIs $75k-100k, 150.2% for AGIs $100k-200k, 1643.3% for AGIs over 200k)
Ordinary dividends: $5,124 (reported on 11.9% of returns)
Here:
$5,124
State:
$6,481
(% of AGI for various income ranges: 13.8% for AGIs below $25k, 20.9% for AGIs $25k-50k, 59.2% for AGIs $50k-75k, 156.2% for AGIs $75k-100k, 497.6% for AGIs $100k-200k, 5250.0% for AGIs over 200k)
Net capital gain/loss in AGI: +$11,250 (reported on 10.1% of returns)
Here:
+$11,250
State:
+$18,329
(% of AGI for various income ranges: 8.0% for AGIs below $25k, 11.7% for AGIs $25k-50k, 33.6% for AGIs $50k-75k, 170.4% for AGIs $75k-100k, 648.8% for AGIs $100k-200k, 18775.0% for AGIs over 200k)
Profit/loss from business: +$11,148 (reported on 8.2% of returns)
Here:
+$11,148
State:
+$14,562
(% of AGI for various income ranges: 62.1% for AGIs below $25k, 73.1% for AGIs $25k-50k, 111.3% for AGIs $50k-75k, 253.7% for AGIs $75k-100k, 397.6% for AGIs $100k-200k, 4076.7% for AGIs over 200k)
Taxable individual retirement arrangement distribution: $17,219 (reported on 7.6% of returns)
54302:
$17,219
Wisconsin:
$19,348
(% of AGI for various income ranges: 51.2% for AGIs below $25k, 74.9% for AGIs $25k-50k, 188.2% for AGIs $50k-75k, 442.9% for AGIs $75k-100k, 1259.8% for AGIs $100k-200k, 3126.7% for AGIs over 200k)
Total itemized deductions: $28,216 (reported on 2.4% of returns)
Here:
$28,216
State:
$33,000
(% of AGI for various income ranges: 11.9% for AGIs below $25k, 29.1% for AGIs $25k-50k, 107.7% for AGIs $50k-75k, 236.4% for AGIs $75k-100k, 518.8% for AGIs $100k-200k, 4211.7% for AGIs over 200k)
Charity contributions: $9,748 (reported on 1.8% of returns)
Here:
$9,748
State:
$12,044
(% of AGI for various income ranges: 2.9% for AGIs $25k-50k, 13.0% for AGIs $50k-75k, 32.7% for AGIs $75k-100k, 155.7% for AGIs $100k-200k, 2095.0% for AGIs over 200k)
Taxes paid: $7,461 (reported on 2.4% of returns)
54302:
$7,461
State:
$8,228
(% of AGI for various income ranges: 8.3% for AGIs $25k-50k, 31.3% for AGIs $50k-75k, 68.1% for AGIs $75k-100k, 150.4% for AGIs $100k-200k, 908.3% for AGIs over 200k)
Earned income credit: $2,333 (reported on 19.5% of returns)
Here:
$2,333
State:
$2,155
(% of AGI for various income ranges: 103.9% for AGIs below $25k, 62.0% for AGIs $25k-50k, 1.4% for AGIs $50k-75k)
Percentage of individuals using paid preparers for their 2020 taxes: 94.8%
Here:
95%
State:
94%
(% for various income ranges: 93.6% for AGIs below $25k, 95.5% for AGIs $25k-50k, 95.4% for AGIs $50k-75k, 95.6% for AGIs $75k-100k, 95.6% for AGIs $100k-200k, 94.4% for AGIs over 200k)
Averages for the 2012 tax year for zip code 54302, filed in 2013:
Average Adjusted Gross Income (AGI) in 2012: $37,438 (Individual Income Tax Returns)
Here:
$37,438
State:
$57,939
Salary/wage: $32,529 (reported on 88.2% of returns)
Here:
$32,529
State:
$48,248
(% of AGI for various income ranges: 83.2% for AGIs below $25k, 87.3% for AGIs $25k-50k, 79.4% for AGIs $50k-75k, 71.9% for AGIs $75k-100k, 68.0% for AGIs $100k-200k, 49.6% for AGIs over 200k)
Taxable interest for individuals: $927 (reported on 28.3% of returns)
This zip code:
$927
Wisconsin:
$1,224
(% of AGI for various income ranges: 0.7% for AGIs below $25k, 0.4% for AGIs $25k-50k, 0.5% for AGIs $50k-75k, 0.6% for AGIs $75k-100k, 0.7% for AGIs $100k-200k, 1.7% for AGIs over 200k)
Ordinary dividends: $4,146 (reported on 15.1% of returns)
Here:
$4,146
State:
$5,137
(% of AGI for various income ranges: 1.0% for AGIs below $25k, 0.7% for AGIs $25k-50k, 1.3% for AGIs $50k-75k, 1.7% for AGIs $75k-100k, 3.0% for AGIs $100k-200k, 4.2% for AGIs over 200k)
Net capital gain/loss in AGI: +$5,899 (reported on 10.2% of returns)
Here:
+$5,899
State:
+$11,137
(% of AGI for various income ranges: 0.2% for AGIs $25k-50k, 0.7% for AGIs $50k-75k, 0.9% for AGIs $75k-100k, 2.2% for AGIs $100k-200k, 9.4% for AGIs over 200k)
Profit/loss from business: +$9,595 (reported on 7.1% of returns)
Here:
+$9,595
State:
+$11,943
(% of AGI for various income ranges: 3.0% for AGIs below $25k, 1.3% for AGIs $25k-50k, 1.4% for AGIs $50k-75k, 1.6% for AGIs $75k-100k, 1.6% for AGIs $100k-200k, 2.6% for AGIs over 200k)
Taxable individual retirement arrangement distribution: $12,955 (reported on 9.3% of returns)
54302:
$12,955
Wisconsin:
$14,087
(% of AGI for various income ranges: 3.1% for AGIs below $25k, 2.2% for AGIs $25k-50k, 3.2% for AGIs $50k-75k, 5.4% for AGIs $75k-100k, 5.0% for AGIs $100k-200k, 1.8% for AGIs over 200k)
Self-employment retirement plans: $20,133 (reported on 0.2% of returns)
54302:
$20,133
Wisconsin:
$17,048
Total itemized deductions: $18,040 (21% of AGI, reported on 19.2% of returns)
Here:
$18,040
State:
$22,257
Here:
21.1% of AGI
State:
20.1% of AGI
(% of AGI for various income ranges: 4.7% for AGIs below $25k, 5.6% for AGIs $25k-50k, 10.0% for AGIs $50k-75k, 13.2% for AGIs $75k-100k, 15.4% for AGIs $100k-200k, 13.2% for AGIs over 200k)
Charity contributions: $2,869 (reported on 14.4% of returns)
Here:
$2,869
State:
$3,370
(% of AGI for various income ranges: 0.3% for AGIs below $25k, 0.4% for AGIs $25k-50k, 0.9% for AGIs $50k-75k, 1.5% for AGIs $75k-100k, 2.2% for AGIs $100k-200k, 2.5% for AGIs over 200k)
Taxes paid: $8,222 (reported on 19.2% of returns)
54302:
$8,222
State:
$10,731
(% of AGI for various income ranges: 1.1% for AGIs below $25k, 2.1% for AGIs $25k-50k, 4.0% for AGIs $50k-75k, 6.2% for AGIs $75k-100k, 8.2% for AGIs $100k-200k, 7.7% for AGIs over 200k)
Earned income credit: $2,244 (reported on 22.8% of returns)
Here:
$2,244
State:
$2,094
(% of AGI for various income ranges: 6.1% for AGIs below $25k, 1.3% for AGIs $25k-50k)
Percentage of individuals using paid preparers for their 2012 taxes: 53.0%
Here:
53%
State:
54%
(% for various income ranges: 47.4% for AGIs below $25k, 56.6% for AGIs $25k-50k, 59.5% for AGIs $50k-75k, 60.0% for AGIs $75k-100k, 57.1% for AGIs $100k-200k, 84.6% for AGIs over 200k)
Averages for the 2004 tax year for zip code 54302, filed in 2005:
Average Adjusted Gross Income (AGI) in 2004: $35,028 (Individual Income Tax Returns)
Here:
$35,028
State:
$47,735
Salary/wage: $31,088 (reported on 88.5% of returns)
Here:
$31,088
State:
$41,540
(% of AGI for various income ranges: 93.9% for AGIs below $10k, 85.2% for AGIs $10k-25k, 86.6% for AGIs $25k-50k, 80.9% for AGIs $50k-75k, 76.4% for AGIs $75k-100k, 62.1% for AGIs over 100k)
Taxable interest for individuals: $1,314 (reported on 38.9% of returns)
This zip code:
$1,314
Wisconsin:
$1,420
(% of AGI for various income ranges: 4.4% for AGIs below $10k, 1.4% for AGIs $10k-25k, 1.1% for AGIs $25k-50k, 1.0% for AGIs $50k-75k, 1.6% for AGIs $75k-100k, 1.8% for AGIs over 100k)
Taxable dividends: $2,866 (reported on 21.0% of returns)
Here:
$2,866
State:
$2,869
(% of AGI for various income ranges: 3.2% for AGIs below $10k, 1.0% for AGIs $10k-25k, 0.9% for AGIs $25k-50k, 1.4% for AGIs $50k-75k, 1.6% for AGIs $75k-100k, 3.2% for AGIs over 100k)
Net capital gain/loss: +$6,776 (reported on 15.7% of returns)
Here:
+$6,776
State:
+$9,569
(% of AGI for various income ranges: -1.2% for AGIs below $10k, 0.2% for AGIs $10k-25k, 0.4% for AGIs $25k-50k, 0.8% for AGIs $50k-75k, 1.9% for AGIs $75k-100k, 10.6% for AGIs over 100k)
Profit/loss from business: +$8,041 (reported on 7.6% of returns)
Here:
+$8,041
State:
+$10,417
(% of AGI for various income ranges: 1.4% for AGIs below $10k, 1.4% for AGIs $10k-25k, 1.4% for AGIs $25k-50k, 1.4% for AGIs $50k-75k, 1.5% for AGIs $75k-100k, 2.8% for AGIs over 100k)
IRA payment deduction: $2,508 (reported on 1.9% of returns)
54302:
$2,508
Wisconsin:
$2,900
(% of AGI for various income ranges: 0.2% for AGIs $10k-25k, 0.2% for AGIs $25k-50k, 0.1% for AGIs $50k-75k, 0.1% for AGIs $75k-100k, 0.1% for AGIs over 100k)
Self-employed pension: $14,562 (reported on 0.4% of returns)
Here:
$14,562
Wisconsin:
$11,934
Total itemized deductions: $15,644 (21% of AGI, reported on 25.6% of returns)
Here:
$15,644
State:
$18,160
Here:
21.2% of AGI
State:
21.1% of AGI
(% of AGI for various income ranges: 6.5% for AGIs below $10k, 4.6% for AGIs $10k-25k, 9.6% for AGIs $25k-50k, 14.6% for AGIs $50k-75k, 16.3% for AGIs $75k-100k, 14.1% for AGIs over 100k)
Charity contributions deductions: $2,252 (3% of AGI, reported on 22.2% of returns)
Here:
$2,252
State:
$2,711
Here:
2.9% of AGI
State:
3.0% of AGI
(% of AGI for various income ranges: 0.3% for AGIs below $10k, 0.4% for AGIs $10k-25k, 0.8% for AGIs $25k-50k, 1.5% for AGIs $50k-75k, 2.1% for AGIs $75k-100k, 2.5% for AGIs over 100k)
Total tax: $4,929 (reported on 68.5% of returns)
54302:
$4,929
State:
$7,114
(% of AGI for various income ranges: 1.7% for AGIs below $10k, 3.7% for AGIs $10k-25k, 6.6% for AGIs $25k-50k, 8.5% for AGIs $50k-75k, 10.1% for AGIs $75k-100k, 18.7% for AGIs over 100k)
Earned income credit: $1,650 (reported on 17.2% of returns)
Here:
$1,650
State:
$1,544
Percentage of individuals using paid preparers for their 2004 taxes: 54.0%
Here:
54%
State:
57%
(% for various income ranges: 48.2% for AGIs below $10k, 52.4% for AGIs $10k-25k, 55.3% for AGIs $25k-50k, 60.0% for AGIs $50k-75k, 56.3% for AGIs $75k-100k, 68.1% for AGIs over 100k)
Likely homosexual households (counted as self-reported same-sex unmarried-partner households)
Lesbian couples: 0.1% of all households
Gay men: 0.0% of all households
Household received Food Stamps/SNAP in the past 12 months: 2,422 Household did not receive Food Stamps/SNAP in the past 12 months: 11,048
Women who had a birth in the past 12 months: 362 (258 now married, 103 unmarried) Women who did not have a birth in the past 12 months: 6,966 (2,825 now married, 4,140 unmarried)
Housing units in zip code 54302 with a mortgage: 3,638 (315 second mortgage, 219 both second mortgage and home equity loan) Houses without a mortgage: 57
Median monthly owner costs for units with a mortgage: $1,191 Median monthly owner costs for units without a mortgage: $474
Residents with income below the poverty level in 2022:
This zip code:
21.2%
Whole state:
10.7%
Residents with income below 50% of the poverty level in 2022:
This zip code:
11.9%
Whole state:
5.7%
Median number of rooms in houses and condos:
Here:
5.8
State:
6.5
Median number of rooms in apartments:
Here:
4.0
State:
4.1
Notable locations in this zip code not listed on our city pages
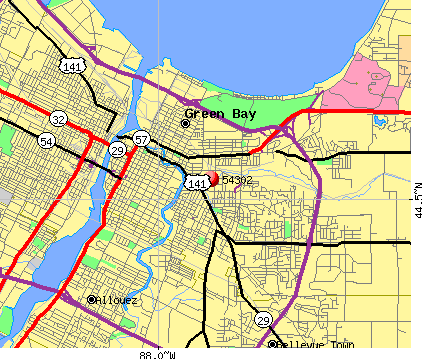
Notable locations in zip code 54302: Tower East Industrial Park (A), Green Bay Yacht Club (B), Quincy Street Wastewater Treatment Plant (C), Green Bay Fire Department Station 5 (D), North Branch Kellogg Public Library (E), Green Bay Community Center (F), Fire Station Number 5 (G), Green Bay Fire Department Station 2 (H). Display/hide their locations on the map
Churches in zip code 54302 include: Saint Philips Roman Catholic Church (A), Saint Peter and Paul Roman Catholic Church (B), Our Saviour Lutheran Church (C), Blessed Sacrament Roman Catholic Church (D). Display/hide their locations on the map
Parks in zip code 54302 include: Bay Beach Park (1), Danz Park (2), East River Park (3), Farlin Park (4), Kennedy Park (5), Preble Park (6), Bayview Park (7), Eastman Park (8), Oakdale Park (9). Display/hide their locations on the map
Tourist attractions (not listed on the city page) : Kastle Carts (Amusement & Theme Parks; 2301 North Irwin Avenue), Fort Fun Amusements (Amusement & Theme Parks; 2421 North Irwin Avenue).
4,667 married couples with children.
3,033 single-parent households (821 men, 2,212 women).
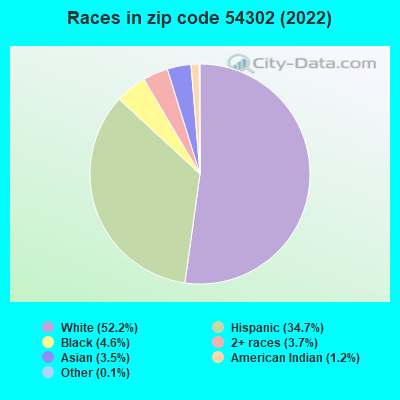
68.6% of residents of 54302 zip code speak English at home.
27.7% of residents speak Spanish at home (36% very well, 25% well, 29% not well, 9% not at all).
0.4% of residents speak other Indo-European language at home (100% very well).
3.1% of residents speak Asian or Pacific Island language at home (33% very well, 33% well, 32% not well, 2% not at all).
0.8% of residents speak other language at home (56% very well, 44% well).
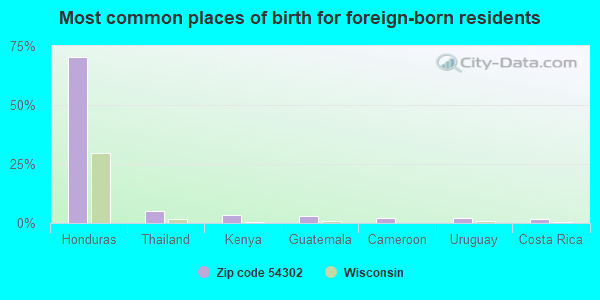
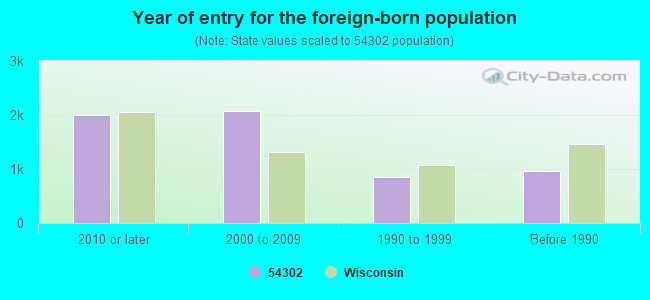
Foreign born population: 5,197 (16.5%) (24.8% of them are naturalized citizens)
Major facilities with environmental interests located in this zip code:
AMERICAN FOODS GROUP GREEN BAY (544 ACME STREET in GREEN BAY, WI)
(Integrated Compliance Information System) - ICIS-05-2006-3650, ENFORCEMENT/COMPLIANCE ACTIVITY FORMAL ENFORCEMENT ACTION (Integrated Compliance Information System) - ICIS-05-2006-3650, ENFORCEMENT/COMPLIANCE ACTIVITY CRITERIA AND HAZARDOUS AIR POLLUTANT INVENTORY (Inventory of air pollution sources) TRI REPORTER (Tracking of toxic chemicals releasing facilities) STATE MASTER (Wisconsin database) - TRIS-54308GRNBY544AC, TRI REPORTER, PCS-WI0056171, WASTEWATER FACILITY, NEI-WI405043760, AIR PROGRAM Business SIC classification: MEAT PACKING PLANTS Business NAICS classification: ANIMAL (EXCEPT POULTRY) SLAUGHTERING. Organizations: GREEN BAY DRESSED BEEF Alternative names: GREEN BAY DRESSED BEEF
CLIFF WALL MOTOR SALES INC (1988 E MASON ST in GREEN BAY, WI)
(Resource Conservation and Recovery Act (tracking hazardous waste)) STATE MASTER (Wisconsin database) - RCRAINFO-WID023254121, CESQG Business SIC classification: GENERAL AUTOMOTIVE REPAIR SHOPS
A T I COLOR INC (905 KLAUS in GREEN BAY, WI)
Conditionally Exempt Small Quantity Generators, less than 100 kg/month of hazardous waste (Resource Conservation and Recovery Act (tracking hazardous waste)) - notification STATE MASTER (Wisconsin database) - RCRAINFO-WID988627576, CESQG, HAZARDOUS WASTE PROGRAM Organizations: BURG CHARLES AND BERNADETTE (CONTACT/OWNER)
Alternative names: ATI COLOR INC
ABILITY PRINTING LLC (1841 SAL STREET in GREEN BAY, WI)
Conditionally Exempt Small Quantity Generators, less than 100 kg/month of hazardous waste (Resource Conservation and Recovery Act (tracking hazardous waste)) STATE MASTER (Wisconsin database) - RCRAINFO-WIR000114561, SQG Organizations: JPHN W OLSEN (CONTACT/OWNER)
ADVANCED AUTO (2501 UNIVERSITY AVENUE in GREEN BAY, WI)
Conditionally Exempt Small Quantity Generators, less than 100 kg/month of hazardous waste (Resource Conservation and Recovery Act (tracking hazardous waste)) STATE MASTER (Wisconsin database) - RCRAINFO-WID988597076, CESQG Business SIC classification: TOP, BODY, AND UPHOLSTERY REPAIR SHOPS AND PAINT SHOPS Organizations: BOHRTZ BRADLEY J (CONTACT/OWNER)
AMOCO SERVICE STATION #18734 (1465 UNIVERSITY AVE in GREEN BAY, WI)
Small Quantity Generators, between 100 kg and 1000 kg of hazardous waste/month (Resource Conservation and Recovery Act (tracking hazardous waste)) - notification STATE MASTER (Wisconsin database) - RCRAINFO-WID988611893, CESQG Business SIC classification: GASOLINE SERVICE STATIONS Organizations: AMOCO OIL CO (CONTACT/OWNER)
Alternative names: UNIVERSITY AMOCO
BIEBELS SUPERMARKET (1234 BELLVUE ROAD in GREEN BAY, WI)
Small Quantity Generators, between 100 kg and 1000 kg of hazardous waste/month (Resource Conservation and Recovery Act (tracking hazardous waste)) - notification STATE MASTER (Wisconsin database) - RCRAINFO-WIR000039602, HAZARDOUS WASTE PROGRAM Organizations: PAUL R BIEBEL (CONTACT/OWNER)
CITGO MINI MART (1530 MAIN ST in GREEN BAY, WI)
Small Quantity Generators, between 100 kg and 1000 kg of hazardous waste/month (Resource Conservation and Recovery Act (tracking hazardous waste)) - notification STATE MASTER (Wisconsin database) - RCRAINFO-WID988589305, CESQG Organizations: COOPERATIVE SERVICES (CONTACT/OWNER)
ASSOCIATED MILK PRODUCERS INC. (1605 MAIN ST. in GREEN BAY, WI)
TRI REPORTER (Tracking of toxic chemicals releasing facilities) STATE MASTER (Wisconsin database) - TRIS-54302MPMRN1605M, TRI REPORTER Business SIC classification: NATURAL, PROCESSED, AND IMITATION CHEESE Alternative names: AMPI MORNING GLORY FARMS
CLARK OIL CO STATION 1773 (1270 UNIVERSITY AVE in GREEN BAY, WI)
Large Quantity Generators, more that 1000 kg of hazardous waste/month (Resource Conservation and Recovery Act (tracking hazardous waste)) Organizations: MOINUDDIN QAZI (CONTACT/OPERATOR)
, CLARK REFINING AND MARKETING (CONTACT/OWNER)
, QAMARUDDIN QAZI (CONTACT/OWNER)
C AND D MOBIL (2429 UNIVERSITY AVE in GREEN BAY, WI)
(Resource Conservation and Recovery Act (tracking hazardous waste)) Organizations: C AND D MOBIL INC (CONTACT/OWNER)
C AND W TRANSPORTATION CO GREENBAY (PRAIRIE AVE AT TOWER ROAD in GREEN BAY, WI)
(Resource Conservation and Recovery Act (tracking hazardous waste))
ARNIES SERVICE (632 BELLEVUE ST in GREEN BAY, WI)
(Resource Conservation and Recovery Act (tracking hazardous waste))
Housing units lacking complete plumbing facilities: 0.1% Housing units lacking complete kitchen facilities: 0.5%
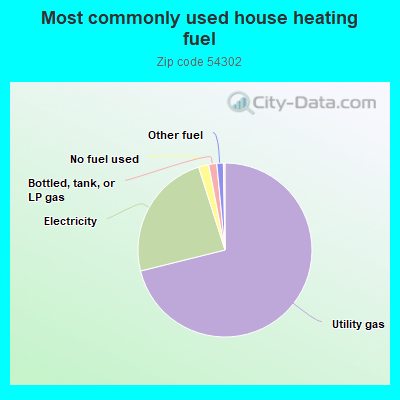
71.2%Utility gas
24.0%Electricity
1.9%No fuel used
1.5%Bottled, tank, or LP gas
1.2%Other fuel
Population in 1990: 27,273. Population change in the 1990s: +3,022 (+11.1%).
Place of birth for U.S.-born residents:
This state: 19,356
Northeast: 383
Midwest: 3,225
South: 1,011
West: 1,557
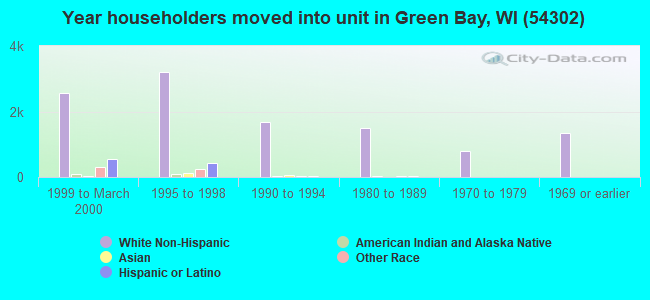
47% of the 54302 zip code residents lived in the same house 5 years ago. Out of people who lived in different houses, 63% lived in this county. Out of people who lived in different counties, 50% lived in Wisconsin.
88% of the 54302 zip code residents lived in the same house 1 year ago. Out of people who lived in different houses, 61% moved from this county. Out of people who lived in different houses, 15% moved from different county within same state. Out of people who lived in different houses, 13% moved from different state. Out of people who lived in different houses, 9% moved from abroad.
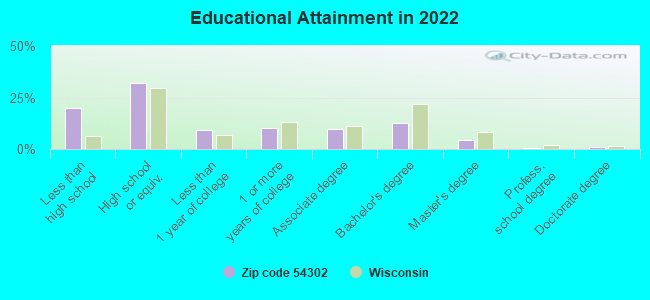
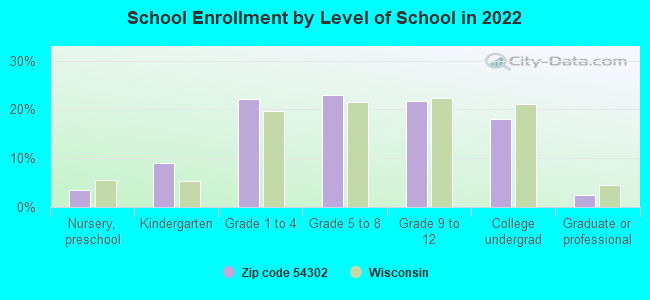
Private vs. public school enrollment:
Students in private schools in grades 1 to 8 (elementary and middle school): 417
Here:
11.9%
Wisconsin:
16.7%
Students in private schools in grades 9 to 12 (high school): 123
Here:
7.3%
Wisconsin:
12.5%
Students in private undergraduate colleges: 75
Here:
5.4%
Wisconsin:
17.5%
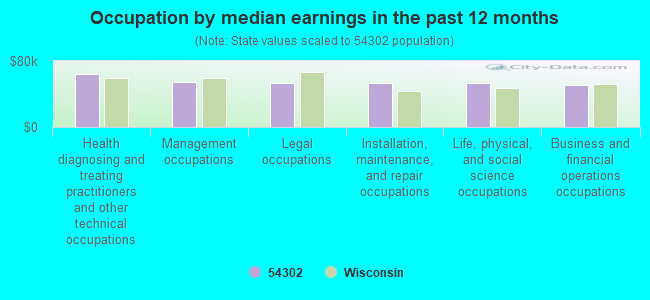
Occupation by median earnings in the past 12 months ($)
63,687Health diagnosing and treating practitioners and other technical occupations
54,853Management occupations
53,522Legal occupations
53,229Installation, maintenance, and repair occupations
53,012Life, physical, and social science occupations
50,739Business and financial operations occupations
Companies with federal contracts located in this zip code:
EN CHEM INC (1241 BELLEVUE STREET SUITE in GREEN BAY, WI; small business) : $142,122 in 9 contractsfrom 2001 to 2006
Contracts for Inspection Services (including commercial testing and lab services, except medical/dental) -- Aircraft Launching, Landing, and Ground Handling Equipment, Environmental Chambers and Related Equipment by EPA, Army Signed by year:2000: $0; 2001: $53,000; 2002: $9,222; 2003: $12,710; 2004: $13,218; 2005: $39,675; 2006: $14,297.
Biggest contracts:
$73,000 with EPA for Inspection Services (including commercial testing and lab services, except medical/dental) -- Aircraft Launching, Landing, and Ground Handling Equipment. Signed on 2002-03-15. Completion date: 2002-07-15.
$53,000, same as above.Signed on 2001-07-15. Completion date: 2002-07-15.
$39,675 with Army for Environmental Chambers and Related Equipment. Signed on 2005-03-17. Completion date: 2002-10-31.
$32,000 with EPA for Inspection Services (including commercial testing and lab services, except medical/dental) -- Aircraft Launching, Landing, and Ground Handling Equipment. Signed on 2002-02-15. Completion date: 2002-07-15.
Top industries in this zip code by the number of employees in 2005:
2002 - 2018 National Fire Incident Reporting System (NFIRS) incidents
According to the data from the years 2002 - 2018 the average number of fire incidents per year is 86. The highest number of reported fire incidents - 125 took place in 2004, and the least - 60 in 2017. The data has a rising trend.
When looking into fire subcategories, the most reports belonged to: Structure Fires (53.1%), and Outside Fires (21.4%).
Fire incident types reported to NFIRS in Zip Code 54302


 Nearest zip codes: 54301, 54307, 54303, 54311, 54304, 54173.


 According to the data from the years 2002 - 2018 the average number of fire incidents per year is 86. The highest number of reported fire incidents - 125 took place in 2004, and the least - 60 in 2017. The data has a rising trend.
 When looking into fire subcategories, the most reports belonged to: Structure Fires (53.1%), and Outside Fires (21.4%).