Estimated zip code population in 2022: 40,724 Zip code population in 2010: 35,897 Zip code population in 2000: 31,412
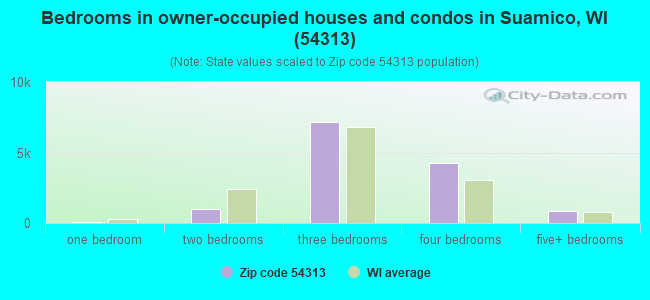
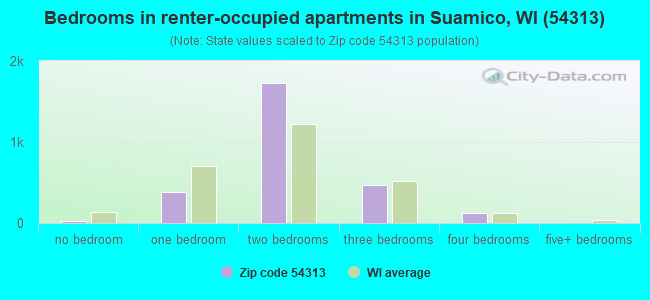
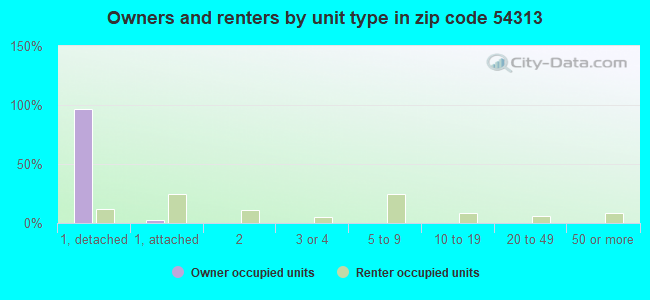
Houses and condos: 16,143 Renter-occupied apartments: 2,744
% of renters here:
17%
State:
32%
March 2022 cost of living index in zip code 54313: 91.7 (less than average, U.S. average is 100)
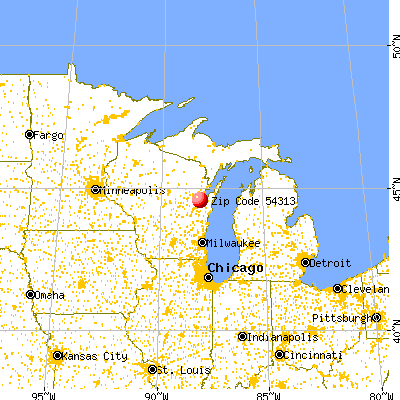
Land area: 59.6 sq. mi. Water area: 1.2 sq. mi.
Population density: 683 people per square mile
(low).
OSM Map
General Map
Google Map
MSN Map
OSM Map
General Map
Google Map
MSN Map
OSM Map
General Map
Google Map
MSN Map
OSM Map
General Map
Google Map
MSN Map
Please wait while loading the map...
Real estate property taxes paid for housing units in 2022:
This zip code:
1.3% ($3,936)
Wisconsin:
1.4% ($3,497)
Median real estate property taxes paid for housing units with mortgages in 2022: $3,972 (1.3%) Median real estate property taxes paid for housing units with no mortgage in 2022: $3,861 (1.3%)
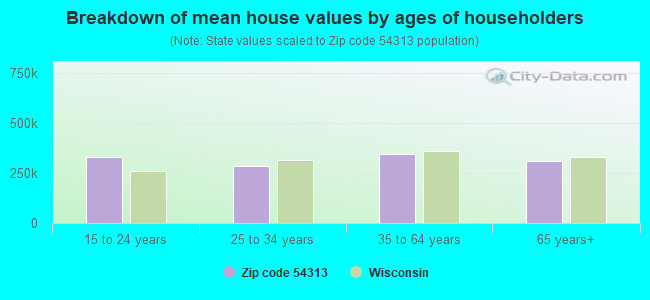
Estimated median house/condo value in 2022: $304,474
54313:
$304,474
Wisconsin:
$252,800
According to our research of Wisconsin and other state lists, there were 39 registered sex offenders living in 54313 zip code as of April 26, 2024. The ratio of all residents to sex offenders in zip code 54313 is 985 to 1. The ratio of registered sex offenders to all residents in this zip code is much lower than the state average.
Median resident age:
This zip code:
43.4 years
Wisconsin median age:
40.4 years
Average household size:
This zip code:
2.5 people
Wisconsin:
2.3 people
Averages for the 2020 tax year for zip code 54313, filed in 2021:
Average Adjusted Gross Income (AGI) in 2020: $95,931 (Individual Income Tax Returns)
Here:
$95,931
State:
$72,319
Salary/wage: $75,689 (reported on 81.9% of returns)
Here:
$75,689
State:
$59,242
(% of AGI for various income ranges: 1133.8% for AGIs below $25k, 3442.2% for AGIs $25k-50k, 6000.7% for AGIs $50k-75k, 8911.0% for AGIs $75k-100k, 17791.1% for AGIs $100k-200k, 83556.8% for AGIs over 200k)
Taxable interest for individuals: $1,510 (reported on 50.6% of returns)
This zip code:
$1,510
Wisconsin:
$1,431
(% of AGI for various income ranges: 25.2% for AGIs below $25k, 35.6% for AGIs $25k-50k, 60.1% for AGIs $50k-75k, 83.8% for AGIs $75k-100k, 127.1% for AGIs $100k-200k, 1717.5% for AGIs over 200k)
Ordinary dividends: $6,296 (reported on 31.6% of returns)
Here:
$6,296
State:
$6,481
(% of AGI for various income ranges: 46.7% for AGIs below $25k, 60.0% for AGIs $25k-50k, 126.5% for AGIs $50k-75k, 215.4% for AGIs $75k-100k, 357.1% for AGIs $100k-200k, 4829.3% for AGIs over 200k)
Net capital gain/loss in AGI: +$20,636 (reported on 27.2% of returns)
Here:
+$20,636
State:
+$18,329
(% of AGI for various income ranges: 31.0% for AGIs below $25k, 54.0% for AGIs $25k-50k, 121.7% for AGIs $50k-75k, 233.6% for AGIs $75k-100k, 549.2% for AGIs $100k-200k, 20496.6% for AGIs over 200k)
Profit/loss from business: +$18,823 (reported on 11.6% of returns)
Here:
+$18,823
State:
+$14,562
(% of AGI for various income ranges: 46.6% for AGIs below $25k, 93.9% for AGIs $25k-50k, 174.5% for AGIs $50k-75k, 249.9% for AGIs $75k-100k, 507.9% for AGIs $100k-200k, 4247.7% for AGIs over 200k)
Taxable individual retirement arrangement distribution: $25,277 (reported on 16.9% of returns)
54313:
$25,277
Wisconsin:
$19,348
(% of AGI for various income ranges: 163.6% for AGIs below $25k, 294.5% for AGIs $25k-50k, 499.9% for AGIs $50k-75k, 686.1% for AGIs $75k-100k, 1217.1% for AGIs $100k-200k, 4045.5% for AGIs over 200k)
Self-employed (Keogh) retirement plans: $22,729 (reported on 0.8% of returns)
54313:
$22,729
Wisconsin:
$21,322
(% of AGI for various income ranges: 7.3% for AGIs $25k-50k, 23.2% for AGIs $100k-200k, 688.6% for AGIs over 200k)
Total itemized deductions: $41,570 (reported on 7.6% of returns)
Here:
$41,570
State:
$33,000
(% of AGI for various income ranges: 64.5% for AGIs below $25k, 103.5% for AGIs $25k-50k, 244.1% for AGIs $50k-75k, 367.5% for AGIs $75k-100k, 540.2% for AGIs $100k-200k, 7619.3% for AGIs over 200k)
Charity contributions: $17,187 (reported on 6.2% of returns)
Here:
$17,187
State:
$12,044
(% of AGI for various income ranges: 3.5% for AGIs below $25k, 10.7% for AGIs $25k-50k, 26.9% for AGIs $50k-75k, 56.0% for AGIs $75k-100k, 125.0% for AGIs $100k-200k, 3725.5% for AGIs over 200k)
Taxes paid: $8,399 (reported on 7.6% of returns)
54313:
$8,399
State:
$8,228
(% of AGI for various income ranges: 8.7% for AGIs below $25k, 21.7% for AGIs $25k-50k, 70.5% for AGIs $50k-75k, 113.3% for AGIs $75k-100k, 165.7% for AGIs $100k-200k, 955.9% for AGIs over 200k)
Earned income credit: $1,889 (reported on 6.7% of returns)
Here:
$1,889
State:
$2,155
(% of AGI for various income ranges: 43.2% for AGIs below $25k, 37.5% for AGIs $25k-50k, 0.6% for AGIs $50k-75k)
Percentage of individuals using paid preparers for their 2020 taxes: 95.2%
Here:
95%
State:
94%
(% for various income ranges: 92.9% for AGIs below $25k, 94.6% for AGIs $25k-50k, 95.6% for AGIs $50k-75k, 96.3% for AGIs $75k-100k, 96.7% for AGIs $100k-200k, 97.2% for AGIs over 200k)
Averages for the 2012 tax year for zip code 54313, filed in 2013:
Average Adjusted Gross Income (AGI) in 2012: $77,345 (Individual Income Tax Returns)
Here:
$77,345
State:
$57,939
Salary/wage: $63,958 (reported on 86.2% of returns)
Here:
$63,958
State:
$48,248
(% of AGI for various income ranges: 74.4% for AGIs below $25k, 75.7% for AGIs $25k-50k, 75.6% for AGIs $50k-75k, 77.4% for AGIs $75k-100k, 79.8% for AGIs $100k-200k, 57.7% for AGIs over 200k)
Taxable interest for individuals: $1,316 (reported on 52.6% of returns)
This zip code:
$1,316
Wisconsin:
$1,224
(% of AGI for various income ranges: 1.3% for AGIs below $25k, 0.7% for AGIs $25k-50k, 0.7% for AGIs $50k-75k, 0.5% for AGIs $75k-100k, 0.7% for AGIs $100k-200k, 1.4% for AGIs over 200k)
Ordinary dividends: $5,045 (reported on 32.7% of returns)
Here:
$5,045
State:
$5,137
(% of AGI for various income ranges: 2.4% for AGIs below $25k, 1.4% for AGIs $25k-50k, 1.3% for AGIs $50k-75k, 1.3% for AGIs $75k-100k, 1.5% for AGIs $100k-200k, 3.6% for AGIs over 200k)
Net capital gain/loss in AGI: +$13,271 (reported on 24.6% of returns)
Here:
+$13,271
State:
+$11,137
(% of AGI for various income ranges: 0.4% for AGIs below $25k, 0.7% for AGIs $25k-50k, 0.5% for AGIs $50k-75k, 0.9% for AGIs $75k-100k, 1.5% for AGIs $100k-200k, 11.1% for AGIs over 200k)
Profit/loss from business: +$16,643 (reported on 11.6% of returns)
Here:
+$16,643
State:
+$11,943
(% of AGI for various income ranges: 3.5% for AGIs below $25k, 2.6% for AGIs $25k-50k, 2.2% for AGIs $50k-75k, 2.0% for AGIs $75k-100k, 2.9% for AGIs $100k-200k, 2.3% for AGIs over 200k)
Taxable individual retirement arrangement distribution: $17,314 (reported on 14.7% of returns)
54313:
$17,314
Wisconsin:
$14,087
(% of AGI for various income ranges: 6.9% for AGIs below $25k, 5.1% for AGIs $25k-50k, 4.7% for AGIs $50k-75k, 4.5% for AGIs $75k-100k, 3.1% for AGIs $100k-200k, 1.4% for AGIs over 200k)
Self-employment retirement plans: $19,724 (reported on 0.9% of returns)
54313:
$19,724
Wisconsin:
$17,048
(% of AGI for various income ranges: 0.2% for AGIs below $25k, 0.2% for AGIs $100k-200k, 0.5% for AGIs over 200k)
Total itemized deductions: $23,784 (18% of AGI, reported on 47.0% of returns)
Here:
$23,784
State:
$22,257
Here:
18.3% of AGI
State:
20.1% of AGI
(% of AGI for various income ranges: 10.8% for AGIs below $25k, 12.6% for AGIs $25k-50k, 14.7% for AGIs $50k-75k, 15.9% for AGIs $75k-100k, 16.5% for AGIs $100k-200k, 12.9% for AGIs over 200k)
Charity contributions: $3,149 (reported on 40.2% of returns)
Here:
$3,149
State:
$3,370
(% of AGI for various income ranges: 0.6% for AGIs below $25k, 0.9% for AGIs $25k-50k, 1.2% for AGIs $50k-75k, 1.5% for AGIs $75k-100k, 1.9% for AGIs $100k-200k, 2.1% for AGIs over 200k)
Taxes paid: $12,154 (reported on 46.9% of returns)
54313:
$12,154
State:
$10,731
(% of AGI for various income ranges: 2.6% for AGIs below $25k, 4.6% for AGIs $25k-50k, 6.1% for AGIs $50k-75k, 7.6% for AGIs $75k-100k, 8.8% for AGIs $100k-200k, 7.9% for AGIs over 200k)
Earned income credit: $1,917 (reported on 8.1% of returns)
Here:
$1,917
State:
$2,094
(% of AGI for various income ranges: 3.2% for AGIs below $25k, 0.7% for AGIs $25k-50k)
Percentage of individuals using paid preparers for their 2012 taxes: 54.3%
Here:
54%
State:
54%
(% for various income ranges: 44.1% for AGIs below $25k, 55.3% for AGIs $25k-50k, 58.9% for AGIs $50k-75k, 59.3% for AGIs $75k-100k, 57.9% for AGIs $100k-200k, 77.3% for AGIs over 200k)
Averages for the 2004 tax year for zip code 54313, filed in 2005:
Average Adjusted Gross Income (AGI) in 2004: $67,553 (Individual Income Tax Returns)
Here:
$67,553
State:
$47,735
Salary/wage: $57,503 (reported on 90.1% of returns)
Here:
$57,503
State:
$41,540
(% of AGI for various income ranges: 168.8% for AGIs below $10k, 79.3% for AGIs $10k-25k, 81.3% for AGIs $25k-50k, 82.6% for AGIs $50k-75k, 85.5% for AGIs $75k-100k, 69.2% for AGIs over 100k)
Taxable interest for individuals: $1,469 (reported on 62.3% of returns)
This zip code:
$1,469
Wisconsin:
$1,420
(% of AGI for various income ranges: 9.3% for AGIs below $10k, 2.4% for AGIs $10k-25k, 1.2% for AGIs $25k-50k, 0.8% for AGIs $50k-75k, 0.9% for AGIs $75k-100k, 1.5% for AGIs over 100k)
Taxable dividends: $2,244 (reported on 38.8% of returns)
Here:
$2,244
State:
$2,869
(% of AGI for various income ranges: 8.4% for AGIs below $10k, 1.6% for AGIs $10k-25k, 1.1% for AGIs $25k-50k, 0.9% for AGIs $50k-75k, 1.0% for AGIs $75k-100k, 1.4% for AGIs over 100k)
Net capital gain/loss: +$13,063 (reported on 31.3% of returns)
Here:
+$13,063
State:
+$9,569
(% of AGI for various income ranges: 7.2% for AGIs below $10k, 0.9% for AGIs $10k-25k, 0.6% for AGIs $25k-50k, 0.8% for AGIs $50k-75k, 1.2% for AGIs $75k-100k, 10.9% for AGIs over 100k)
Profit/loss from business: +$15,007 (reported on 12.4% of returns)
Here:
+$15,007
State:
+$10,417
(% of AGI for various income ranges: 1.8% for AGIs below $10k, 3.2% for AGIs $10k-25k, 3.1% for AGIs $25k-50k, 2.5% for AGIs $50k-75k, 2.4% for AGIs $75k-100k, 2.8% for AGIs over 100k)
IRA payment deduction: $3,078 (reported on 2.8% of returns)
54313:
$3,078
Wisconsin:
$2,900
(% of AGI for various income ranges: 0.2% for AGIs $10k-25k, 0.3% for AGIs $25k-50k, 0.2% for AGIs $50k-75k, 0.1% for AGIs $75k-100k, 0.1% for AGIs over 100k)
Self-employed pension: $13,824 (reported on 1.2% of returns)
Here:
$13,824
Wisconsin:
$11,934
(% of AGI for various income ranges: 0.1% for AGIs $25k-50k, 0.1% for AGIs $50k-75k, 0.1% for AGIs $75k-100k, 0.4% for AGIs over 100k)
Total itemized deductions: $20,323 (19% of AGI, reported on 52.4% of returns)
Here:
$20,323
State:
$18,160
Here:
19.1% of AGI
State:
21.1% of AGI
(% of AGI for various income ranges: 19.0% for AGIs below $10k, 11.9% for AGIs $10k-25k, 16.2% for AGIs $25k-50k, 18.6% for AGIs $50k-75k, 19.0% for AGIs $75k-100k, 13.9% for AGIs over 100k)
Charity contributions deductions: $2,733 (2% of AGI, reported on 48.7% of returns)
Here:
$2,733
State:
$2,711
Here:
2.5% of AGI
State:
3.0% of AGI
(% of AGI for various income ranges: 0.8% for AGIs below $10k, 1.0% for AGIs $10k-25k, 1.3% for AGIs $25k-50k, 1.7% for AGIs $50k-75k, 1.9% for AGIs $75k-100k, 2.3% for AGIs over 100k)
Total tax: $11,353 (reported on 82.5% of returns)
54313:
$11,353
State:
$7,114
(% of AGI for various income ranges: 3.4% for AGIs below $10k, 4.6% for AGIs $10k-25k, 7.0% for AGIs $25k-50k, 8.0% for AGIs $50k-75k, 9.2% for AGIs $75k-100k, 19.7% for AGIs over 100k)
Earned income credit: $1,367 (reported on 5.9% of returns)
Here:
$1,367
State:
$1,544
Percentage of individuals using paid preparers for their 2004 taxes: 53.8%
Here:
54%
State:
57%
(% for various income ranges: 37.9% for AGIs below $10k, 50.7% for AGIs $10k-25k, 56.8% for AGIs $25k-50k, 60.2% for AGIs $50k-75k, 55.5% for AGIs $75k-100k, 63.8% for AGIs over 100k)
Household received Food Stamps/SNAP in the past 12 months: 522 Household did not receive Food Stamps/SNAP in the past 12 months: 15,371
Women who had a birth in the past 12 months: 307 (262 now married, 46 unmarried) Women who did not have a birth in the past 12 months: 8,585 (4,314 now married, 4,270 unmarried)
Housing units in zip code 54313 with a mortgage: 8,576 (1,088 second mortgage, 1,000 both second mortgage and home equity loan) Houses without a mortgage: 225
Median monthly owner costs for units with a mortgage: $1,673 Median monthly owner costs for units without a mortgage: $642
Residents with income below the poverty level in 2022:
This zip code:
3.3%
Whole state:
10.7%
Residents with income below 50% of the poverty level in 2022:
This zip code:
2.0%
Whole state:
5.7%
Median number of rooms in houses and condos:
Here:
7.0
State:
6.5
Median number of rooms in apartments:
Here:
4.1
State:
4.1
Notable locations in this zip code not listed on our city pages
Notable locations in zip code 54313: Oneida Golf Course (A), Howard Volunteer Fire Department (B), Austin Straubel International Airport Fire Department (C), Suamico Volunteer Fire Department Station 1 (D), Suamico Volunteer Fire Department Station 2 (E), Red Leaf Nursery (F). Display/hide their locations on the map
Churches in zip code 54313 include: Peace Church (A), Saints Edward and Isidore Church (B), Good Shepherd Church (C), Saint John the Baptist Church (D). Display/hide their locations on the map
Cemeteries: Ashwaubenon Cemetery (1), Saint Benedict Cemetery (2), Mill Center Cemetery (3), Saint Johns Cemetery (4), Kunesh Cemetery (5). Display/hide their locations on the map
Parks in zip code 54313 include: EJ Smith County Park (1), Pamperin Park (2), Saint Pats Park (3), He-Nis-Ra Park (4), Smith Park (5). Display/hide their locations on the map
7,511 married couples with children.
1,509 single-parent households (455 men, 1,054 women).
96.6% of residents of 54313 zip code speak English at home.
1.1% of residents speak Spanish at home (84% very well, 12% well, 3% not well, 1% not at all).
1.3% of residents speak other Indo-European language at home (76% very well, 10% well, 15% not well).
0.7% of residents speak Asian or Pacific Island language at home (34% very well, 43% well, 22% not well).
0.1% of residents speak other language at home (100% very well).
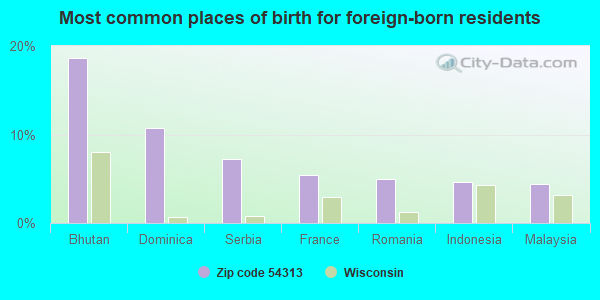
Foreign born population: 1,010 (2.5%) (70.7% of them are naturalized citizens)
This zip code:
2.5%
Whole state:
5.0%
19%Bhutan
11%Dominica
7%Serbia
5%France
5%Romania
5%Indonesia
4%Malaysia
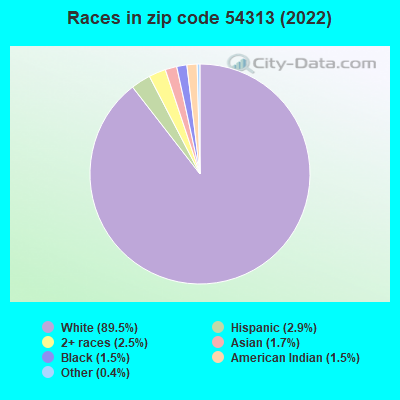
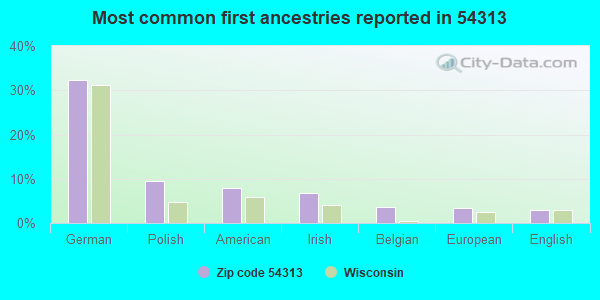
32%German
9%Polish
8%American
7%Irish
4%Belgian
3%European
3%English
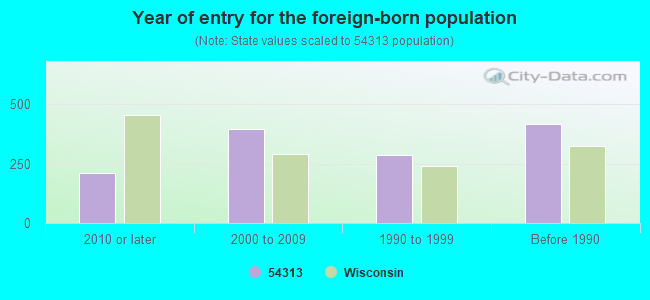
Year of entry for the foreign-born population
2112010 or later
3952000 to 2009
2861990 to 1999
415Before 1990
Facilities with environmental interests located in this zip code:
CATENATION BLDG (1680 CORNELL RD in GREEN BAY, WI)
Large Quantity Generators, more that 1000 kg of hazardous waste/month (Resource Conservation and Recovery Act (tracking hazardous waste)) - notification STATE MASTER (Wisconsin database) - RCRAINFO-WIR000110452, LQG Organizations: CATENATION BUILDING, VHC INC (CONTACT/OWNER)
CARL KLEMM INC DBA JAVCO INC (2204 PAMPERIN RD in GREEN BAY, WI)
(Resource Conservation and Recovery Act (tracking hazardous waste)) STATE MASTER (Wisconsin database) - RCRAINFO-WID988617593, TRANSPORTER Business SIC classification: NONCLASSIFIABLE ESTABLISHMENTS
CNC INC (1520 CORNELL RD in GREEN BAY, WI)
Conditionally Exempt Small Quantity Generators, less than 100 kg/month of hazardous waste (Resource Conservation and Recovery Act (tracking hazardous waste)) STATE MASTER (Wisconsin database) - RCRAINFO-WIR000100784, CESQG
BAY PORT HI (2710 LINEVILLE RD in GREEN BAY, WI)
(National Center for Education Statistics) - STATE ID-0020 Organizations: HOWARD-SUAMICO SCH DIST (SCHOOL DISTRICT)
BAY VIEW MID (1217 CARDINAL LN in GREEN BAY, WI)
(National Center for Education Statistics) - STATE ID-0030 Organizations: HOWARD-SUAMICO SCH DIST (SCHOOL DISTRICT)
BROWN COUNTY REFORESTATION CAMP (4418 REFORESTATION RD in GREEN BAY, WI)
Small Quantity Generators, between 100 kg and 1000 kg of hazardous waste/month (Resource Conservation and Recovery Act (tracking hazardous waste)) - notification
A. STRAUBEL INTERNATIONAL AIRPORT (2077 AIRPORT DRIVE in GREEN BAY, WI)
COMPLIANCE ACTIVITY (Tracking inspections of insecticide, fungicide, and rodenticide, and toxic substances)
Housing units lacking complete plumbing facilities: 0.2% Housing units lacking complete kitchen facilities: 0.3%
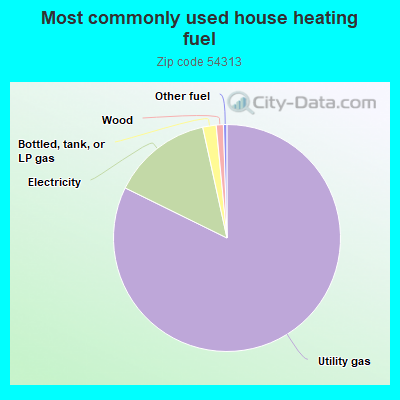
81.7%Utility gas
14.2%Electricity
1.9%Bottled, tank, or LP gas
1.0%Wood
0.5%Other fuel
Population in 1990: 23,360. Population change in the 1990s: +8,052 (+34.5%).
Place of birth for U.S.-born residents:
This state: 31,172
Northeast: 752
Midwest: 4,704
South: 1,693
West: 993
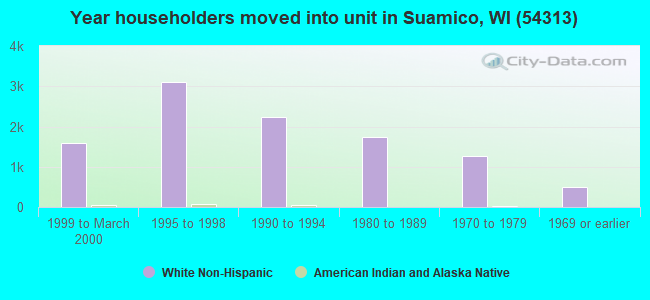
59% of the 54313 zip code residents lived in the same house 5 years ago. Out of people who lived in different houses, 67% lived in this county. Out of people who lived in different counties, 50% lived in Wisconsin.
91% of the 54313 zip code residents lived in the same house 1 year ago. Out of people who lived in different houses, 72% moved from this county. Out of people who lived in different houses, 15% moved from different county within same state. Out of people who lived in different houses, 9% moved from different state. Out of people who lived in different houses, 1% moved from abroad.
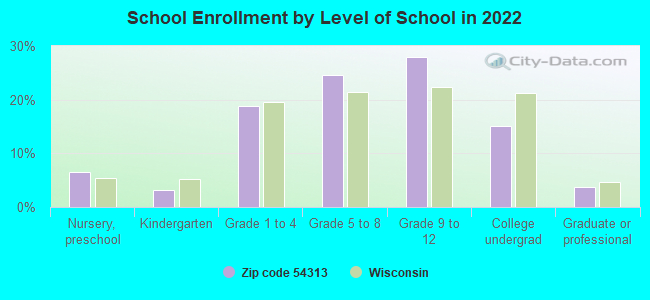
Private vs. public school enrollment:
Students in private schools in grades 1 to 8 (elementary and middle school): 448
Here:
10.5%
Wisconsin:
16.7%
Students in private schools in grades 9 to 12 (high school): 153
Here:
5.6%
Wisconsin:
12.5%
Students in private undergraduate colleges: 207
Here:
14.0%
Wisconsin:
17.5%
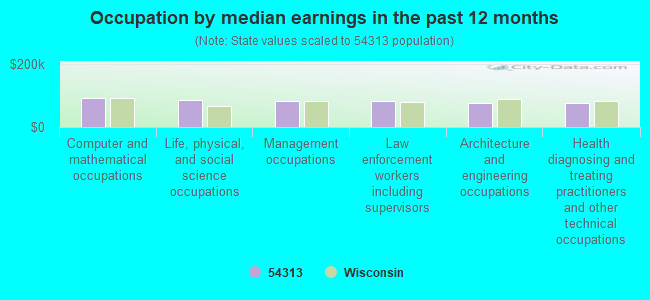
Occupation by median earnings in the past 12 months ($)
90,613Computer and mathematical occupations
85,081Life, physical, and social science occupations
83,016Management occupations
82,941Law enforcement workers including supervisors
77,629Architecture and engineering occupations
75,191Health diagnosing and treating practitioners and other technical occupations
Companies with federal contracts located in this zip code (GREEN BAY, WI):
THE SELMER COMPANY INC (2200 WOODALE AVE)
$7,492,783 with Army for Construction of Structures and Facilities -- Miscellaneous Buildings. Signed on 2006-03-30. Completion date: 2007-09-28.
LAMERS BUS LINES INC (2407 S POINT RD; small business) : $2,320,861 in 16 contractsfrom 2002 to 2005
Contracts for Lease or Rental of Equipment -- Ground Effect Vehicles, Motor Vehicles, Trailers, and Cycles, Passenger Air Charter Service, Passenger Motor Charter Service, Passenger Motor Vehicles by Army Signed by year:2000: $0; 2001: $0; 2002: $3,225; 2003: $2,422,669; 2004: -$141,933; 2005: $36,900; 2006: $0.
Biggest contracts:
$847,500 with Army for Lease or Rental of Equipment -- Ground Effect Vehicles, Motor Vehicles, Trailers, and Cycles. Signed on 2003-12-09. Completion date: 2004-09-19.
$610,200, same as above.Signed on 2003-10-01. Completion date: 2004-09-30.
$554,366, same as above.Signed on 2003-08-15. Completion date: 2003-09-30.
$423,750, same as above.Signed on 2003-01-31. Completion date: 2003-05-03.
EXECUTIVE AIR LLC (2131 AIRPORT DR; small business) : $408,401 in 2 contractsfrom 2001 to 2004
$226,090 with Defense Logistics Agency for Liquid Propellants and Fuels, Petroleum Base. Signed on 2004-09-22. Completion date: 2008-09-30.
$182,311, same as above.Signed on 2001-10-01. Completion date: 2004-09-30.
AUDIO VISUAL SYSTEMS DESIGN (1235 S KIMPS COURT; small business) : $86,367 in 2 contractsfrom 2002 to 2003
$80,000 with Army for Communication Training Devices. Signed on 2003-09-22. Completion date: 2003-10-15.
$6,367 with Department of Defense for Headsets, Handsets, Microphones and Speakers. Signed on 2002-09-05. Completion date: 2002-09-17.
SUNNYBROOK LANDSCAPE SERVICE L (2555 SUNNY BROOK DR; small business) : $35,080 in 13 contractsfrom 2001 to 2005
Contracts for Landscaping/Groundskeeping Services, Other Housekeeping Services by Navy Signed by year:2000: $0; 2001: $2,900; 2002: $11,355; 2003: $6,845; 2004: $7,695; 2005: $6,285; 2006: $0.
Biggest contracts:
$9,345 with Navy for Landscaping/Groundskeeping Services. Signed on 2004-10-30. Completion date: 2003-11-08.
$8,585, same as above.Signed on 2003-10-01. Completion date: 2003-11-08.
$8,485 with Navy for Other Housekeeping Services. Signed on 2002-11-04. Completion date: 2003-10-31.
$6,285 with Navy for Landscaping/Groundskeeping Services. Signed on 2005-11-30. Completion date: 2006-10-31.
BF INDUSTRIES LLC (2465 LINEVILLE RD SUITE 4; small business) : $0 in 2 contractsin 2005
$3,188 with Army for Laundry and DryCleaning Services. Signed on 2005-04-26. Completion date: 2005-05-13.
-$3,188, same as above.Signed on 2005-12-14. Completion date: 2005-05-13.
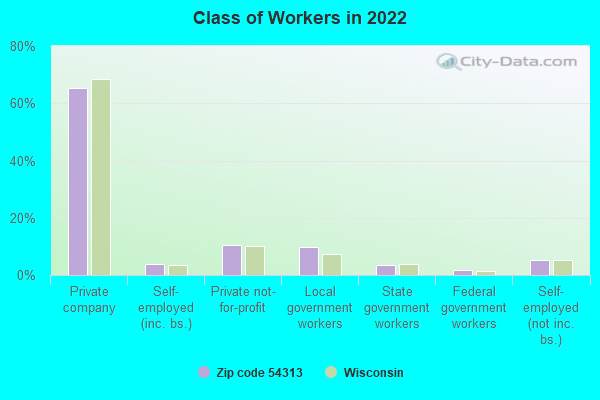
Top industries in this zip code by the number of employees in 2005:
Finance and Insurance: Direct Life Insurance Carriers (over 1000 employees: 1 establishment, 1-4 employees: 1 establishment)
Professional, Scientific, and Technical Services: Process, Physical Distribution, and Logistics Consulting Services (500-999: 1)
2002 - 2018 National Fire Incident Reporting System (NFIRS) incidents
Based on the data from the years 2002 - 2018 the average number of fire incidents per year is 61. The highest number of reported fire incidents - 81 took place in 2018, and the least - 20 in 2003. The data has a rising trend.
When looking into fire subcategories, the most incidents belonged to: Structure Fires (49.4%), and Outside Fires (25.6%).
Fire incident types reported to NFIRS in Zip Code 54313


 Nearest zip codes: 54303, 54173, 54304, 54155, 54171, 54307.


 Based on the data from the years 2002 - 2018 the average number of fire incidents per year is 61. The highest number of reported fire incidents - 81 took place in 2018, and the least - 20 in 2003. The data has a rising trend.
 When looking into fire subcategories, the most incidents belonged to: Structure Fires (49.4%), and Outside Fires (25.6%).