Crime rate in High Point, North Carolina (NC): murders, rapes, robberies, assaults, burglaries, thefts, auto thefts, arson, law enforcement employees, police officers, crime map
Crime rate in High Point, NC
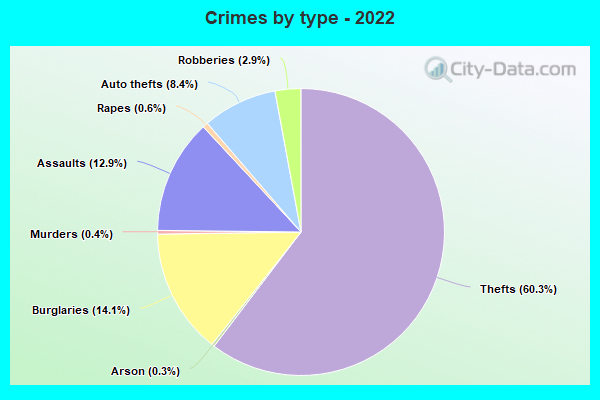
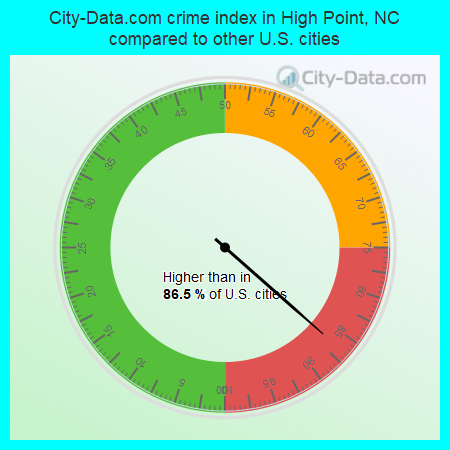
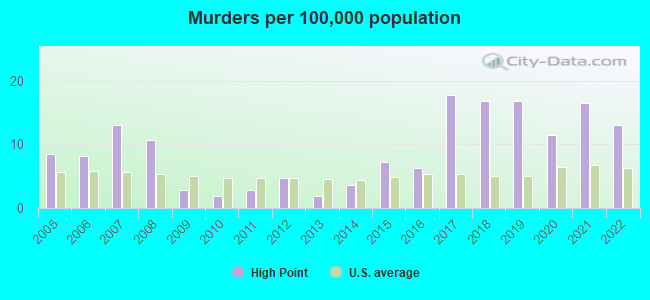
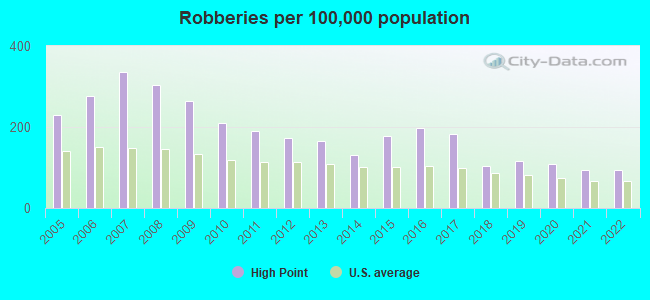
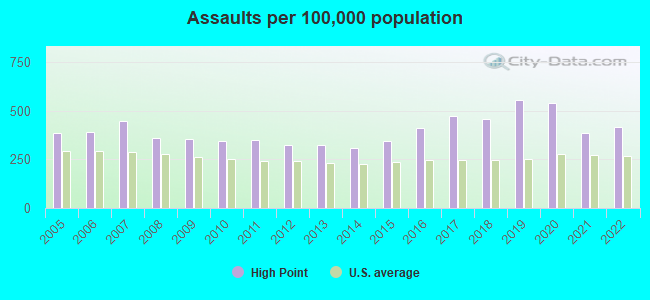
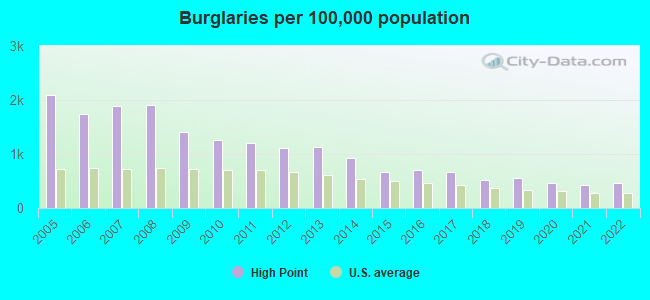
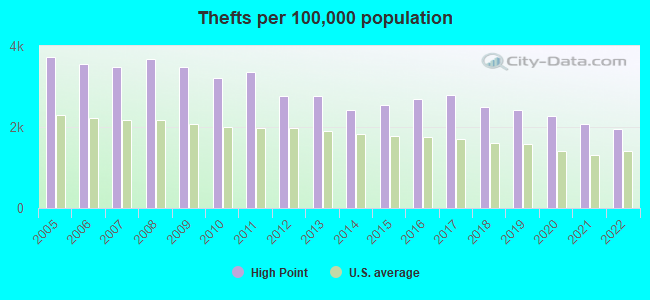
The 2022 crime rate in High Point, NC is 288 (City-Data.com crime index), which is about the average for the U.S. cities. It was higher than in 86.5% U.S. cities. The 2022 High Point crime rate fell by 4% compared to 2021. The number of homicides stood at 15 - a decrease of 4 compared to 2021. In the last 5 years High Point has seen decreasing violent crime and decline of property crime.See how dangerous High Point, NC is compared to the nearest cities:
(Note: Higher means more crime)
(Note: Higher means more crime)
| High Point: | 287.6 |
| Archdale: | 126.2 |
| Thomasville: | 145.7 |
| Kernersville: | 236.3 |
| Greensboro: | 404.0 |
| Randleman: | 181.8 |
| Winston-Salem: | 480.4 |
| Lexington: | 302.5 |
| Asheboro: | 320.7 |
The City-Data.com crime index weighs serious crimes and violent crimes more heavily. Higher means more crime, U.S. average is 246.1. It adjusts for the number of visitors and daily workers commuting into cities.
- means the value is smaller than the state average.- means the value is about the same as the state average.
- means the value is bigger than the state average.
- means the value is much bigger than the state average.
According to our research of North Carolina and other state lists, there were 268 registered sex offenders living in High Point, North Carolina as of April 26, 2024.
The ratio of all residents to sex offenders in High Point is 414 to 1.
The ratio of registered sex offenders to all residents in this city is near the state average.
Violent crime rate in 2022
| High Point: | 304.1 |
| U.S. Average: | 219.8 |
Violent crime rate in 2021
| High Point: | 304.0 |
| U.S. Average: | 224.8 |
Violent crime rate in 2020
| High Point: | 377.2 |
| U.S. Average: | 228.2 |
Violent crime rate in 2019
| High Point: | 412.2 |
| U.S. Average: | 219.9 |
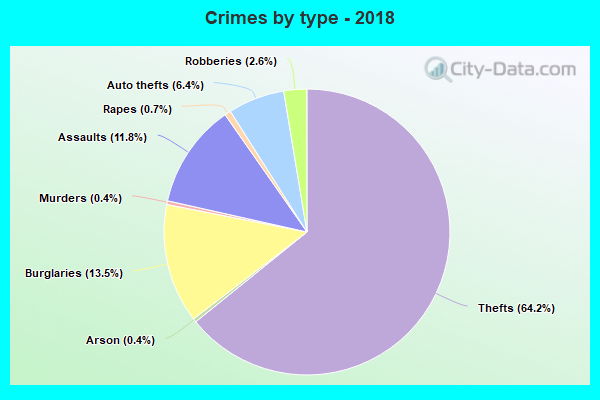
Violent crime rate in 2018
| High Point: | 343.5 |
| U.S. Average: | 221.2 |
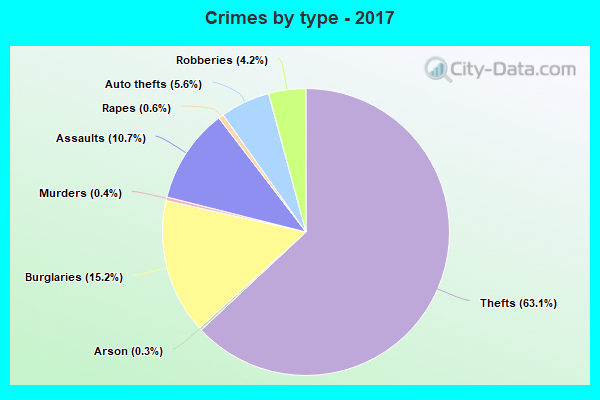
Violent crime rate in 2017
| High Point: | 388.0 |
| U.S. Average: | 226.2 |
Violent crime rate in 2016
| High Point: | 349.1 |
| U.S. Average: | 227.3 |
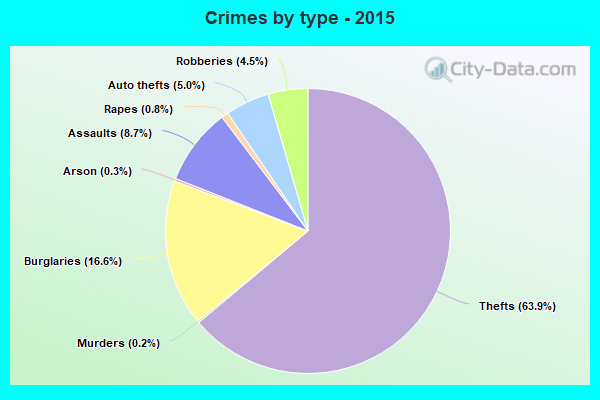
Violent crime rate in 2015
| High Point: | 310.5 |
| U.S. Average: | 219.3 |
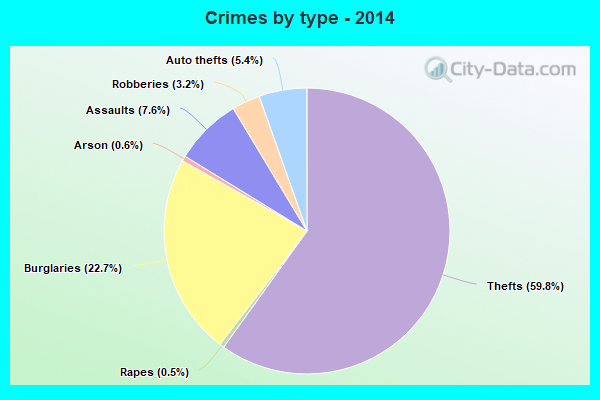
Violent crime rate in 2014
| High Point: | 248.8 |
| U.S. Average: | 211.1 |
Violent crime rate in 2013
| High Point: | 276.0 |
| U.S. Average: | 214.2 |
Violent crime rate in 2012
| High Point: | 276.2 |
| U.S. Average: | 187.4 |
Violent crime rate in 2011
| High Point: | 299.9 |
| U.S. Average: | 187.1 |
Violent crime rate in 2010
| High Point: | 307.6 |
| U.S. Average: | 195.7 |
Violent crime rate in 2009
| High Point: | 347.2 |
| U.S. Average: | 208.9 |
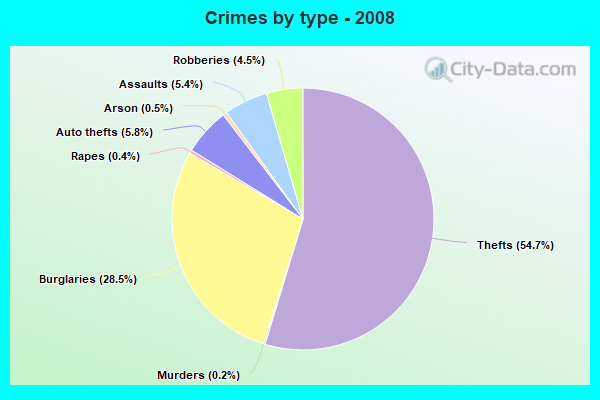
Violent crime rate in 2008
| High Point: | 381.7 |
| U.S. Average: | 222.5 |
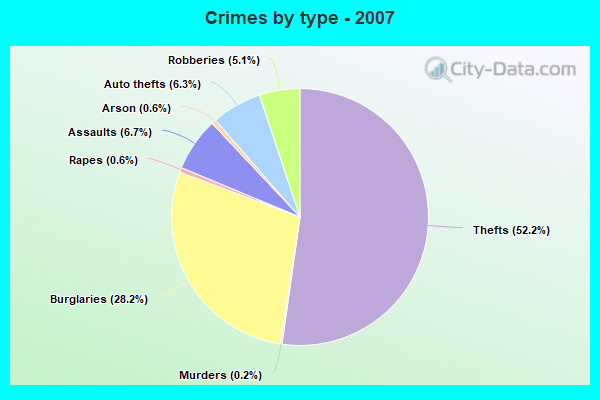
Violent crime rate in 2007
| High Point: | 409.6 |
| U.S. Average: | 229.1 |
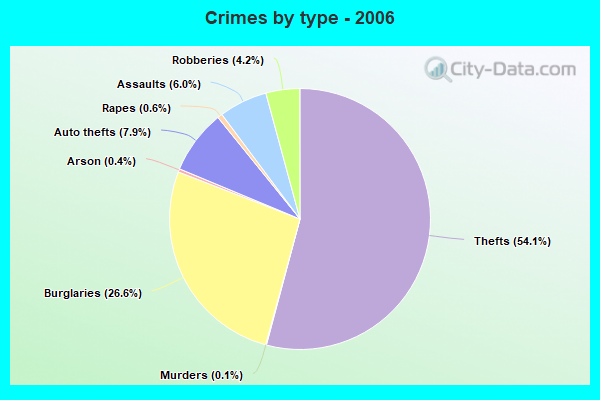
Violent crime rate in 2006
| High Point: | 352.1 |
| U.S. Average: | 232.6 |
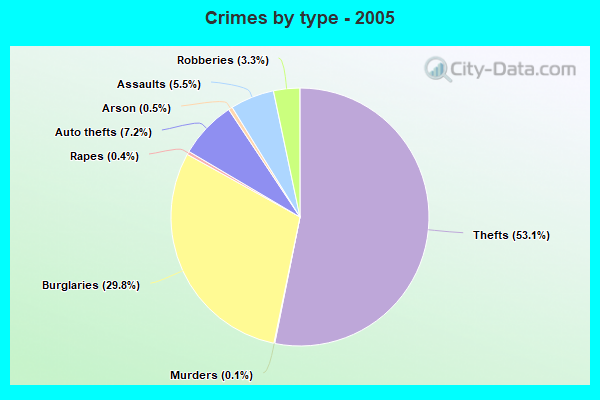
Violent crime rate in 2005
| High Point: | 315.8 |
| U.S. Average: | 227.0 |
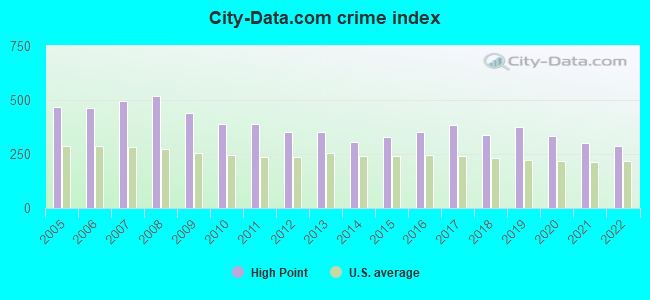
Property crime rate in 2022
| High Point: | 230.8 |
| U.S. Average: | 166.5 |
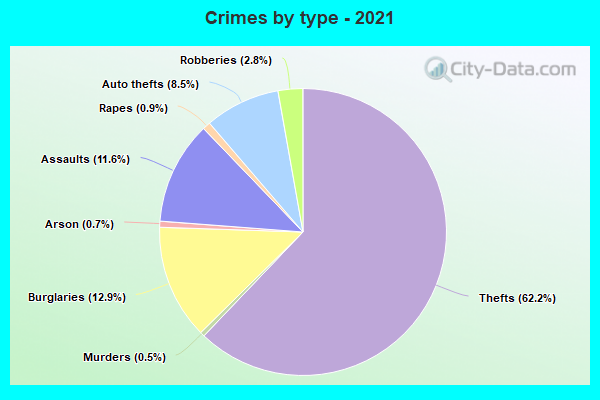
Property crime rate in 2021
| High Point: | 232.0 |
| U.S. Average: | 157.8 |
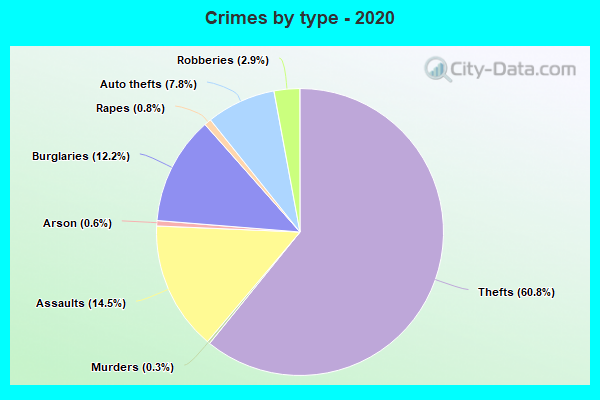
Property crime rate in 2020
| High Point: | 248.2 |
| U.S. Average: | 169.6 |
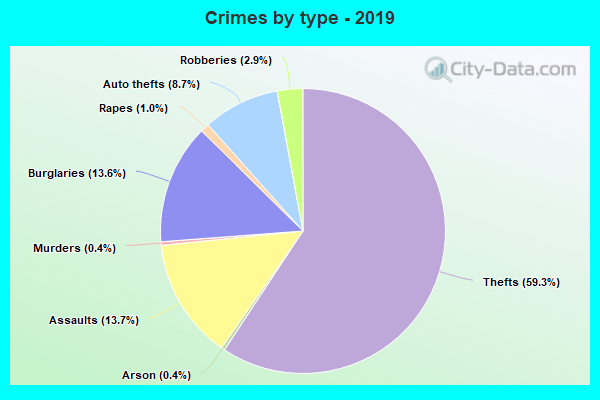
Property crime rate in 2019
| High Point: | 283.6 |
| U.S. Average: | 179.7 |
Property crime rate in 2018
| High Point: | 267.1 |
| U.S. Average: | 190.2 |
Property crime rate in 2017
| High Point: | 310.7 |
| U.S. Average: | 206.4 |
Property crime rate in 2016
| High Point: | 302.7 |
| U.S. Average: | 216.6 |
Property crime rate in 2015
| High Point: | 288.4 |
| U.S. Average: | 221.5 |
Property crime rate in 2014
| High Point: | 337.7 |
| U.S. Average: | 230.8 |
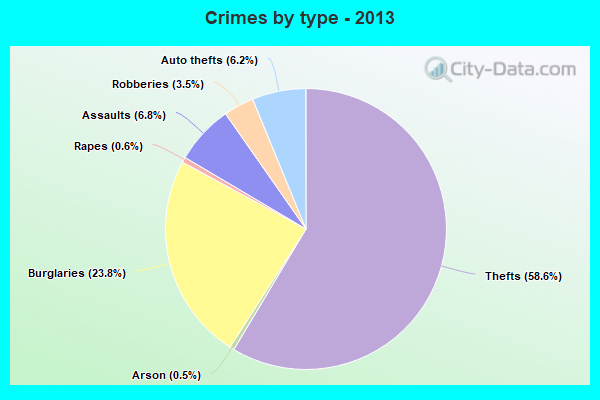
Property crime rate in 2013
| High Point: | 407.1 |
| U.S. Average: | 250.4 |
Property crime rate in 2012
| High Point: | 400.4 |
| U.S. Average: | 267.3 |
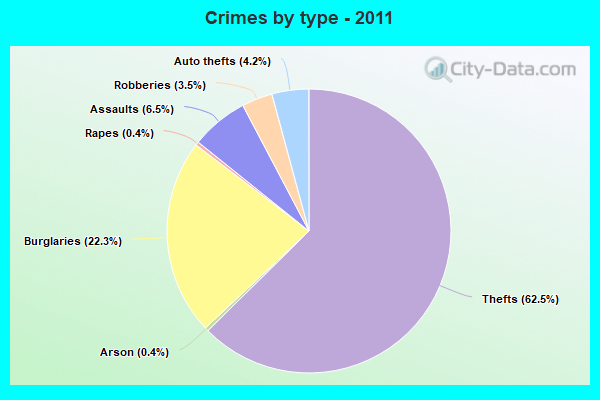
Property crime rate in 2011
| High Point: | 441.7 |
| U.S. Average: | 273.5 |
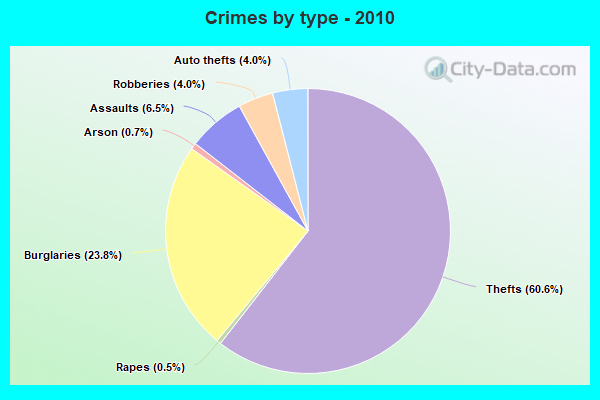
Property crime rate in 2010
| High Point: | 443.5 |
| U.S. Average: | 276.4 |
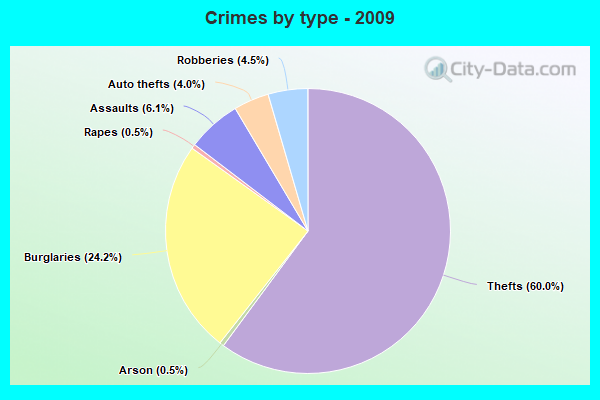
Property crime rate in 2009
| High Point: | 492.1 |
| U.S. Average: | 285.6 |
Property crime rate in 2008
| High Point: | 624.0 |
| U.S. Average: | 302.2 |
Property crime rate in 2007
| High Point: | 548.9 |
| U.S. Average: | 309.2 |
Property crime rate in 2006
| High Point: | 541.7 |
| U.S. Average: | 317.3 |
Property crime rate in 2005
| High Point: | 607.0 |
| U.S. Average: | 322.3 |
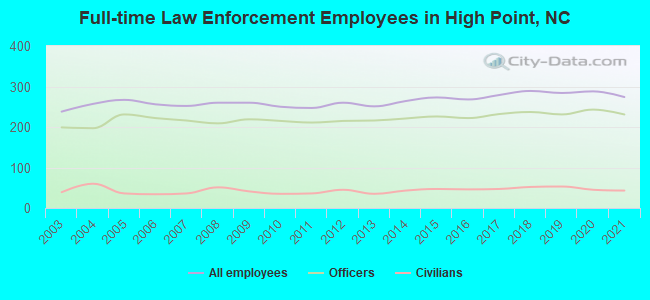
Full-time law enforcement employees in 2021, including police officers: 274 (231 officers - 193 male; 38 female).
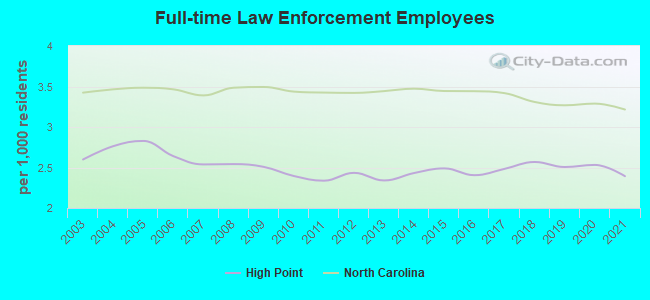
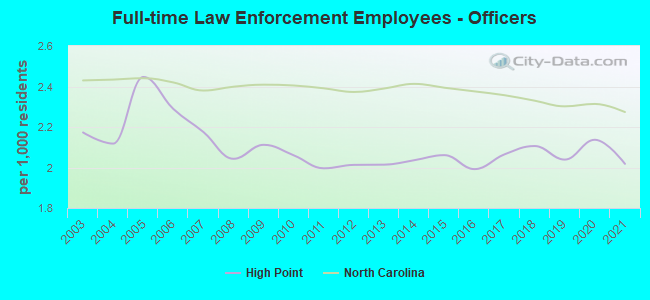
| Officers per 1,000 residents here: | 2.02 |
| North Carolina average: | 2.27 |
Full-time law enforcement employees in 2020, including police officers: 288 (243 officers - 209 male; 34 female).
| Officers per 1,000 residents here: | 2.14 |
| North Carolina average: | 2.31 |
Full-time law enforcement employees in 2019, including police officers: 284 (231 officers - 202 male; 29 female).
| Officers per 1,000 residents here: | 2.04 |
| North Carolina average: | 2.30 |
Full-time law enforcement employees in 2018, including police officers: 289 (237 officers - 205 male; 32 female).
| Officers per 1,000 residents here: | 2.11 |
| North Carolina average: | 2.33 |
Full-time law enforcement employees in 2017, including police officers: 279 (232 officers - 204 male; 28 female).
| Officers per 1,000 residents here: | 2.06 |
| North Carolina average: | 2.36 |
Full-time law enforcement employees in 2016, including police officers: 268 (222 officers - 193 male; 29 female).
| Officers per 1,000 residents here: | 1.99 |
| North Carolina average: | 2.38 |
Full-time law enforcement employees in 2015, including police officers: 273 (226 officers - 193 male; 33 female).
| Officers per 1,000 residents here: | 2.06 |
| North Carolina average: | 2.39 |
Full-time law enforcement employees in 2014, including police officers: 264 (221 officers - 194 male; 27 female).
| Officers per 1,000 residents here: | 2.04 |
| North Carolina average: | 2.41 |
Full-time law enforcement employees in 2013, including police officers: 251 (216 officers - 189 male; 27 female).
| Officers per 1,000 residents here: | 2.01 |
| North Carolina average: | 2.39 |
Full-time law enforcement employees in 2012, including police officers: 260 (215 officers - 185 male; 30 female).
| Officers per 1,000 residents here: | 2.01 |
| North Carolina average: | 2.37 |
Full-time law enforcement employees in 2011, including police officers: 247 (211 officers - 184 male; 27 female).
| Officers per 1,000 residents here: | 2.00 |
| North Carolina average: | 2.39 |
Full-time law enforcement employees in 2010, including police officers: 250 (215 officers - 186 male; 29 female).
| Officers per 1,000 residents here: | 2.06 |
| North Carolina average: | 2.40 |
Full-time law enforcement employees in 2009, including police officers: 260 (219 officers - 190 male; 29 female).
| Officers per 1,000 residents here: | 2.11 |
| North Carolina average: | 2.41 |
Full-time law enforcement employees in 2008, including police officers: 260 (209 officers - 181 male; 28 female).
| Officers per 1,000 residents here: | 2.04 |
| North Carolina average: | 2.40 |
Full-time law enforcement employees in 2007, including police officers: 252 (216 officers - 189 male; 27 female).
| Officers per 1,000 residents here: | 2.18 |
| North Carolina average: | 2.38 |
Full-time law enforcement employees in 2006, including police officers: 256 (222 officers - 194 male; 28 female).
| Officers per 1,000 residents here: | 2.29 |
| North Carolina average: | 2.42 |
Full-time law enforcement employees in 2005, including police officers: 267 (231 officers - 204 male; 27 female).
| Officers per 1,000 residents here: | 2.45 |
| North Carolina average: | 2.44 |
Full-time law enforcement employees in 2004, including police officers: 257 (197 officers - 176 male; 21 female).
| Officers per 1,000 residents here: | 2.12 |
| North Carolina average: | 2.43 |
Full-time law enforcement employees in 2003, including police officers: 238 (199 officers - 177 male; 22 female).
| Officers per 1,000 residents here: | 2.17 |
| North Carolina average: | 2.43 |