Crime rate in Honolulu, Hawaii (HI): murders, rapes, robberies, assaults, burglaries, thefts, auto thefts, arson, law enforcement employees, police officers
Crime rate in Honolulu, HI
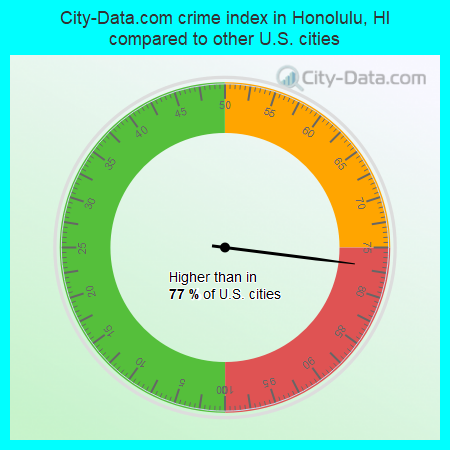
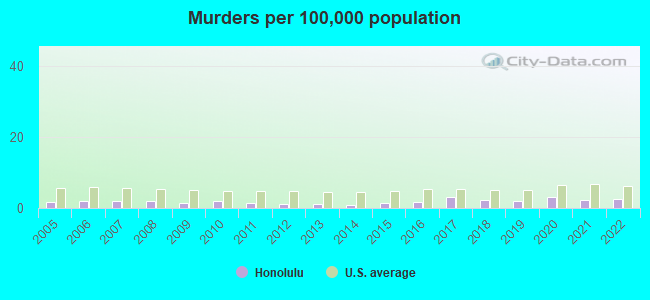
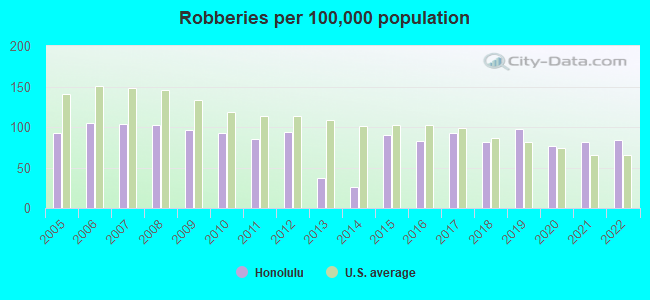
The 2022 crime rate in Honolulu, HI is 211 (City-Data.com crime index), which is comparable to the U.S. average. It was higher than in 77.0% U.S. cities. The 2022 Honolulu crime rate fell by 11% compared to 2021. The number of homicides stood at 25 - an increase of 3 compared to 2021. In the last 5 years Honolulu has seen decreasing violent crime and decline of property crime.See how dangerous Honolulu, HI is compared to the nearest cities:
(Note: Higher means more crime)
(Note: Higher means more crime)
| Honolulu: | 211.1 |
The City-Data.com crime index weighs serious crimes and violent crimes more heavily. Higher means more crime, U.S. average is 246.1. It adjusts for the number of visitors and daily workers commuting into cities.
- means the value is smaller than the state average.- means the value is about the same as the state average.
- means the value is bigger than the state average.
- means the value is much bigger than the state average.
According to our research of Hawaii and other state lists, there were 666 registered sex offenders living in Honolulu, Hawaii as of April 25, 2024.
The ratio of all residents to sex offenders in Honolulu is 563 to 1.
The ratio of registered sex offenders to all residents in this city is near the state average.
Violent crime rate in 2022
| Honolulu: | 145.4 |
| U.S. Average: | 219.8 |
Violent crime rate in 2021
| Honolulu: | 156.2 |
| U.S. Average: | 224.8 |
Violent crime rate in 2020
| Honolulu: | 154.3 |
| U.S. Average: | 228.2 |
Violent crime rate in 2019
| Honolulu: | 166.3 |
| U.S. Average: | 219.9 |
Violent crime rate in 2018
| Honolulu: | 156.2 |
| U.S. Average: | 221.2 |
Violent crime rate in 2017
| Honolulu: | 142.4 |
| U.S. Average: | 226.2 |
Violent crime rate in 2016
| Honolulu: | 139.5 |
| U.S. Average: | 227.3 |
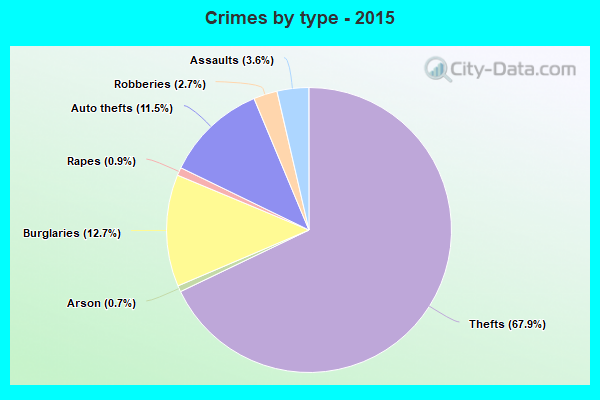
Violent crime rate in 2015
| Honolulu: | 140.1 |
| U.S. Average: | 219.3 |
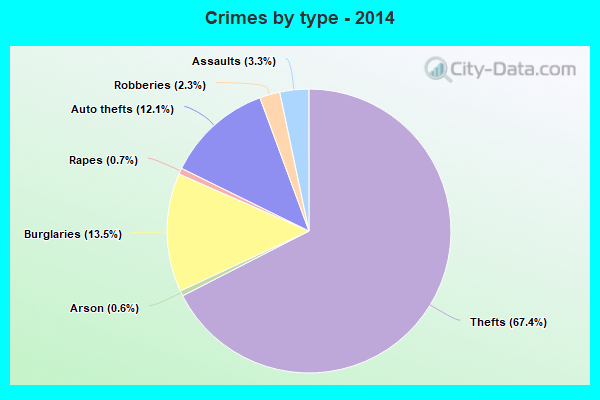
Violent crime rate in 2014
| Honolulu: | 41.0 |
| U.S. Average: | 211.1 |
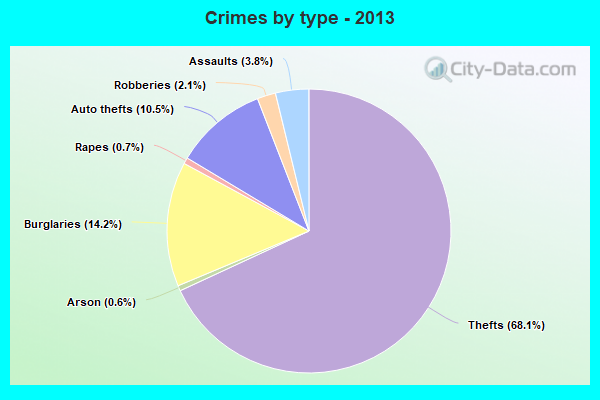
Violent crime rate in 2013
| Honolulu: | 65.3 |
| U.S. Average: | 214.2 |
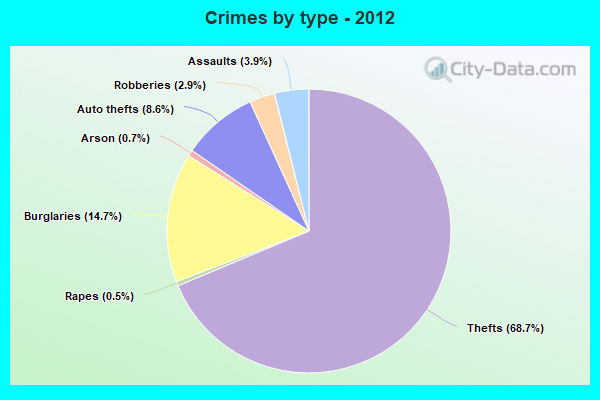
Violent crime rate in 2012
| Honolulu: | 129.8 |
| U.S. Average: | 187.4 |
Violent crime rate in 2011
| Honolulu: | 135.7 |
| U.S. Average: | 187.1 |
Violent crime rate in 2010
| Honolulu: | 148.1 |
| U.S. Average: | 195.7 |
Violent crime rate in 2009
| Honolulu: | 155.5 |
| U.S. Average: | 208.9 |
Violent crime rate in 2008
| Honolulu: | 156.2 |
| U.S. Average: | 222.5 |
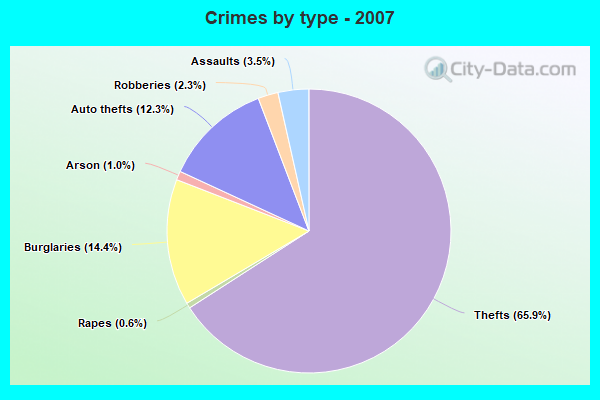
Violent crime rate in 2007
| Honolulu: | 84.6 |
| U.S. Average: | 229.1 |
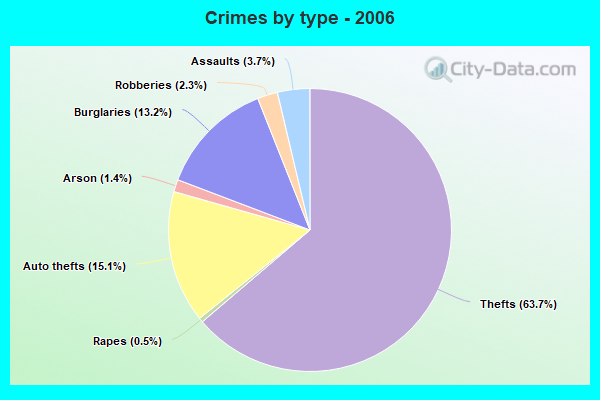
Violent crime rate in 2006
| Honolulu: | 87.8 |
| U.S. Average: | 232.6 |
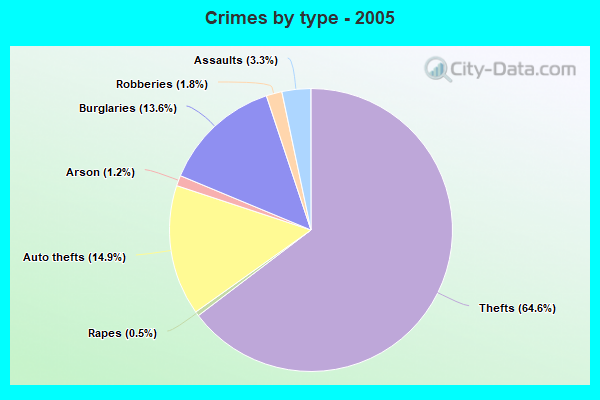
Violent crime rate in 2005
| Honolulu: | 83.0 |
| U.S. Average: | 227.0 |
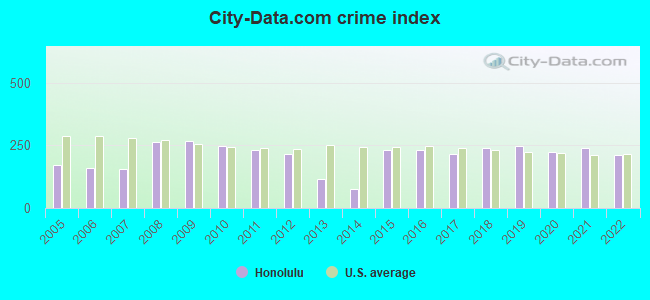
Property crime rate in 2022
| Honolulu: | 215.0 |
| U.S. Average: | 166.5 |
Property crime rate in 2021
| Honolulu: | 253.9 |
| U.S. Average: | 157.8 |
Property crime rate in 2020
| Honolulu: | 229.1 |
| U.S. Average: | 169.6 |
Property crime rate in 2019
| Honolulu: | 253.2 |
| U.S. Average: | 179.7 |
Property crime rate in 2018
| Honolulu: | 246.4 |
| U.S. Average: | 190.2 |
Property crime rate in 2017
| Honolulu: | 225.6 |
| U.S. Average: | 206.4 |
Property crime rate in 2016
| Honolulu: | 249.8 |
| U.S. Average: | 216.6 |
Property crime rate in 2015
| Honolulu: | 258.6 |
| U.S. Average: | 221.5 |
Property crime rate in 2014
| Honolulu: | 89.5 |
| U.S. Average: | 230.8 |
Property crime rate in 2013
| Honolulu: | 134.7 |
| U.S. Average: | 250.4 |
Property crime rate in 2012
| Honolulu: | 251.5 |
| U.S. Average: | 267.3 |
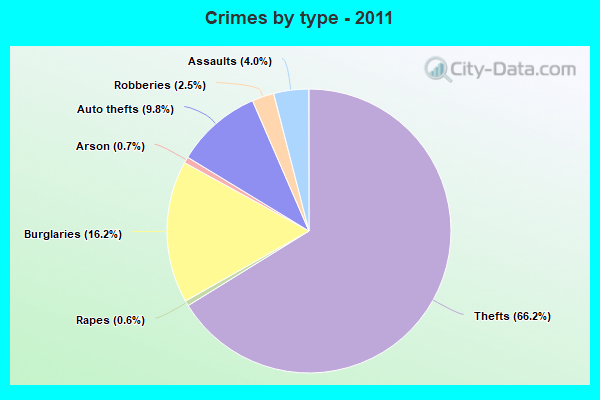
Property crime rate in 2011
| Honolulu: | 276.3 |
| U.S. Average: | 273.5 |
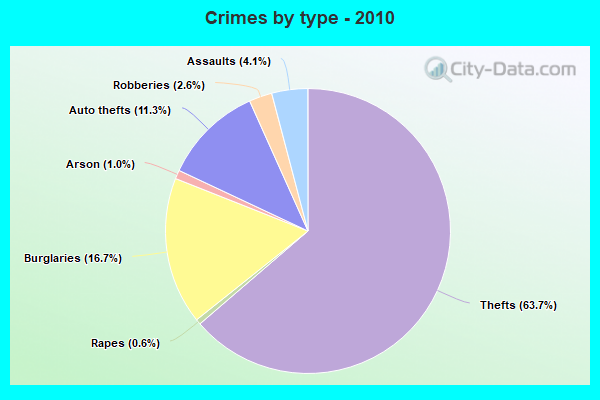
Property crime rate in 2010
| Honolulu: | 297.7 |
| U.S. Average: | 276.4 |
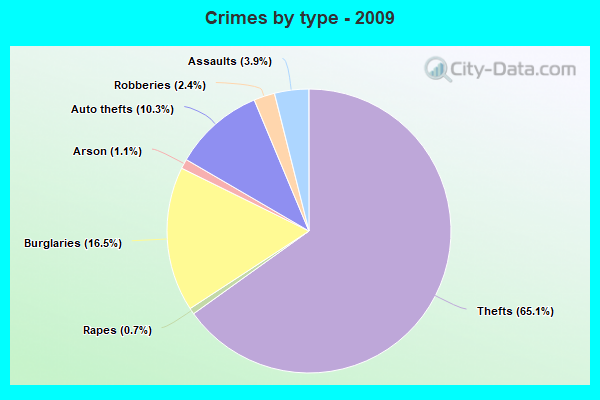
Property crime rate in 2009
| Honolulu: | 324.3 |
| U.S. Average: | 285.6 |
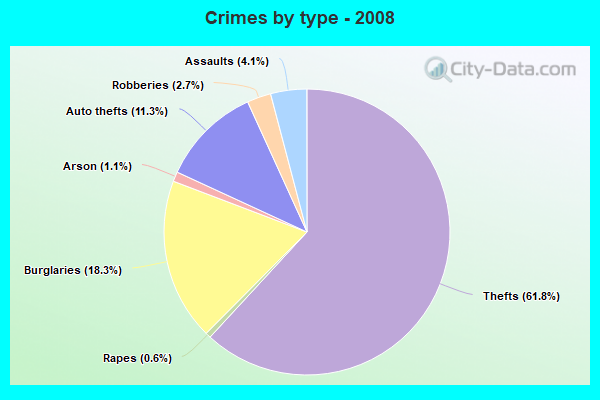
Property crime rate in 2008
| Honolulu: | 324.2 |
| U.S. Average: | 302.2 |
Property crime rate in 2007
| Honolulu: | 188.2 |
| U.S. Average: | 309.2 |
Property crime rate in 2006
| Honolulu: | 195.3 |
| U.S. Average: | 317.3 |
Property crime rate in 2005
| Honolulu: | 217.4 |
| U.S. Average: | 322.3 |
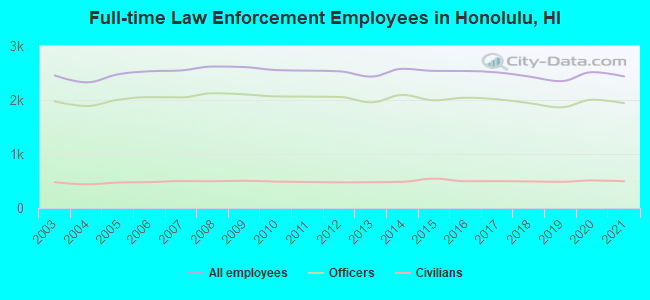
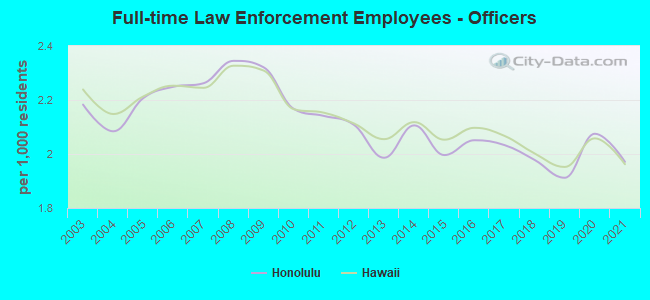
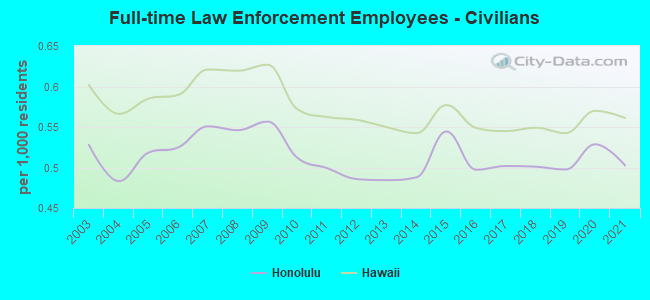
Full-time law enforcement employees in 2021, including police officers: 2,437 (1,942 officers - 1,686 male; 256 female).
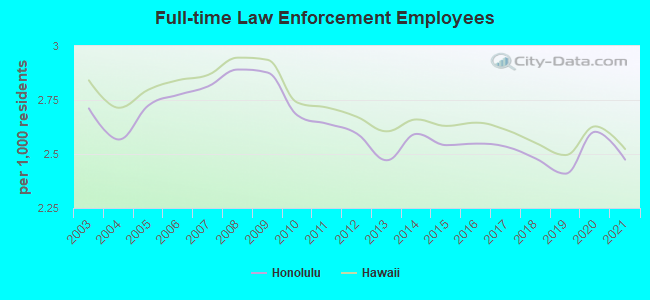
| Officers per 1,000 residents here: | 1.97 |
| Hawaii average: | 1.96 |
Full-time law enforcement employees in 2020, including police officers: 2,516 (2,005 officers - 1,753 male; 252 female).
| Officers per 1,000 residents here: | 2.07 |
| Hawaii average: | 2.06 |
Full-time law enforcement employees in 2019, including police officers: 2,349 (1,864 officers - 1,640 male; 224 female).
| Officers per 1,000 residents here: | 1.91 |
| Hawaii average: | 1.95 |
Full-time law enforcement employees in 2018, including police officers: 2,434 (1,942 officers - 1,710 male; 232 female).
| Officers per 1,000 residents here: | 1.98 |
| Hawaii average: | 2.00 |
Full-time law enforcement employees in 2017, including police officers: 2,510 (2,013 officers - 1,776 male; 237 female).
| Officers per 1,000 residents here: | 2.03 |
| Hawaii average: | 2.07 |
Full-time law enforcement employees in 2016, including police officers: 2,537 (2,042 officers - 1,808 male; 234 female).
| Officers per 1,000 residents here: | 2.05 |
| Hawaii average: | 2.10 |
Full-time law enforcement employees in 2015, including police officers: 2,539 (1,995 officers - 1,777 male; 218 female).
| Officers per 1,000 residents here: | 2.00 |
| Hawaii average: | 2.05 |
Full-time law enforcement employees in 2014, including police officers: 2,578 (2,093 officers - 1,893 male; 200 female).
| Officers per 1,000 residents here: | 2.11 |
| Hawaii average: | 2.12 |
Full-time law enforcement employees in 2013, including police officers: 2,433 (1,956 officers - 1,750 male; 206 female).
| Officers per 1,000 residents here: | 1.99 |
| Hawaii average: | 2.06 |
Full-time law enforcement employees in 2012, including police officers: 2,531 (2,057 officers - 1,839 male; 218 female).
| Officers per 1,000 residents here: | 2.11 |
| Hawaii average: | 2.11 |
Full-time law enforcement employees in 2011, including police officers: 2,544 (2,063 officers - 1,841 male; 222 female).
| Officers per 1,000 residents here: | 2.14 |
| Hawaii average: | 2.15 |
Full-time law enforcement employees in 2010, including police officers: 2,554 (2,066 officers - 1,841 male; 225 female).
| Officers per 1,000 residents here: | 2.17 |
| Hawaii average: | 2.17 |
Full-time law enforcement employees in 2009, including police officers: 2,610 (2,105 officers - 1,874 male; 231 female).
| Officers per 1,000 residents here: | 2.32 |
| Hawaii average: | 2.31 |
Full-time law enforcement employees in 2008, including police officers: 2,620 (2,125 officers - 1,889 male; 236 female).
| Officers per 1,000 residents here: | 2.34 |
| Hawaii average: | 2.33 |
Full-time law enforcement employees in 2007, including police officers: 2,548 (2,049 officers - 1,831 male; 218 female).
| Officers per 1,000 residents here: | 2.26 |
| Hawaii average: | 2.24 |
Full-time law enforcement employees in 2006, including police officers: 2,532 (2,053 officers - 1,836 male; 217 female).
| Officers per 1,000 residents here: | 2.25 |
| Hawaii average: | 2.25 |
Full-time law enforcement employees in 2005, including police officers: 2,476 (2,005 officers - 1,789 male; 216 female).
| Officers per 1,000 residents here: | 2.21 |
| Hawaii average: | 2.21 |
Full-time law enforcement employees in 2004, including police officers: 2,327 (1,889 officers - 1,687 male; 202 female).
| Officers per 1,000 residents here: | 2.08 |
| Hawaii average: | 2.15 |
Full-time law enforcement employees in 2003, including police officers: 2,454 (1,976 officers - 1,771 male; 205 female).
| Officers per 1,000 residents here: | 2.18 |
| Hawaii average: | 2.24 |

Zip codes: 96822.