Honolulu, Hawaii
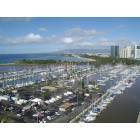
Honolulu: In Waikiki
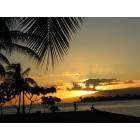
Honolulu: Honolulu Ala Moana Magic Island Sunset

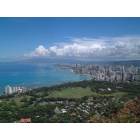
Honolulu: Viewing Diamond Head & Waikiki from Roundtop, Honolulu
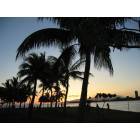
Honolulu: Honolulu Ala Moana Magic Island Sunset 2
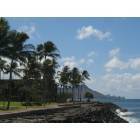
Honolulu: Viewing Diamond Head from Kaka'ako WaterFront Park
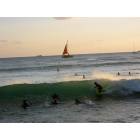
Honolulu: Surfing at Waikiki, Honolulu, HI
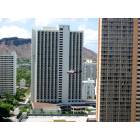
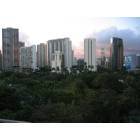
Honolulu: View from hotel in Honolulu, HI
Honolulu: Honolulu, Hawai'i, as seen from Diamond Head
Honolulu: Waikiki
Honolulu: turtle beach
Honolulu: Aliʻiolani Hale- Hawaii's Supreme Court and State Law Library
- see
90
more - add
your
Submit your own pictures of this place and show them to the world
- OSM Map
- General Map
- Google Map
- MSN Map
Population change since 2000: +0.8%
 |
| Males: 184,123 | |
| Females: 190,578 |
| Median resident age: | 39.7 years |
| Hawaii median age: | 36.2 years |
Zip codes: 96822.
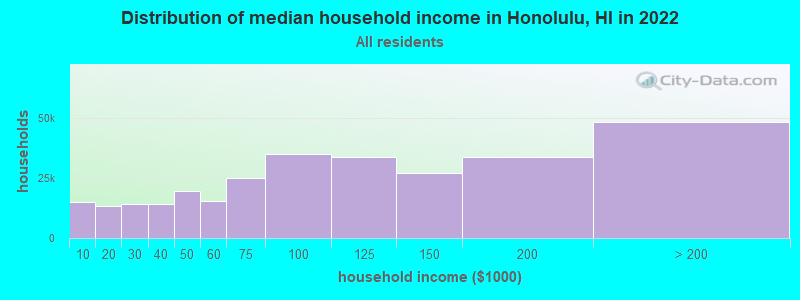
| Honolulu: | $83,926 |
| HI: | $92,458 |
Estimated per capita income in 2022: $47,956 (it was $24,191 in 2000)
Honolulu CDP income, earnings, and wages data
Estimated median house or condo value in 2022: over $1,000,000 (it was $317,300 in 2000)
| Honolulu: | over $1,000,000 |
| HI: | $820,100 |
Mean prices in 2022: all housing units: $999,130; detached houses: over $1,000,000; townhouses or other attached units: $982,127; in 2-unit structures: $920,464; in 3-to-4-unit structures: $717,340; in 5-or-more-unit structures: $577,655; mobile homes: over $1,000,000; occupied boats, rvs, vans, etc.: $319,807
Detailed information about poverty and poor residents in Honolulu, HI


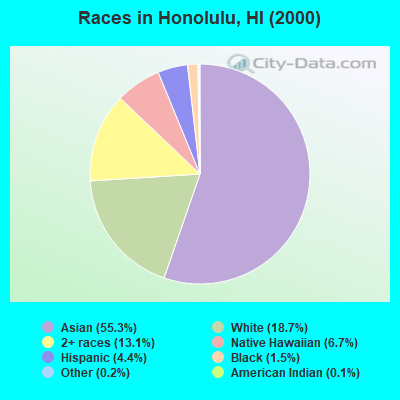
- 205,56355.3%Asian alone
- 69,50318.7%White alone
- 48,77313.1%Two or more races
- 24,7396.7%Native Hawaiian and Other
Pacific Islander alone - 16,2294.4%Hispanic
- 5,7061.5%Black alone
- 6440.2%Other race alone
- 5000.1%American Indian alone
Races in Honolulu detailed stats: ancestries, foreign born residents, place of birth
According to our research of Hawaii and other state lists, there were 666 registered sex offenders living in Honolulu, Hawaii as of April 26, 2024.
The ratio of all residents to sex offenders in Honolulu is 563 to 1.
The ratio of registered sex offenders to all residents in this city is near the state average.
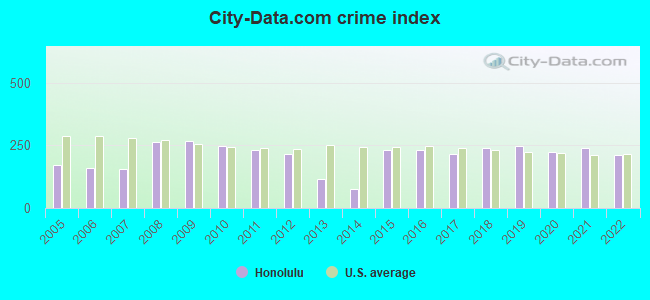
The City-Data.com crime index weighs serious crimes and violent crimes more heavily. Higher means more crime, U.S. average is 246.1. It adjusts for the number of visitors and daily workers commuting into cities.
- means the value is smaller than the state average.- means the value is about the same as the state average.
- means the value is bigger than the state average.
- means the value is much bigger than the state average.
Crime rate in Honolulu detailed stats: murders, rapes, robberies, assaults, burglaries, thefts, arson
Full-time law enforcement employees in 2021, including police officers: 2,437 (1,942 officers - 1,686 male; 256 female).
| Officers per 1,000 residents here: | 1.97 |
| Hawaii average: | 1.96 |
 Recent articles from our blog. Our writers, many of them Ph.D. graduates or candidates, create easy-to-read articles on a wide variety of topics.


Latest news from Honolulu, HI collected exclusively by city-data.com from local newspapers, TV, and radio stations
Ancestries: German (4.6%), English (3.8%), Irish (3.4%), Portuguese (2.2%), Italian (1.5%), French (1.3%).
Current Local Time: HST (no DST) time zone
Elevation: 18 feet
Land area: 85.7 square miles.
Population density: 4,372 people per square mile (average).
93,895 residents are foreign born (21.7% Asia).
| This place: | 25.3% |
| Hawaii: | 17.5% |
| Honolulu CDP: | 0.3% ($1,098) |
| Hawaii: | 0.3% ($765) |
Nearest city with pop. 1,000,000+: Los Angeles, CA  (2553.8 miles , pop. 3,694,820).
Nearest cities:
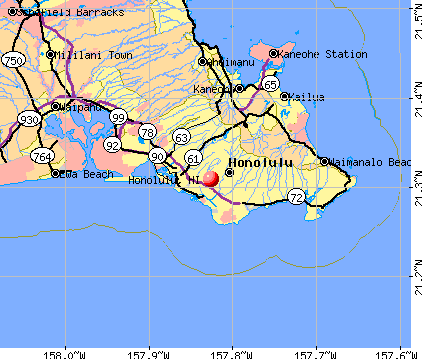
), ), ), ), )Latitude: 21.31 N, Longitude: 157.83 W
Daytime population change due to commuting: +93,305 (+25.1%)
Workers who live and work in this place: 147,888 (85.5%)
Area code: 808
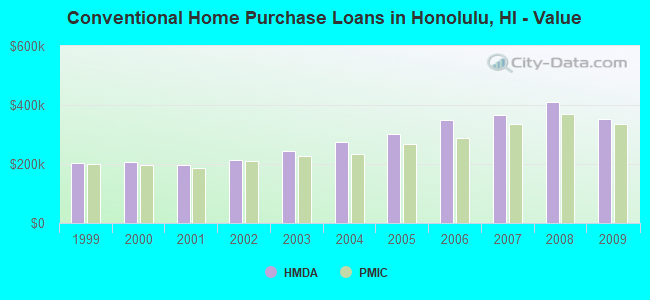
Property values in Honolulu, HI
Detailed articles:
- Honolulu: Introduction
- Honolulu Basic Facts
- Honolulu: Communications
- Honolulu: Convention Facilities
- Honolulu: Economy
- Honolulu: Education and Research
- Honolulu: Geography and Climate
- Honolulu: Health Care
- Honolulu: History
- Honolulu: Municipal Government
- Honolulu: Population Profile
- Honolulu: Recreation
- Honolulu: Transportation
Honolulu tourist attractions:
- Waikiki Sand Villa Hotel - Honolulu, HI - Hotel
- Royal Garden Waikiki - Honolulu, HI - Hotel
- Continental Surf Hotel - Honolulu - Hotel
- Ala Moana Hotel - Honolulu, Hawaii - Landmark Hotel near the Convention Center
- Aloha Flea Market - Honolulu, Hawaii - Outdoor Shopping Among 700 Vendors
- Aloha Stadium Swap Meet - Honolulu, Hawaii - Bargain Shopping Three Days a Week
- Aloha Tower Marketplace - Honolulu, Hawaii - Waterfront Shopping and Dining
- Aqua Waikiki Beachside Hotel - Honolulu, HI - Ocean view hotel
- Aqua Aloha Surf & Spa - Honolulu, Hawaii - Surf-Themed Waikiki Boutique Hotel
- Aqua Bamboo & Spa - Honolulu, Hawaii - Hotel Providing Sanctuary in Waikiki
- Aqua Palms & Spa - Honolulu, Hawaii - Boutique Hotel near Ala Moana Shopping Center
- Aqua Waikiki Pearl - Honolulu, Hawaii - Renovated Boutique Hotel in Waikiki
- Aqua Waikiki Wave - Honolulu, Hawaii - A Convenient Waikiki Boutique Hotel
- Aston Pacific Monarch - Honolulu, Hawaii - Condo-Resort with a Rooftop Pool
- Aston Waikiki Beach Hotel - Honolulu, Hawaii - Nostalgic Hotel near the Beach
- Aston Waikiki Beach Tower - Honolulu, Hawaii - Condominiums Facing the Pacific
- Aston Waikiki Circle Hotel - Honolulu, Hawaii - Central Waikiki's Round Hotel
- Aston Waikiki Joy Hotel - Honolulu, Hawaii - Small Hotel Offering Privacy and Relaxation
- Bishop Museum - Honolulu, Hawaii - State's Largest Museum Preserves Culture
- Castle Maile Sky Court - Honolulu, Hawaii - Scenic High-rise Hotel in Waikiki
- Celebrity Resorts Waikiki - Honolulu, HI - Hawaii hotel
- Children's Discovery Center - Honolulu, Hawaii - Challenging Young Minds with Interactive Learning
- Courtyard by Marriott Waikiki Beach - Honolulu, Hawaii - Marine Art Hotel in Waikiki
- Dolphin Quest Oahu - Honolulu, Hawaii - Programs for Swimming with Dolphins
- Embassy Suites Waikiki Beach Walk - Honolulu, Hawaii - Spacious New Suites near the Beach
- Ewa Hotel - Honolulu, Hawaii - Hotel
- Halekulani - Honolulu, Hawaii - A ``Heavenly'' Luxury Hotel on Waikiki Beach
- Hanauma Bay, Hawaii - Honolulu, Hawaii - Marine Reserve Sits in Capital of Island Chain State
- Harold L. Lyon Arboretum - Honolulu, Hawaii - A Unique Rainforest and Garden Experience
- Hawaiian Monarch Hotel - Honolulu, Hawaii - Hotel With Outdoor Pool
- Hawaiiana Hotel - Honolulu, Hawaii - Hotel with Traditional Waikiki Hospitality
- Hawaii Convention Center - Honolulu, Hawaii - Focal Point for Business in Oahu
- Hawaii Nature Center - Honolulu, Hawaii - Connecting Kids with the Environment
- Hawaii Prince Hotel Waikiki - Honolulu, Hawaii - Ocean Views from Every Hotel Room
- Hawaii State Art Museum - Honolulu, Hawaii - Historic Setting for Free Art Exhibits
- Hilton Hawaiian Village Beach Resort & Spa - Honolulu, Hawaii - Enduring Waikiki Resort
- Hilton Waikiki Prince Kuhio Hotel - Honolulu, Hawaii - Award-Winning Hotel Renovation
- Honolulu Academy of Arts - Honolulu, Hawaii - Hawaii's Premier Art Museum
- Honolulu International Airport - Honolulu HI Honolulu Hawaii Flights Airport
- Honolulu Screamer - Honolulu, Hawaii - Powerful Jet Boat for Extreme Sightseeing
- Honolulu Zoo in Honolulu, Hawaii
- Hotel Renew - Honolulu, Hawaii - New Designer Boutique Hotel in Waikiki
- Hyatt Regency Waikiki Resort & Spa - Honolulu, Hawaii - Grand Hotel on Waikiki Beach
- Ilikai Hotel & Suites - Honolulu, Hawaii - Original Icon at the Head of Waikiki
- Ilima Hotel - Honolulu, Hawaii - A Curiously Cultural Waikiki Condo Hotel
- The Imperial Hawaii Resort at Waikiki - Honolulu, Hawaii - Boutique Condotel near Waikiki Beach
- Iolani Palace - Honolulu, Hawaii - National Treasure and Home to Hawaiian Royalty
- The Kahala Hotel & Resort - Honolulu, Hawaii - A Grand Tradition in Hotel Splendor
- Queen Kapiolani Park - Honolulu, Hawaii - Top Park for Picnics, Concerts & Sports
- Koko Crater Botanical Garden - Honolulu, Hawaii - Plants Thrive in a Dormant Volcano
- Lili'uokalani Botanical Garden - Honolulu, Hawaii - Natural Urban Waterfall and Picnic Area
- The Lotus at Diamond Head - Honolulu, Hawaii - Boutique Hotel near Kapiolani Park
- Magic Island - Honolulu, Hawaii - Sandy Peninsula for Shore Diving, Sightseeing and Weddings
- Makapu'u Point - Honolulu, Hawaii - Oahu's Eastern Tip Features a Lighthouse
- Menehune Mac Factory Gift Center, Honolulu, Hawaii - The Place for Handcrafted Chocolates and More
- Miramar Hotel - Honolulu, Hawaii - Unpretentious Hotel in Central Waikiki
- Moana Surfrider - Honolulu, Hawaii - Resort Hailed as the ``First Lady of Waikiki''
- National Cemetery of the Pacific
- The Contemporary Museum
- Diamond Head Theatre
- Falls of Clyde
- Ko Olina Golf Club
- Kuma Kahua Theatre
- Kuan Yin Temple
- Luxury Row
- Lucoral Museum
- Manoa Valley Theatre
- Maunawili Trail
- Monty's Magic Theater
- Pacific Aerospace Museum
- Ala Wai Yacht Harbor
- Damien Museum
- Hawaii Kai Golf Course
- Hawaii Maritime Center
- Hawaii Opera Theatre
- Hawaii State Capitol
- Hawaii Theatre Center
- Hawaiian Rainforest Salon and Spa
- Hilo Hattie's
- Paradise Cove Luau
- Royal Mausoleum State Monument (Mauna Ala)
- Sans Souci Beach Park
- Honolulu Harbor
- Honolulu Symphony
- The Cirque Hawaii Theatre in Waikiki
- Iolani Bandstand
- Japanese Cultural Center of Hawaii
- The Pacific Place Tea Garden
- Judiciary Building
- Saint Augustine Church
- Waikiki Historic Trail
- Waikiki Shell
- Ward Entertainment Center
- Thomas Square
- Ty Gurney Surf School
- USS Arizona Memorial Visitor Center
- Kakaako Waterfront Park
- Kapiolani Community College Farmers Market
- Kawamoto Orchid Nursery
- Kennedy Theatre
- Kewalo Basin
- King's Guard Museum
- King's Village Shopping Center
- Pali Highway
- The New Otani Kaimana Beach Hotel - Honolulu, Hawaii - Japanese-owned Hotel near Diamond Head
- Nuuanu Pali Lookout - Honolulu, Hawaii - Panoramic Views of Oahu's Windward Coast
- Ocean Resort Hotel Waikiki - Honolulu, HI - Beach view hotel
- Ohana East - Honolulu, Hawaii - One Hotel Fits All in Central Waikiki
- Ohana Waikiki Beachcomber - Honolulu, Hawaii - Central Waikiki Hotel Celebrates the Fifties
- Ohana Waikiki Malia - Honolulu, Hawaii - Hotel with a Convenient Waikiki Location
- Ohana Waikiki West - Honolulu, Hawaii - Basic Accommodations in Central Waikiki
- Outrigger Luana Waikiki - Honolulu, Hawaii - Parkside Condominium Resort near Waikiki
- Outrigger Reef on the Beach - Honolulu, Hawaii - Waikiki Beach Walk's Flagship Hotel
- Outrigger Waikiki on the Beach - Honolulu, Hawaii - An Elegantly Hawaiian Resort
- Pacific Aviation Museum Pearl Harbor - Oahu, Hawaii - Tribute to Air Battles of World War II
- Pacific Beach Hotel - Honolulu, Hawaii - Self-Contained Waikiki Mega-Resort
- Pagoda Hotel, Honolulu
- Park Shore Waikiki - Honolulu, Hawaii - Modest Waikiki Hotel near Diamond Head
- Pearl Harbor - Honolulu, Hawaii - Historic Port and Naval Base on Oahu Island
- Puu Ualakaa State Park - Honolulu, Hawaii - Panoramic Views & Stunning Sunsets
- Queen Kapiolani Hotel - Honolulu, HI - Hawaiian resort
- Queen Emma Summer Palace - Honolulu, Hawaii - Royal Retreat Turned Museum
- Royal Grove Hotel - Honolulu, Hawaii - Hotel with Outdoor Swimming Pool
- The Royal Hawaiian - Honolulu, Hawaii - Landmark Pink Hotel on Waikiki Beach
- Royal Hawaiian Center - Honolulu, Hawaii - Shopping in the Heart of Waikiki
- Shangri La - Honolulu, Hawaii - House with a Unique Perspective on Islamic Art
- Sheraton Princess Kaiulani - Honolulu, Hawaii - Waikiki Hotel with a Royal Heritage
- Sheraton Waikiki - Honolulu, Hawaii - Beachfront Resort for Business and Pleasure
- The Equus Hotel, Honolulu, Hawaii
- USS Arizona Memorial - Honolulu, Hawaii - Tribute to Lives Lost at Pearl Harbor
- USS Bowfin Submarine Museum & Park - Honolulu, Hawaii - Tribute to World War II Submarines
- Battleship Missouri Memorial - Honolulu, Hawaii - Historic Warship Tour in Pearl Harbor
- US Army Museum of Hawaii - Honolulu, Hawaii - A Tribute to Hawaii's Defenders
- Waikiki Gateway Hotel - Honolulu, HI - Island hotel in a prime location
- Waikiki Marina Hotel - Honolulu, HI - Oceanfront hotel
- Waikiki Prince - Honolulu, Hawaii - Hotel
- Waikiki Aquarium - Honolulu, Hawaii - An Abundance of Marine Life on Display
- Waikiki Beach, Oahu, Hawaii - Honolulu, HI - Famous Beach in State Capital Blanketed by Resorts
- Waikiki Beach Marriott Resort & Spa - Honolulu, Hawaii - Landmark Hotel near Diamond Head
- Waikiki Beach Walk - Honolulu, Hawaii - Waikiki's Largest Development Project
- Waikiki Marina Resort at the Ilikai - Honolulu, Hawaii - Condo Studios at the Head of Waikiki Beach
- Waikiki Parc Hotel - Honolulu, Hawaii - Stylishly Renovated Boutique Hotel in Waikiki
- Waikiki Resort Hotel - Honolulu, Hawaii - Recently Upgraded Hotel Rooms in Waikiki
- Waikiki Trolley - Honolulu, Hawaii - Sightseeing and Transportation Combined
- Ward Centre - Honolulu, Hawaii - Shopping and Dining by Ala Moana Beach Park
Honolulu, Hawaii accommodation & food services, waste management - Economy and Business Data
| Here: | 2.5% |
| Hawaii: | 2.9% |
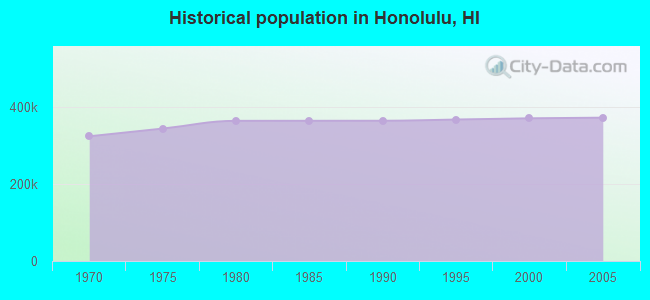
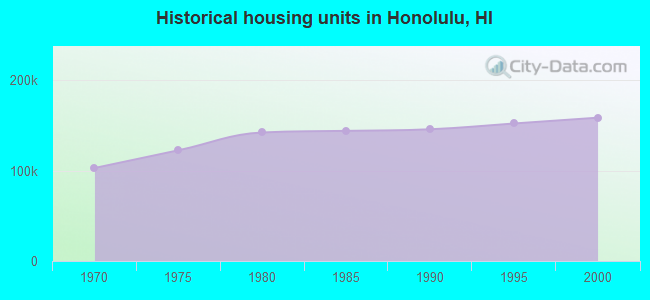
Population change in the 1990s: +4,583 (+1.2%).
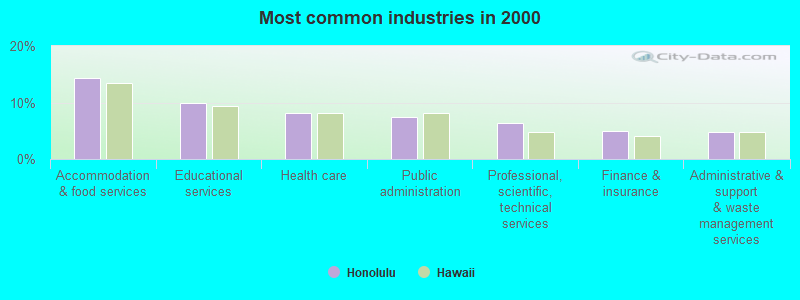
- Accommodation & food services (14.3%)
- Educational services (10.0%)
- Health care (8.1%)
- Public administration (7.5%)
- Professional, scientific, technical services (6.4%)
- Finance & insurance (5.0%)
- Administrative & support & waste management services (4.9%)
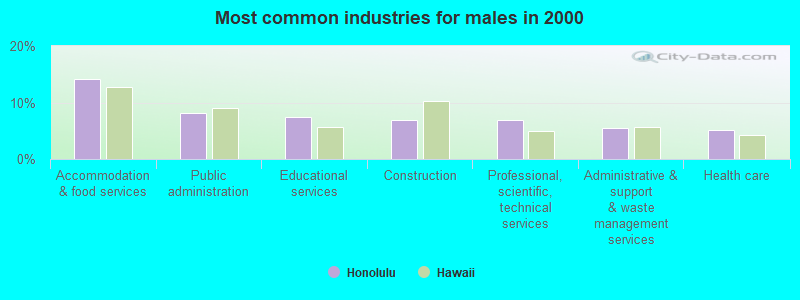
- Accommodation & food services (14.2%)
- Public administration (8.1%)
- Educational services (7.4%)
- Construction (7.0%)
- Professional, scientific, technical services (6.9%)
- Administrative & support & waste management services (5.4%)
- Health care (5.1%)
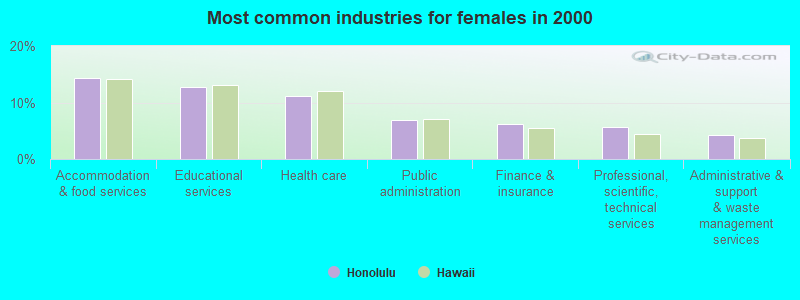
- Accommodation & food services (14.3%)
- Educational services (12.7%)
- Health care (11.2%)
- Public administration (6.9%)
- Finance & insurance (6.2%)
- Professional, scientific, technical services (5.7%)
- Administrative & support & waste management services (4.2%)
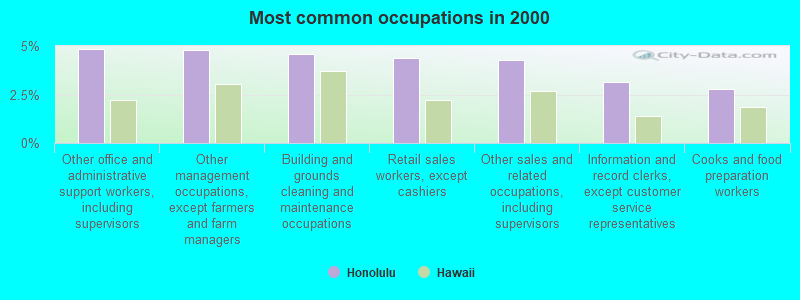
- Other office and administrative support workers, including supervisors (4.8%)
- Other management occupations, except farmers and farm managers (4.8%)
- Building and grounds cleaning and maintenance occupations (4.6%)
- Retail sales workers, except cashiers (4.4%)
- Other sales and related occupations, including supervisors (4.3%)
- Information and record clerks, except customer service representatives (3.2%)
- Cooks and food preparation workers (2.8%)
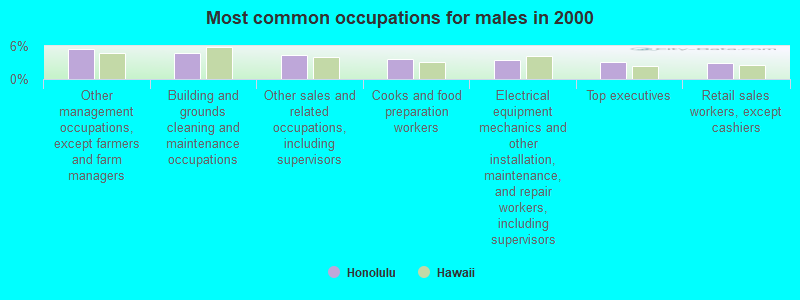
- Other management occupations, except farmers and farm managers (5.4%)
- Building and grounds cleaning and maintenance occupations (4.7%)
- Other sales and related occupations, including supervisors (4.3%)
- Cooks and food preparation workers (3.6%)
- Electrical equipment mechanics and other installation, maintenance, and repair workers, including supervisors (3.5%)
- Top executives (3.0%)
- Retail sales workers, except cashiers (2.9%)
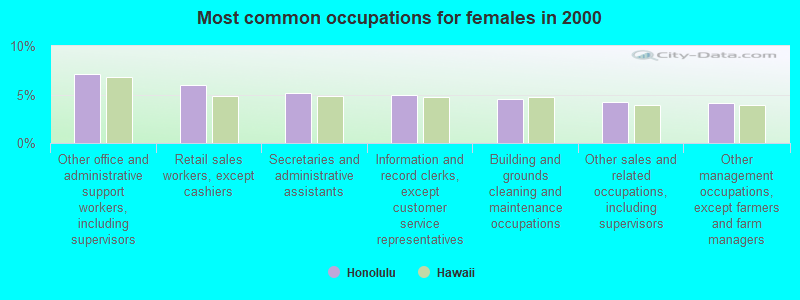
- Other office and administrative support workers, including supervisors (7.1%)
- Retail sales workers, except cashiers (6.0%)
- Secretaries and administrative assistants (5.2%)
- Information and record clerks, except customer service representatives (4.9%)
- Building and grounds cleaning and maintenance occupations (4.5%)
- Other sales and related occupations, including supervisors (4.2%)
- Other management occupations, except farmers and farm managers (4.1%)
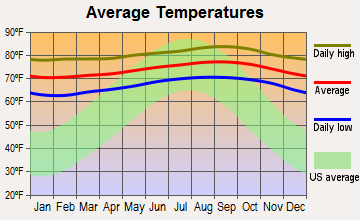
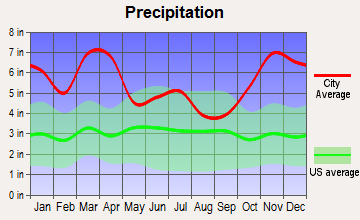
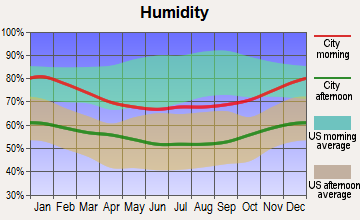
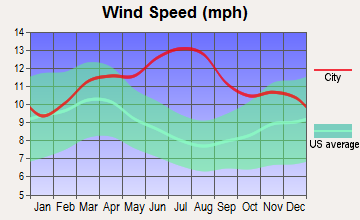
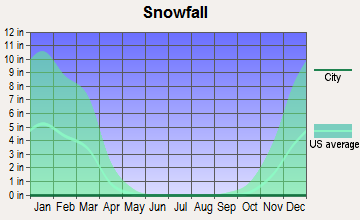
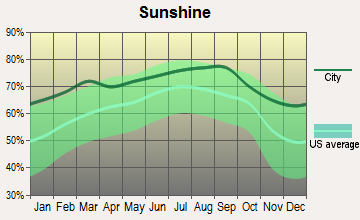
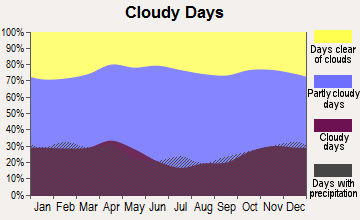
Average climate in Honolulu, Hawaii
Based on data reported by over 4,000 weather stations
|
|

(lower is better)
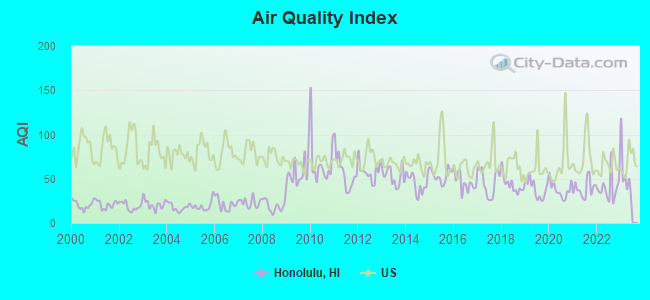
Air Quality Index (AQI) level in 2022 was 39.4. This is significantly better than average.
| City: | 39.4 |
| U.S.: | 72.6 |
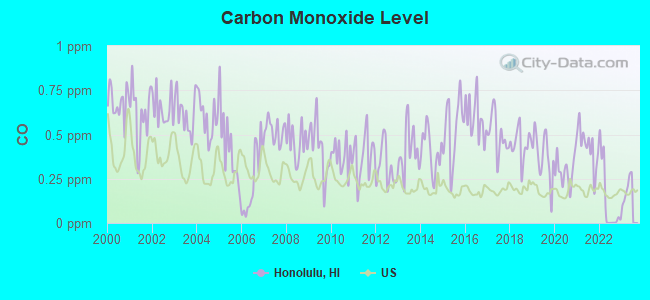
Carbon Monoxide (CO) [ppm] level in 2022 was 0.123. This is significantly better than average. Closest monitor was 1.9 miles away from the city center.
| City: | 0.123 |
| U.S.: | 0.251 |
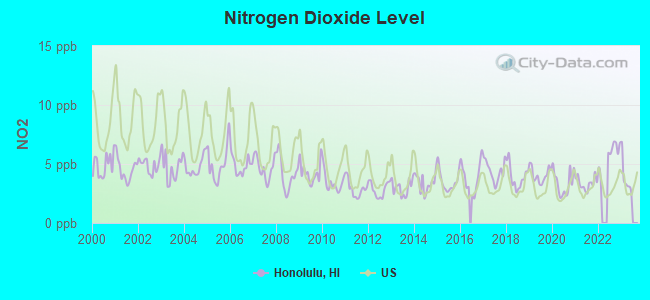
Nitrogen Dioxide (NO2) [ppb] level in 2022 was 5.88. This is about average. Closest monitor was 1.7 miles away from the city center.
| City: | 5.88 |
| U.S.: | 5.11 |
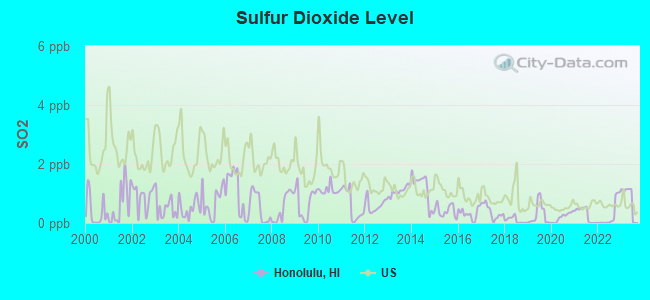
Sulfur Dioxide (SO2) [ppb] level in 2022 was 0.273. This is significantly better than average. Closest monitor was 1.7 miles away from the city center.
| City: | 0.273 |
| U.S.: | 1.515 |
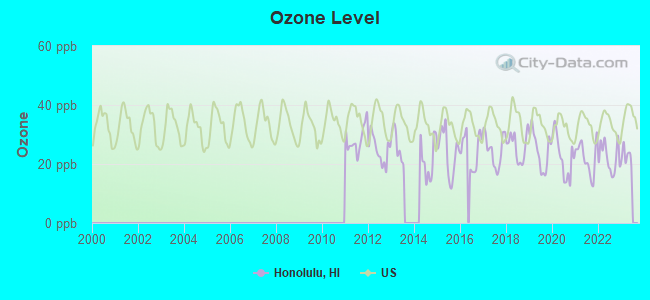
Ozone [ppb] level in 2022 was 22.1. This is significantly better than average. Closest monitor was 1.9 miles away from the city center.
| City: | 22.1 |
| U.S.: | 33.3 |
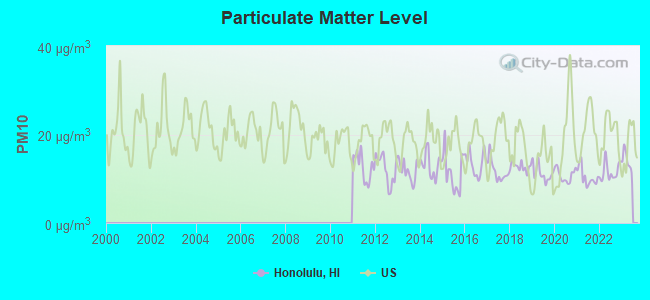
Particulate Matter (PM10) [µg/m3] level in 2022 was 11.6. This is significantly better than average. Closest monitor was 1.9 miles away from the city center.
| City: | 11.6 |
| U.S.: | 19.2 |
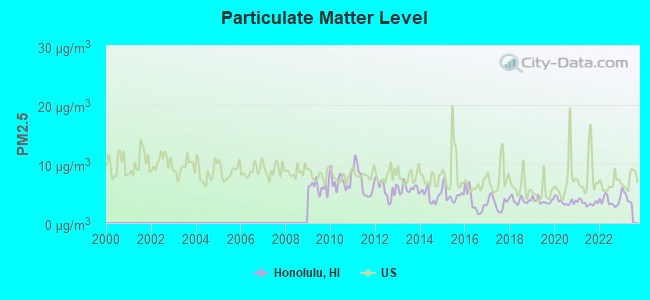
Particulate Matter (PM2.5) [µg/m3] level in 2022 was 3.70. This is significantly better than average. Closest monitor was 1.9 miles away from the city center.
| City: | 3.70 |
| U.S.: | 8.11 |
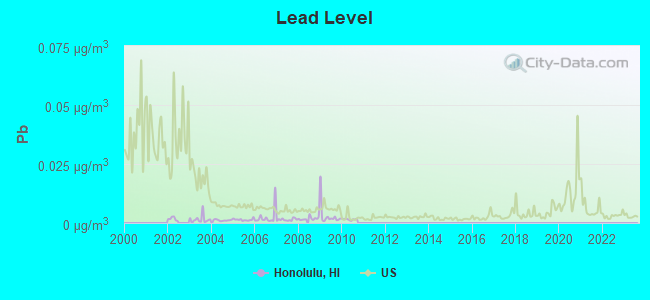
Lead (Pb) [µg/m3] level in 2010 was 0.00154. This is significantly better than average. Closest monitor was 1.9 miles away from the city center.
| City: | 0.00154 |
| U.S.: | 0.00931 |
Earthquake activity:
Honolulu-area historical earthquake activity is significantly above Hawaii state average. It is 1160% greater than the overall U.S. average.On 11/29/1975 at 14:47:40, a magnitude 7.2 (6.0 MB, 7.1 MS, 7.2 UK, 7.2 MS, Class: Major, Intensity: VIII - XII) earthquake occurred 222.0 miles away from the city center, causing 2 deaths (2 shaking deaths)
On 8/21/1951 at 10:57:00, a magnitude 6.9 (6.9 UK, Class: Strong, Intensity: VII - IX) earthquake occurred 160.1 miles away from the city center
On 10/15/2006 at 17:07:49, a magnitude 6.7 (6.2 MB, 6.6 MS, 6.7 MW) earthquake occurred 155.5 miles away from the city center
On 10/15/2006 at 17:07:49, a magnitude 6.7 (6.7 MD, Depth: 23.7 mi) earthquake occurred 157.5 miles away from Honolulu center
On 5/4/2018 at 22:32:54, a magnitude 6.9 (6.9 MW, Depth: 3.6 mi) earthquake occurred 229.3 miles away from the city center
On 11/16/1983 at 16:13:00, a magnitude 6.7 (6.4 MB, 6.7 MS, 6.7 MW) earthquake occurred 204.9 miles away from the city center, causing $6,000,000 total damage
Magnitude types: body-wave magnitude (MB), duration magnitude (MD), surface-wave magnitude (MS), moment magnitude (MW)
Natural disasters:
The number of natural disasters in Honolulu County (16) is near the US average (15).Major Disasters (Presidential) Declared: 10
Emergencies Declared: 1
Causes of natural disasters: Floods: 7, Storms: 7, Fires: 3, Mudslides: 3, Landslides: 2, Earthquake: 1, Flash Flood: 1, Heavy Rain: 1, Hurricane: 1, Tsunami Wave: 1, Typhoon: 1, Other: 1 (Note: some incidents may be assigned to more than one category).
Main business address for: ML MACADAMIA ORCHARDS L P (AGRICULTURE PRODUCTION - CROPS), HAWAIIAN ELECTRIC CO INC (ELECTRIC SERVICES), BANCWEST CORP/HI (STATE COMMERCIAL BANKS), HAWAIIAN HOLDINGS INC (AIR TRANSPORTATION, SCHEDULED), CENTRAL PACIFIC FINANCIAL CORP (STATE COMMERCIAL BANKS), HAWAIIAN ELECTRIC INDUSTRIES INC (ELECTRIC SERVICES), CB BANCSHARES INC/HI (STATE COMMERCIAL BANKS), BANK OF HAWAII CORP (STATE COMMERCIAL BANKS) and 1 other public companies.
Hospitals in Honolulu:
- BRISTOL HOSPICE - HAWAII, LLC (1100 WARD AVENUE, SUITE 702)
- HAWAII MEDICAL CENTER EAST (provides emergency services, 2230 LILIHA STREET)
- HOSPICE HAWAII (2449 10TH AVENUE)
- KAISER FOUNDATION HOSPITAL (Voluntary non-profit - Private, provides emergency services, 3288 MOANALUA RD)
- KAPIOLANI MED CTR FOR WOMEN AND CHILDREN (provides emergency services, 1319 PUNAHOU STREET)
- KUAKINI MEDICAL CENTER (Voluntary non-profit - Private, provides emergency services, 347 NORTH KUAKINI STREET)
- PROFESSIONAL PLAZA ASC (1520 LILIHA STREET SUITE 302)
- SELECT SPECIALTY HOSPITAL ("1301 PUNCHBOWL ST, KAMAHEMAHA, 3RD FLOOR")
- ST FRANCIS HOSPICE (24 PUIWA ROAD)
- STRAUB CLINIC AND HOSPITAL (Proprietary, 888 SO KING STREET)
- THE QUEENS MEDICAL CENTER (Voluntary non-profit - Private, 1301 PUNCHBOWL ST)
Airports and heliports located in Honolulu:
- Honolulu International Airport (HNL) (Runways: 6, Commercial Ops: 157,299, Air Taxi Ops: 79,557, Itinerant Ops: 52,652, Local Ops: 827, Military Ops: 21,288)
- Heco-Waiau Heliport (HI24)
- Kuakini Medical Center Heliport (HI40)
- Moanalua Medical Center Heliport (HI55)
- The Queen's Medical Center Heliport (HI38)
Colleges/Universities in Honolulu:
- University of Hawaii at Manoa (Full-time enrollment: 16,461; Location: 2500 Campus Road, Hawaii Hall; Public; Website: manoa.hawaii.edu; Offers Doctor's degree)
- Hawaii Pacific University (Full-time enrollment: 5,506; Location: 1164 Bishop Street, Suite 800; Private, not-for-profit; Website: www.hpu.edu; Offers Master's degree)
- Kapiolani Community College (Full-time enrollment: 5,069; Location: 4303 Diamond Head Rd; Public; Website: kapiolani.hawaii.edu/page/home)
- Chaminade University of Honolulu (Full-time enrollment: 2,610; Location: 3140 Waialae Avenue; Private, not-for-profit; Website: www.chaminade.edu; Offers Master's degree)
- Honolulu Community College (Full-time enrollment: 2,538; Location: 874 Dillingham Blvd; Public; Website: www2.honolulu.hawaii.edu)
- Heald College-Honolulu (Full-time enrollment: 1,815; Location: 1500 Kapiolani Blvd; Private, for-profit; Website: www.heald.edu/locations/honolulu)
- University of Phoenix-Hawaii Campus (Full-time enrollment: 1,197; Location: 745 Fort Street; Private, for-profit; Website: www.phoenix.edu; Offers Master's degree)
- Remington College-Honolulu Campus (Full-time enrollment: 963; Location: 1111 Bishop St Ste 400; Private, not-for-profit; Website: www.remingtoncollege.edu/honolulu-hawaii-colleges-career-schools)
- Argosy University-Hawaii (Full-time enrollment: 443; Location: 1001 Bishop Street, Suite 400; Private, for-profit; Website: www.argosy.edu/hawaii/; Offers Doctor's degree)
- Travel Institute of the Pacific (Full-time enrollment: 247; Location: 1314 S King St Ste 1164; Private, for-profit; Website: WWW.TIPHAWAII.COM)
- Hawaii Medical College (Full-time enrollment: 203; Location: 1221 Kapiolani Boulevard; Private, for-profit; Website: www.hmi.edu)
- Paul Mitchell the School-Honolulu (Full-time enrollment: 185; Location: 1123 Eleventh Avenue, Suite 102; Private, for-profit; Website: honolulu.paulmitchell.edu)
- Med-Assist School of Hawaii Inc (Full-time enrollment: 158; Location: 33 S King Ste 223; Private, for-profit; Website: www.mash.edu/)
- Hawaii Institute of Hair Design (Full-time enrollment: 127; Location: 1128 Nuuanu Avenue; Private, for-profit; Website: www.hihdhawaii.net)
- New Hope Christian College-Honolulu (Full-time enrollment: 88; Location: 290 Sand Island Access Rd; Private, not-for-profit; Website: hawaii.newhope.edu/; Offers Master's degree)
- Institute of Clinical Acupuncture & Oriental Med (Full-time enrollment: 49; Location: 100 N. Beretania Street, Suite 203B; Private, for-profit; Website: www.orientalmedicine.edu; Offers Master's degree)
- World Medicine Institute (Full-time enrollment: 43; Location: 1073 Hind Iuka Drive; Private, not-for-profit; Website: www.wmi.edu; Offers Doctor's degree)
- University of Hawaii System Office (Location: 2444 Dole St; Public; Website: www.hawaii.edu; Offers Doctor's degree)
Biggest public high schools in Honolulu:
- GOVERNOR WALLACE RIDER FARRINGTON HIGH SCHOOL (Students: 2,637, Location: 1564 NORTH KING ST, Grades: 9-12)
- MOANALUA HIGH SCHOOL (Students: 2,102, Location: 2825 ALA ILIMA ST, Grades: 9-12)
- PRESIDENT WILLIAM MCKINLEY HIGH SCHOOL (Students: 1,789, Location: 1039 SOUTH KING ST, Grades: 9-12)
- PRESIDENT THEODORE ROOSEVELT HIGH SCHOOL (Students: 1,385, Location: 1120 NEHOA ST, Grades: 9-12)
- ADMIRAL ARTHUR W RADFORD HIGH SCHOOL (Students: 1,188, Location: 4361 SALT LAKE BLVD, Grades: 9-12)
- KAIMUKI HIGH SCHOOL (Students: 1,161, Location: 2705 KAIMUKI AVE, Grades: 9-12)
- KALANI HIGH SCHOOL (Students: 1,137, Location: 4680 KALANIANAOLE HWY, Grades: 9-12)
- HENRY J KAISER HIGH SCHOOL (Students: 1,017, Location: 511 LUNALILO HOME RD, Grades: 9-12)
- MYRON B. THOMPSON ACADEMY - A NEW CENTURY PCS (Students: 552, Location: 1040A RICHARDS ST, Grades: KG-12, Charter school)
- HALAU LOKAHI - A NEW CENTURY PUBLIC CHARTER SCHOOL (Students: 214, Location: 401 WAIAKAMILO RD, Grades: KG-12, Charter school)
Biggest private high schools in Honolulu:
- PUNAHOU SCHOOL (Students: 3,743, Location: 1601 PUNAHOU ST, Grades: KG-12)
- KAMEHAMEHA SCHOOLS KAPALAMA CAMPUS (Students: 3,190, Location: 1887 MAKUAKANE ST, Grades: KG-12)
- MID-PACIFIC INSTITUTE (Students: 1,548, Location: 2445 KAALA ST, Grades: PK-12)
- MARYKNOLL SCHOOL (Students: 1,428, Location: 1722 DOLE ST AND 1402 DUNAHOU ST (2CAMPUSES), Grades: KG-12)
- HAWAII BAPTIST ACADEMY (Students: 1,121, Location: 2429 PALI HWY, Grades: KG-12)
- ST LOUIS SCHOOL (Students: 614, Location: 3142 WAIALAE AVE, Grades: 6-12, Boys only)
- ST FRANCIS SCHOOL (Students: 495, Location: 2707 PAMOA RD, Grades: PK-12)
- DAMIEN MEMORIAL SCHOOL (Students: 371, Location: 1401 HOUGHTAILING ST, Grades: 6-12, Boys only)
- ST ANDREWS PRIORY SCHOOL (Students: 369, Location: 224 QUEEN EMMA SQ, Grades: KG-12, Girls only)
- CHRISTIAN ACADEMY (Students: 351, Location: 3400 MOANALUA RD, Grades: PK-12)
Biggest public elementary/middle schools in Honolulu:
- KING DAVID KALAKAUA MIDDLE SCHOOL (Students: 994, Location: 821 KALIHI ST, Grades: 6-8)
- MOANALUA MIDDLE SCHOOL (Students: 914, Location: 1289 MAHIOLE ST, Grades: 7-8)
- ALIAMANU ELEMENTARY SCHOOL (Students: 902, Location: 3265 SALT LAKE BLVD, Grades: PK-6)
- PRINCE DAVID KAWANANAKOA MIDDLE SCHOOL (Students: 868, Location: 49 FUNCHAL ST, Grades: 6-8)
- KAIMUKI MIDDLE SCHOOL (Students: 867, Location: 631 18TH AVE, Grades: 6-8)
- PRESIDENT GEORGE WASHINGTON MIDDLE SCHOOL (Students: 856, Location: 1633 SOUTH KING ST, Grades: 6-8)
- SALT LAKE ELEMENTARY SCHOOL (Students: 791, Location: 1131 ALA LILIKOI ST, Grades: PK-6)
- GOVERNOR SANFORD B DOLE MIDDLE SCHOOL (Students: 789, Location: 1803 KAM IV RD, Grades: 6-8)
- NIU VALLEY MIDDLE SCHOOL (Students: 783, Location: 310 HALEMAUMAU ST, Grades: 6-8)
- ALIAMANU MIDDLE SCHOOL (Students: 715, Location: 3271 SALT LAKE BLVD, Grades: 7-8)
Biggest private elementary/middle schools in Honolulu:
- HOLY FAMILY CATHOLIC ACADEMY (Students: 636, Location: 830 MAIN ST, Grades: PK-8)
- ST PATRICK SCHOOL (Students: 343, Location: 3320 HARDING AVE, Grades: PK-8)
- ST THERESA SCHOOL (Students: 342, Location: 712 N SCHOOL ST BLDG A, Grades: KG-8)
- HONGWANJI MISSION SCHOOL (Students: 324, Location: 1728 PALI HWY, Grades: PK-8)
- KAIMUKI CHRISTIAN SCHOOL (Students: 314, Location: 1117 KOKO HEAD AVE, Grades: PK-8)
- STAR OF THE SEA SCHOOL (Students: 229, Location: 4469 MALIA ST, Grades: 1-8)
- NAVY HALE KEIKI SCHOOL (Students: 211, Location: 153 BOUGAINVILLE DR, Grades: PK-4)
- HANAHAUOLI SCHOOL (Students: 208, Location: 1922 MAKIKI ST, Grades: UG-6)
- MONTESSORI COMMUNITY SCHOOL (Students: 196, Location: 1239 NEHOA ST, Grades: PK-6)
- ST JOHN THE BAPTIST CATHOLIC SCHOOL (Students: 168, Location: 2340 OMILO LN, Grades: PK-8)
User-submitted facts and corrections:
- Please correct our web site reference for International College and Graduate School. Our current, new URL is icgshawaii.org. Thanks.
- Aloha! Hi I wanted to update our company's information on your website. The name of our school is Med-Assist School of Hawaii. We have recently put up a new website. The new address is www.mash.edu
Points of interest:
Notable locations in Honolulu: Koko Marina (A), Pier Number 36 (B), Pier Number 38 (C), Pier Number 37 (D), Pier Number 39 (E), Pier Number 40 (F), Mamala Bay Golf Course (G), Navy-Marine Golf Course (H), Saint Louis Heights Pumping Station Number 1 (I), Saint Louis Heights Pumping Station Number 2 (J), Koko Crater Botanical Garden (K), Koko Crater Stables (L), Ala Wai Golf Course (M), Foster Botanic Garden (N), Waiakamilo Business Center (O), Hawai‘i Kai Golf Course (P), Waikiki Business Plaza (Q), Waikiki Yacht Club (R), Palama Settlement (S), Moanalua Golf Course (T). Display/hide their locations on the map
Shopping Centers: Koko Marina Shopping Center (1), McCully Shopping Center (2), Moanalua Shopping Center (3), Niu Valley Shopping Center (4), Nuuanu Shopping Plaza Shopping Center (5), Piolani Shopping Center (6), Royal Hawaiian Shopping Center (7), Salt Lake Shopping Center (8), Waiakamilo Shopping Plaza Shopping Center (9). Display/hide their locations on the map
Main business address in Honolulu include: ML MACADAMIA ORCHARDS L P (A), HAWAIIAN ELECTRIC CO INC (B), BANCWEST CORP/HI (C), HAWAIIAN HOLDINGS INC (D), CENTRAL PACIFIC FINANCIAL CORP (E), HAWAIIAN ELECTRIC INDUSTRIES INC (F), CB BANCSHARES INC/HI (G), BANK OF HAWAII CORP (H). Display/hide their locations on the map
Churches in Honolulu include: Iolani Chapel (A), Jael Presbyterian Church (B), Jikoen Hongwanji Temple (C), Jung Bup Sa Temple (D), Ka Hale Hoano Hou O Ke Akua Church (E), Co-Cathedral of Saint Theresa (F), Wesley United Methodist Church (G), Wesley Methodist Student Center (H), Hsu Yin Temple (I). Display/hide their locations on the map
Cemeteries: Kawaiahao Cemetery (1), Memorial Park Cemetery (2), O‘ahu Cemetery (3), Lin Yee Chung Society Chinese Cemetery (4), Makiki Cemetery (5), Tong Sing Tong Chinese Cemetery (6), Kauilani Portuguese Cemetery (7). Display/hide their locations on the map
Lakes and reservoirs: Kapena Pool (A), Kuapā Pond (B), Alapena Pool (C), Salt Lake (D), Kalihi Reservoir (E), Nu‘uanu Reservoir Number Two (F), Lily Pond (G), Nu‘uanu Reservoir Number Four (H). Display/hide their locations on the map
Streams, rivers, and creeks: Pauoa Stream (A), Wai‘alae Stream (B), Waihī Stream (C), Pālolo Stream (D), Makiki Stream (E), Waiakeakua Stream (F), Wa‘aloa Stream (G), Pūkele Stream (H), Nu‘uanu Stream (I). Display/hide their locations on the map
Parks in Honolulu include: Sandy Beach Park (1), Nehu Playground (2), Moliili Field (3), Hoaloha Park (4), Mother Waldron Playground (5), Honolulu Zoo (6), Fort Ruger Park (7), Wailupe Valley Neighborhood Park (8), Hawaii Kai Recreation Center (9). Display/hide their locations on the map
Beaches: Waikīkī Beach (A), Sans Souci Beach (B), Ke‘ehi Lagoon Beach (C), Royal-Moana Beach (D), Paikō Beach (E), Kaloko Beach (F), Niu Beach (G), Makapu‘u Beach (H), Kuilei Beach (I). Display/hide their locations on the map
Tourist attractions: Ramsay Museum (1128 Smith Street) (1), Mission Houses Museum (553 South King Street) (2), Hawaii Children's Museum (111 Ohe Street) (3), Honolulu Academy of Arts - Information (Museums; 900 South Beretania Street) (4), Hawaii Army Museum Society US Army Museum (Fort De Russy) (5), Iolani Palace (Museums; 364 S King St) (6), Academy of Arts Honolulu - Reception Administration (Museums; 900 south Beretainia St.) (7), Daughters of Hawaii - Queen Emma Summer Palace (Museums; 2913 Pali Highway) (8), The Contemporary Museum (2411 Makiki Heights Drive) (9). Display/hide their approximate locations on the map
Hotels: Kosuga Inc (1350 South King Street Suite 207) (1), Hawaiian Condo Resorts Inc (444 Hobron Lane Suite V2B) (2), Honolulu Airport Hotel (3401 North Nimitz Highway) (3), Hilton Grand Vacations Company (2003 Kalia Road) (4), Ambassador Hotel of Waikiki (2040 Kuhio Avenue Apt 325) (5), Sheraton Princess Kaiulani (120 Kaiulani Avenue) (6), Beachside Hostel (2556 Lemon Road) (7), Ohana Waikiki Tower (200 Lewers Street) (8), Aloha Discount Guide Hawaii (46-292 Kupale Street) (9). Display/hide their approximate locations on the map
Courts: Ali'I Court Cart Reporting (956 Uwao) (1), Hawaii State Government - Circuit Court Of The First Judicial Court Ka'Ah (777 Punchbowl Street) (2), Hawaii State Government - Courts-Office Of Deputy Chief Court- Juvenile Client Serv (587 Court Unit Volunteer) (3), National Park Service - Uss Arizona Memorial (1 Arizona Memorial Place) (4), Courts - Federal - Bankruptcy Court- Clerk's Office Information (1132 Bishop Street Suite 250L) (5), University Court Aoao (1914 University) (6), United States Government - Courts U S Bankruptcy Court- Judge Lloyd (1132 Bishop Street) (7), United States Government - Courts U S Court of Appeals- Ninth Circuit (Prince Kuhio Federal) (8), Courts-Federal - District Court- Clerk's Office Information (Prince Kuhio Fedl B) (9). Display/hide their approximate locations on the map
Birthplace of: Mr. Fuji - Professional wrestler, Jean Erdman - Choreographer, Sid Fernandez - Baseball player, Tadd Fujikawa - Professional golfer, Barack Obama - Politician, Chris Fuamatu-Maʻafala - Football player, Clarissa Chun - Sport wrestler, Steve Case - Billionaire, Ron Darling - Baseball player, Redmond Burke - Television personality.
Drinking water stations with addresses in Honolulu and their reported violations in the past:
HNL-WINDWARD-PEARL HARBOR (Address: 630 S. Beretania St., Rm. 308 , Population served: 676,358, Groundwater):Past health violations:WAIPAHU-EWA-WAIANAE (Address: 630 S. Beretania St., Rm. 308 , Population served: 188,539, Groundwater):Past monitoring violations:
- MCL, Acute (TCR) - In OCT-2013, Contaminant: Coliform. Follow-up actions: St Violation/Reminder Notice (OCT-18-2013), St Compliance achieved (OCT-19-2013), St Public Notif received (OCT-19-2013)
- 40 regular monitoring violations
Past monitoring violations:PUNAHOU SCHOOL (Address: 1601 Punahou Street , Population served: 4,000, Groundwater):
- 4 regular monitoring violations
Past health violations:KAHUKU (Address: 630 S. Beretania St., Rm. 308 , Population served: 3,426, Groundwater):Past monitoring violations:
- MCL, Monthly (TCR) - In JAN-2007, Contaminant: Coliform. Follow-up actions: St Public Notif requested (JAN-26-2007), St Violation/Reminder Notice (JAN-26-2007), St Public Notif received (FEB-06-2007)
- One minor monitoring violation
Past monitoring violations:SHERATON HOTELS (Address: 120 KAIULANI AVENUE , Population served: 2,830, Groundwater):
- Follow-up Or Routine LCR Tap M/R - In OCT-01-2010, Contaminant: Lead and Copper Rule. Follow-up actions: St Violation/Reminder Notice (OCT-31-2012), St Public Notif received (JAN-31-2013), St Compliance achieved (JUN-07-2013)
Past health violations:HOOLEHUA (Population served: 1,900, Groundwater):Past monitoring violations:
- MCL, Monthly (TCR) - In JUN-2005, Contaminant: Coliform. Follow-up actions: St Public Notif requested (AUG-26-2005), St Violation/Reminder Notice (AUG-26-2005), St Public Notif received (SEP-16-2005)
- 7 regular monitoring violations
Past monitoring violations:DILLINGHAM AIRFIELD (Address: 869 PUNCHBOWL STREET , Population served: 1,800, Groundwater):
- One routine major monitoring violation
Past health violations:MAUNALOA-KALUAKOI (Address: 1003 BISHOP STREET, SUITE 1170 , Population served: 1,000, Surface water):
- MCL, Monthly (TCR) - In AUG-2013, Contaminant: Coliform. Follow-up actions: St Violation/Reminder Notice (AUG-12-2013), St Public Notif received (SEP-06-2013), St Compliance achieved (SEP-30-2013)
- MCL, Monthly (TCR) - In NOV-2006, Contaminant: Coliform. Follow-up actions: St Public Notif requested (DEC-01-2006), St Violation/Reminder Notice (DEC-01-2006), St Public Notif received (DEC-19-2006)
- MCL, Monthly (TCR) - In FEB-2006, Contaminant: Coliform
Past health violations:Past monitoring violations:
- Treatment Technique (SWTR and GWR) - In JAN-2007. Follow-up actions: St Public Notif requested (FEB-21-2007), St Violation/Reminder Notice (FEB-21-2007), St Public Notif received (FEB-28-2007)
- MCL, Average - Between OCT-2005 and DEC-2005, Contaminant: TTHM. Follow-up actions: St Violation/Reminder Notice (NOV-10-2005), St Public Notif requested (NOV-10-2005), St Public Notif received (JAN-13-2006), St Compliance achieved (JAN-24-2006)
- Follow-up Or Routine LCR Tap M/R - In JAN-01-2007, Contaminant: Lead and Copper Rule. Follow-up actions: St Violation/Reminder Notice (OCT-15-2009), St Public Notif received (OCT-12-2010), St Compliance achieved (NOV-30-2010)
- Treatment Technique Precursor Removal - Between JUL-2005 and SEP-2005, Contaminant: CARBON, TOTAL. Follow-up actions: St Public Notif requested (NOV-03-2005), St Violation/Reminder Notice (NOV-03-2005), St Compliance achieved (SEP-11-2006)
- 2 regular monitoring violations
Drinking water stations with addresses in Honolulu that have no violations reported:
- MILILANI (Address: 630 S. Beretania St., Rm. 308 , Population served: 35,875, Primary Water Source Type: Groundwater)
- WAHIAWA (Address: 630 S. Beretania St., Rm. 308 , Population served: 24,798, Primary Water Source Type: Groundwater)
- WAIPIO HEIGHTS (Address: 630 S. Beretania St., Rm. 308 , Population served: 16,616, Primary Water Source Type: Groundwater)
- WAIALUA-HALEIWA (Address: 630 S. Beretania St., Rm. 308 , Population served: 13,447, Primary Water Source Type: Groundwater)
- WAIALEE-SUNSET BEACH (Address: 630 S. Beretania St., Rm. 308 , Population served: 4,341, Primary Water Source Type: Groundwater)
- KAMEHAMEHA SCHOOLS (Address: 1887 MAKUAKANE STREET , Population served: 4,000, Primary Water Source Type: Groundwater)
- THE QUEEN'S MEDICAL CENTER (Address: 1301 PUNCHBOWL STREET , Population served: 3,400, Primary Water Source Type: Groundwater)
- THE QUEEN'S MEDICAL CENTER WEST OAHU (Address: 1301 PUNCHBOWL STREET , Population served: 400, Primary Water Source Type: Purch groundwater)
- WAIAHOLE (Address: 677 QUEEN STREET, SUITE 300 , Population served: 300, Primary Water Source Type: Groundwater)
- KIPU (Address: 1003 BISHOP STREET, SUITE 1170 , Population served: 80, Primary Water Source Type: Purch groundwater)
| This place: | 2.6 people |
| Hawaii: | 2.9 people |
| This place: | 62.3% |
| Whole state: | 71.7% |
| This place: | 5.0% |
| Whole state: | 5.8% |
Likely homosexual households (counted as self-reported same-sex unmarried-partner households)
- Lesbian couples: 0.2% of all households
- Gay men: 0.3% of all households
| This place: | 11.8% |
| Whole state: | 10.7% |
| This place: | 5.9% |
| Whole state: | 5.0% |
People in group quarters in Honolulu in 2000:
- 2,984 people in college dormitories (includes college quarters off campus)
- 1,638 people in nursing homes
- 1,292 people in crews of maritime vessels
- 800 people in military barracks, etc.
- 776 people in other noninstitutional group quarters
- 742 people in state prisons
- 634 people in homes for the mentally ill
- 470 people in other nonhousehold living situations
- 384 people in other group homes
- 281 people in hospitals or wards for drug/alcohol abuse
- 254 people in homes or halfway houses for drug/alcohol abuse
- 192 people in religious group quarters
- 158 people in homes for the physically handicapped
- 158 people in other workers' dormitories
- 130 people in hospitals/wards and hospices for chronically ill
- 98 people in homes for the mentally retarded
- 96 people in other hospitals or wards for chronically ill
- 73 people in halfway houses
- 57 people in mental (psychiatric) hospitals or wards
- 52 people in wards in military hospitals for patients who have no usual home elsewhere
- 41 people in short-term care, detention or diagnostic centers for delinquent children
- 39 people in military transient quarters for temporary residents
- 34 people in hospices or homes for chronically ill
- 14 people in unknown juvenile institutions
- 11 people in orthopedic wards and institutions for the physically handicapped
- 8 people in agriculture workers' dormitories on farms
Banks with most branches in Honolulu (2011 data):
- First Hawaiian Bank: 21 branches. Info updated 2012/02/02: Bank assets: $15,830.2 mil, Deposits: $12,165.6 mil, local headquarters, positive income, 59 total offices, Holding Company: Bnp Paribas
- American Savings Bank, FSB: 21 branches. Info updated 2012/01/09: Bank assets: $4,910.1 mil, Deposits: $4,107.0 mil, local headquarters, positive income, Mortgage Lending Specialization, 57 total offices
- Bank of Hawaii: 17 branches. Info updated 2010/09/12: Bank assets: $13,868.5 mil, Deposits: $10,599.9 mil, local headquarters, positive income, Mortgage Lending Specialization, 71 total offices, Holding Company: Bank Of Hawaii Corporation
- Central Pacific Bank: 17 branches. Info updated 2010/08/20: Bank assets: $4,134.6 mil, Deposits: $3,489.2 mil, local headquarters, positive income, Commercial Lending Specialization, 34 total offices, Holding Company: Central Pacific Financial Corp.
- Territorial Savings Bank: 13 branches. Info updated 2011/07/21: Bank assets: $1,537.6 mil, Deposits: $1,189.2 mil, local headquarters, positive income, Mortgage Lending Specialization, 27 total offices
- Hawaii National Bank: 8 branches. Info updated 2006/11/03: Bank assets: $618.2 mil, Deposits: $563.8 mil, local headquarters, positive income, Commercial Lending Specialization, 14 total offices, Holding Company: Hawaii National Bancshares, Inc.
- Finance Factors, Ltd.: 8 branches. Info updated 2006/11/03: Bank assets: $488.1 mil, Deposits: $408.1 mil, local headquarters, negative income in the last year, Commercial Lending Specialization, 14 total offices
- Bank of the Orient: Manoa Branch, Bishop Street Branch, Maunakea Branch. Info updated 2011/09/30: Bank assets: $576.8 mil, Deposits: $477.2 mil, headquarters in San Francisco, CA, negative income in the last year, Commercial Lending Specialization, 10 total offices, Holding Company: Orient Bancorporation
- Pacific Rim Bank: at 500 Ala Moana Boulevard, Suite 2a, branch established on 2006/02/27. Info updated 2010/02/16: Bank assets: $132.7 mil, Deposits: $123.8 mil, local headquarters, positive income, Commercial Lending Specialization, 1 total offices
- 2 other banks with 2 local branches
For population 15 years and over in Honolulu:
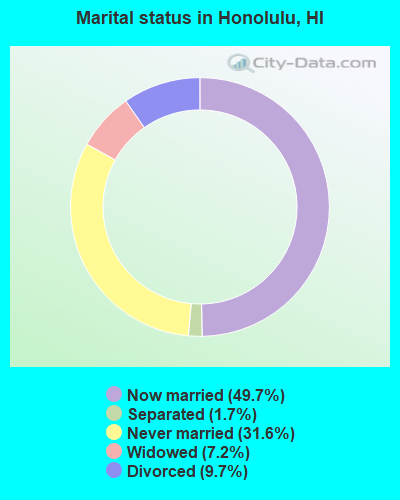
- Never married: 31.6%
- Now married: 49.7%
- Separated: 1.7%
- Widowed: 7.2%
- Divorced: 9.7%
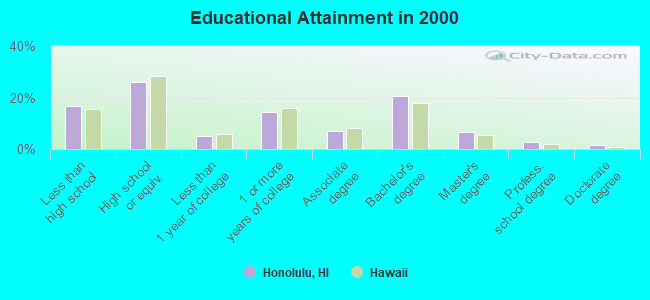
For population 25 years and over in Honolulu:
- High school or higher: 83.4%
- Bachelor's degree or higher: 31.1%
- Graduate or professional degree: 10.7%
- Unemployed: 5.9%
- Mean travel time to work (commute): 23.1 minutes
| Here: | 14.2 |
| Hawaii average: | 12.8 |
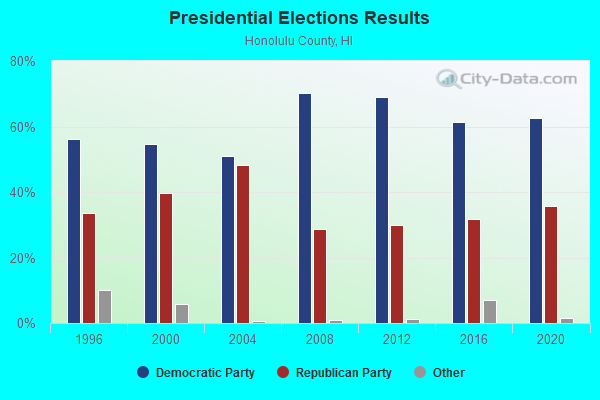
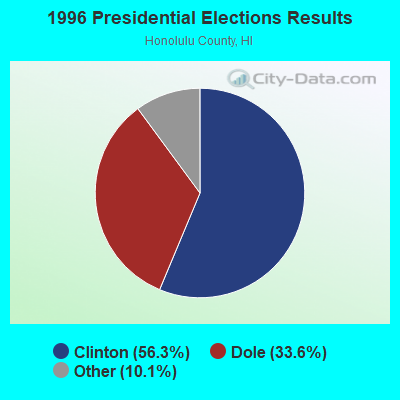
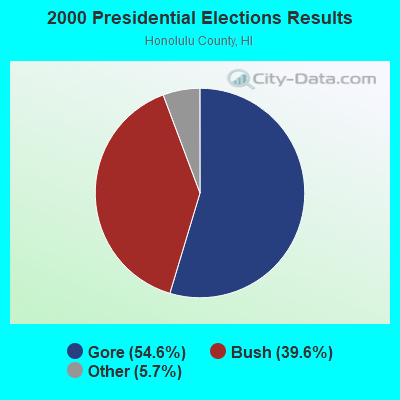
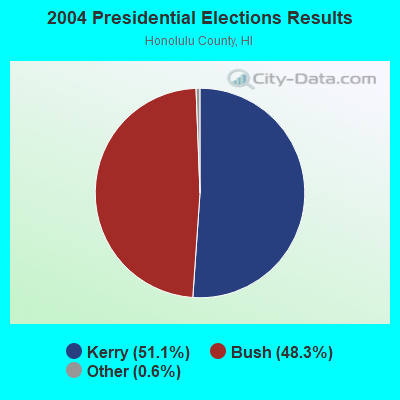
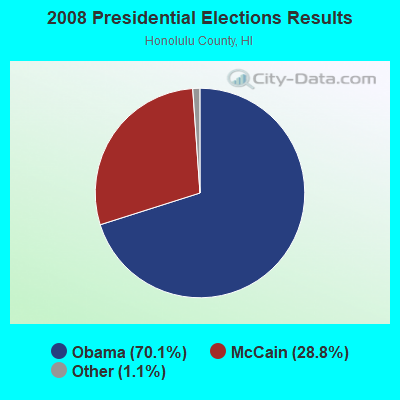
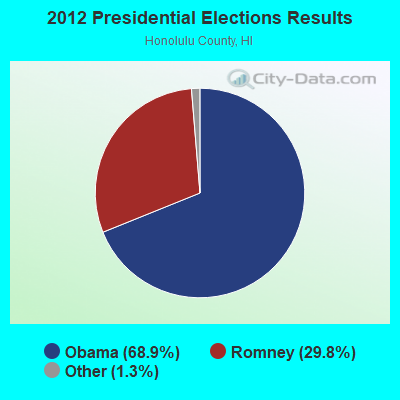
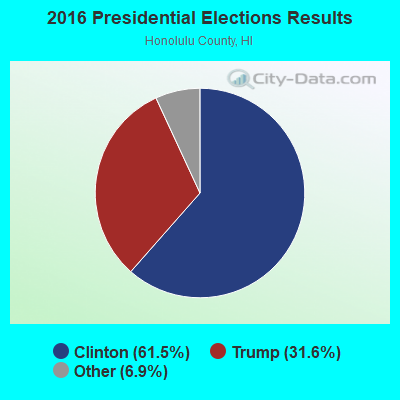
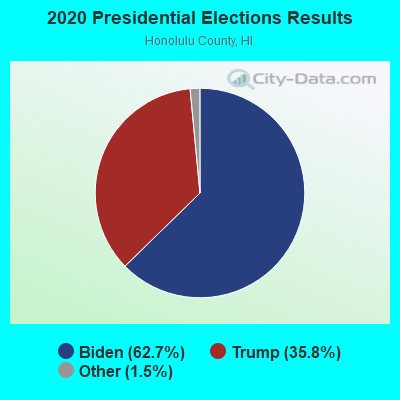
Graphs represent county-level data. Detailed 2008 Election Results
Neighborhoods in Honolulu:
(Honolulu, Hawaii Neighborhood Map)- Airport neighborhood
- Ala Moana neighborhood
- Aliamanu (Foster Village-Salt Lake) neighborhood
- Capitol District neighborhood
- Chinatown neighborhood
- Diamond Head neighborhood
- Downtown neighborhood
- Financial District neighborhood
- Hawaii Kai neighborhood
- Honolulu Ahupua'a neighborhood
- Kahauiki Ahupua'a neighborhood
- Kaimuki neighborhood
- Kakaako neighborhood
- Kalihi Ahupua'a neighborhood
- Kalihi Valley neighborhood
- Kalihi-palama neighborhood
- Kapahulu neighborhood
- Kapalama Ahupua'a neighborhood
- Kapiolani (Mccully-Moiliili) neighborhood
- Kuli'ou'ou Homesteads neighborhood
- Kuliouou (Kalani Iki) neighborhood
- Liliha-alewa neighborhood
- Lower Punchbowl neighborhood
- Makiki neighborhood
- Manoa neighborhood
- Moanalua neighborhood
- Moanalua Ahupua'a neighborhood
- Nuuanu-Punchbowl neighborhood
- Palolo neighborhood
- Palolo Homesteads neighborhood
- St. Louis Heights neighborhood
- Tantalus neighborhood
- Waialae-Kahala neighborhood
- Waikiki neighborhood
- Waikiki Ahupua'a neighborhood
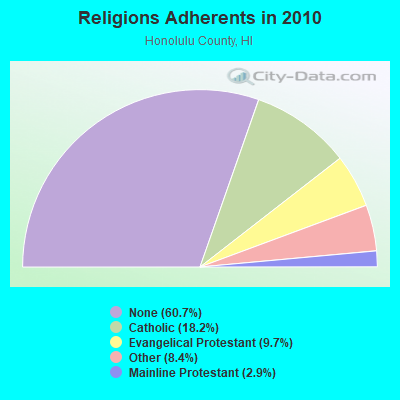
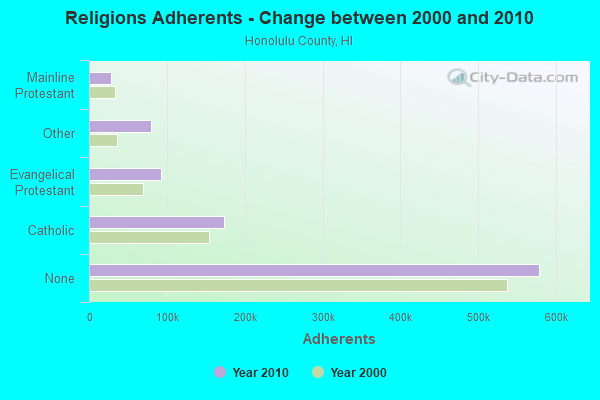
Religion statistics for Honolulu, HI (based on Honolulu County data)
| Religion | Adherents | Congregations |
|---|---|---|
| Catholic | 173,716 | 39 |
| Evangelical Protestant | 92,310 | 382 |
| Other | 80,221 | 204 |
| Mainline Protestant | 28,013 | 115 |
| Orthodox | 300 | 4 |
| None | 578,647 | - |
Food Environment Statistics:
| This county: | 2.17 / 10,000 pop. |
| State: | 2.30 / 10,000 pop. |
| Honolulu County: | 0.10 / 10,000 pop. |
| Hawaii: | 0.09 / 10,000 pop. |
| Honolulu County: | 1.40 / 10,000 pop. |
| Hawaii: | 1.57 / 10,000 pop. |
| Honolulu County: | 1.57 / 10,000 pop. |
| Hawaii: | 1.72 / 10,000 pop. |
| This county: | 8.15 / 10,000 pop. |
| Hawaii: | 9.00 / 10,000 pop. |
| This county: | 8.3% |
| Hawaii: | 8.1% |
| Honolulu County: | 20.5% |
| Hawaii: | 20.8% |
| Honolulu County: | 8.9% |
| Hawaii: | 9.2% |
| Local government employment and payroll (March 2022) | |||||
| Function | Full-time employees | Monthly full-time payroll | Average yearly full-time wage | Part-time employees | Monthly part-time payroll |
|---|---|---|---|---|---|
| Police Protection - Officers | 2,461 | $21,126,602 | $103,015 | 4 | $2,133 |
| Parks and Recreation | 1,261 | $4,101,462 | $39,031 | 975 | $366,318 |
| Firefighters | 1,102 | $9,348,994 | $101,804 | 0 | $0 |
| Other and Unallocable | 704 | $3,768,346 | $64,233 | 0 | $0 |
| Financial Administration | 700 | $3,867,658 | $66,303 | 17 | $17,101 |
| Other Government Administration | 668 | $4,021,254 | $72,238 | 167 | $55,263 |
| Police - Other | 648 | $2,993,892 | $55,442 | 33 | $11,372 |
| Water Supply | 569 | $3,422,614 | $72,182 | 0 | $0 |
| Sewerage | 502 | $3,318,844 | $79,335 | 2 | $956 |
| Streets and Highways | 411 | $1,706,552 | $49,826 | 8 | $4,918 |
| Judicial and Legal | 349 | $2,424,102 | $83,350 | 14 | $36,418 |
| Solid Waste Management | 334 | $2,212,564 | $79,493 | 0 | $0 |
| Housing and Community Development (Local) | 280 | $1,537,404 | $65,889 | 6 | $4,433 |
| Health | 272 | $1,913,602 | $84,424 | 0 | $0 |
| Natural Resources | 207 | $771,440 | $44,721 | 46 | $108,181 |
| Transit | 155 | $684,322 | $52,980 | 4 | $95 |
| Fire - Other | 70 | $342,859 | $58,776 | 6 | $17,067 |
| Local Libraries | 4 | $12,858 | $38,574 | 0 | $0 |
| Totals for Government | 10,697 | $67,575,369 | $75,807 | 1,282 | $624,255 |
Honolulu government finances - Expenditure in 2021 (per resident):
- Construction - Transit Utilities: $422,747,000 ($1128.22)
Sewerage: $315,540,000 ($842.11)
Water Utilities: $112,465,000 ($300.15)
Regular Highways: $53,324,000 ($142.31)
Parks and Recreation: $38,026,000 ($101.48)
Housing and Community Development: $37,480,000 ($100.03)
Solid Waste Management: $27,043,000 ($72.17)
General - Other: $10,242,000 ($27.33)
General Public Buildings: $5,752,000 ($15.35)
Local Fire Protection: $4,316,000 ($11.52)
Police Protection: $3,724,000 ($9.94)
Natural Resources - Other: $3,379,000 ($9.02)
Parking Facilities: $3,345,000 ($8.93)
Public Welfare - Other: $418,000 ($1.12)
Central Staff Services: $12,000 ($0.03)
- Current Operations - General - Other: $360,554,000 ($962.24)
Police Protection: $321,931,000 ($859.17)
Transit Utilities: $274,184,000 ($731.74)
Central Staff Services: $253,839,000 ($677.44)
Water Utilities: $176,340,000 ($470.62)
Solid Waste Management: $172,200,000 ($459.57)
Local Fire Protection: $141,053,000 ($376.44)
Sewerage: $134,446,000 ($358.81)
Parks and Recreation: $108,387,000 ($289.26)
Housing and Community Development: $82,504,000 ($220.19)
Regular Highways: $58,203,000 ($155.33)
Financial Administration: $47,411,000 ($126.53)
Health - Other: $39,853,000 ($106.36)
Judicial and Legal Services: $32,651,000 ($87.14)
General Public Buildings: $31,214,000 ($83.30)
Public Welfare - Other: $9,048,000 ($24.15)
Protective Inspection and Regulation - Other: $4,522,000 ($12.07)
Natural Resources - Other: $2,463,000 ($6.57)
- General - Interest on Debt: $234,237,000 ($625.13)
- Intergovernmental to Local - Other - Water Utilities: $3,300,000 ($8.81)
- Other Capital Outlay - Regular Highways: $27,174,000 ($72.52)
Transit Utilities: $18,545,000 ($49.49)
Housing and Community Development: $18,046,000 ($48.16)
Police Protection: $9,132,000 ($24.37)
General - Other: $7,770,000 ($20.74)
Local Fire Protection: $7,594,000 ($20.27)
Solid Waste Management: $7,522,000 ($20.07)
Sewerage: $6,546,000 ($17.47)
Water Utilities: $5,306,000 ($14.16)
Parks and Recreation: $4,567,000 ($12.19)
Health - Other: $1,816,000 ($4.85)
General Public Building: $1,545,000 ($4.12)
Protective Inspection and Regulation - Other: $236,000 ($0.63)
Public Welfare - Other: $110,000 ($0.29)
Financial Administration: $63,000 ($0.17)
Judicial and Legal Services: $37,000 ($0.10)
Central Staff Services: $10,000 ($0.03)
- Total Salaries and Wages: $40,623,000 ($108.41)
- Transit Utilities - Interest on Debt: $32,897,000 ($87.80)
- Water Utilities - Interest on Debt: $10,243,000 ($27.34)
Honolulu government finances - Revenue in 2021 (per resident):
- Charges - Sewerage: $457,347,000 ($1220.57)
Solid Waste Management: $125,778,000 ($335.68)
Parks and Recreation: $16,403,000 ($43.78)
Housing and Community Development: $11,045,000 ($29.48)
Parking Facilities: $6,145,000 ($16.40)
Other: $5,322,000 ($14.20)
Regular Highways: $4,721,000 ($12.60)
- Federal Intergovernmental - Health and Hospitals: $282,184,000 ($753.09)
Transit Utilities: $111,608,000 ($297.86)
Housing and Community Development: $86,169,000 ($229.97)
Other: $6,519,000 ($17.40)
Public Welfare: $53,000 ($0.14)
- Local Intergovernmental - Water Utilities: $2,669,000 ($7.12)
Other: $435,000 ($1.16)
- Miscellaneous - General Revenue - Other: $76,673,000 ($204.62)
Interest Earnings: $20,090,000 ($53.62)
Donations From Private Sources: $1,265,000 ($3.38)
Fines and Forfeits: $1,008,000 ($2.69)
Rents: $521,000 ($1.39)
Sale of Property: $315,000 ($0.84)
- Revenue - Water Utilities: $238,558,000 ($636.66)
Transit Utilities: $27,203,000 ($72.60)
- State Intergovernmental - Other: $74,645,000 ($199.21)
Health and Hospitals: $45,695,000 ($121.95)
Transit Utilities: $9,412,000 ($25.12)
Highways: $8,568,000 ($22.87)
Housing and Community Development: $1,589,000 ($4.24)
Water Utilities: $1,230,000 ($3.28)
Public Welfare: $840,000 ($2.24)
General Local Government Support: $59,000 ($0.16)
- Tax - Property: $1,437,600,000 ($3836.66)
General Sales and Gross Receipts: $261,852,000 ($698.83)
Motor Vehicle License: $210,871,000 ($562.77)
Public Utilities Sales: $82,221,000 ($219.43)
Motor Fuels Sales: $41,226,000 ($110.02)
Other License: $24,049,000 ($64.18)
Alcoholic Beverage License: $5,619,000 ($15.00)
Motor Vehicle Operators License: $4,708,000 ($12.56)
Occupation and Business License - Other: $49,000 ($0.13)
Honolulu government finances - Debt in 2021 (per resident):
- Long Term Debt - Outstanding Unspecified Public Purpose: $6,939,504,000 ($18520.11)
Beginning Outstanding - Unspecified Public Purpose: $6,587,227,000 ($17579.96)
Issue, Unspecified Public Purpose: $1,065,442,000 ($2843.45)
Retired Unspecified Public Purpose: $713,165,000 ($1903.29)
Honolulu government finances - Cash and Securities in 2021 (per resident):
- Bond Funds - Cash and Securities: $179,719,000 ($479.63)
- Other Funds - Cash and Securities: $3,019,022,000 ($8057.15)
- Sinking Funds - Cash and Securities: $293,166,000 ($782.40)
4.80% of this county's 2021 resident taxpayers lived in other counties in 2020 ($72,704 average adjusted gross income)
| Here: | 4.80% |
| Hawaii average: | 4.91% |
0.27% of residents moved from foreign countries ($4,064 average AGI)
Honolulu County: 0.27% Hawaii average: 0.19%
Top counties from which taxpayers relocated into this county between 2020 and 2021:
| from San Diego County, CA | |
| from Los Angeles County, CA | |
| from Hawaii County, HI |
5.90% of this county's 2020 resident taxpayers moved to other counties in 2021 ($71,643 average adjusted gross income)
| Here: | 5.90% |
| Hawaii average: | 5.53% |
0.21% of residents moved to foreign countries ($2,928 average AGI)
Honolulu County: 0.21% Hawaii average: 0.15%
Top counties to which taxpayers relocated from this county between 2020 and 2021:
| to Clark County, NV | |
| to San Diego County, CA | |
| to Hawaii County, HI |
| Businesses in Honolulu, HI | ||||
| Name | Count | Name | Count | |
|---|---|---|---|---|
| 24 Hour Fitness | 4 | IHOP | 2 | |
| 7-Eleven | 19 | J.Crew | 1 | |
| ALDO | 3 | Jack In The Box | 11 | |
| AT&T | 7 | Jamba Juice | 11 | |
| Abercrombie & Fitch | 1 | Jimmy Jazz | 1 | |
| Abercrombie Kids | 1 | Jones New York | 6 | |
| Ace Hardware | 1 | Journeys | 1 | |
| Aeropostale | 2 | Juicy Couture | 2 | |
| American Eagle Outfitters | 1 | Kmart | 2 | |
| Ann Taylor | 1 | LensCrafters | 2 | |
| Apple Store | 3 | Little Caesars Pizza | 2 | |
| Arby's | 3 | Macy's | 5 | |
| Ashley Furniture | 2 | Marriott | 2 | |
| Audi | 1 | Mazda | 2 | |
| BMW | 1 | McDonald's | 24 | |
| Barnes & Noble | 2 | New Balance | 9 | |
| Baskin-Robbins | 6 | Nike | 42 | |
| Bath & Body Works | 1 | Nissan | 1 | |
| Bebe | 2 | Nordstrom | 2 | |
| Bentleymotors.Com | 1 | Office Depot | 2 | |
| Best Western | 2 | OfficeMax | 2 | |
| Blockbuster | 4 | Outback | 2 | |
| Brookstone | 1 | Outback Steakhouse | 2 | |
| Buffalo Wild Wings | 1 | Pac Sun | 1 | |
| Burger King | 10 | Panda Express | 7 | |
| CVS | 13 | Papa John's Pizza | 6 | |
| Cache | 1 | Payless | 5 | |
| Carl\s Jr. | 1 | Penske | 1 | |
| Chevrolet | 2 | Pier 1 Imports | 1 | |
| Chuck E. Cheese's | 1 | Pizza Hut | 6 | |
| Cinnabon | 3 | Popeyes | 5 | |
| Circle K | 2 | Red Lobster | 1 | |
| Clarks | 1 | SAS Shoes | 5 | |
| ColorTyme | 2 | Safeway | 6 | |
| Curves | 5 | Sam's Club | 1 | |
| DHL | 10 | Sears | 6 | |
| Dairy Queen | 4 | Sephora | 2 | |
| Dennys | 2 | Sheraton | 2 | |
| Domino's Pizza | 3 | Skechers USA | 1 | |
| Express | 1 | Sprint Nextel | 3 | |
| Famous Footwear | 1 | Starbucks | 34 | |
| FedEx | 40 | Subway | 44 | |
| Firestone Complete Auto Care | 2 | Target | 1 | |
| Foot Locker | 2 | The Cheesecake Factory | 1 | |
| Ford | 1 | True Value | 1 | |
| Forever 21 | 2 | U-Haul | 5 | |
| GNC | 6 | UPS | 39 | |
| Goodwill | 4 | Vans | 11 | |
| Gymboree | 2 | Verizon Wireless | 5 | |
| Haagen-Dazs | 3 | Victoria's Secret | 1 | |
| Haworth | 1 | Volkswagen | 1 | |
| Hilton | 7 | Vons | 6 | |
| Holiday Inn | 1 | Walgreens | 2 | |
| Hollister Co. | 1 | Walmart | 1 | |
| Home Depot | 1 | Wendy's | 1 | |
| Honda | 1 | Westin | 1 | |
| Hot Topic | 1 | Whole Foods Market | 1 | |
| Hyatt | 2 | YMCA | 7 | |
Strongest AM radio stations in Honolulu:
- KORL (690 AM; 10 kW; HONOLULU, HI; Owner: NEW WAVE BROADCASTING, L.P.)
- KGU (760 AM; 10 kW; HONOLULU, HI; Owner: SALEM MEDIA OF HAWAII, INC.)
- KSSK (590 AM; 8 kW; HONOLULU, HI; Owner: CAPSTAR TX LIMITED PARTNERSHIP)
- KHVH (830 AM; 10 kW; HONOLULU, HI; Owner: CAPSTAR TX LIMITED PARTNERSHIP)
- KWAI (1080 AM; 5 kW; HONOLULU, HI; Owner: RADIO HAWAII, INC.)
- KHBZ (990 AM; 5 kW; HONOLULU, HI; Owner: CAPSTAR TX LIMITED PARTNERSHIP)
- KLHT (1040 AM; 10 kW; HONOLULU, HI; Owner: CALVARY CHAPEL OF HONOLULU, INC.)
- KUMU (1500 AM; 10 kW; HONOLULU, HI; Owner: MAVERICK MEDIA OF OAHU LICENSE LLC)
- KHRA (1460 AM; 5 kW; HONOLULU, HI; Owner: TRADE CENTER MANAGEMENT, INC.)
- KNDI (1270 AM; 5 kW; HONOLULU, HI; Owner: BROADCAST HOUSE OF THE PACIFIC INC.)
- KKEA (1420 AM; 5 kW; HONOLULU, HI; Owner: BLOW UP, LLC)
- KREA (1540 AM; 5 kW; HONOLULU, HI; Owner: JMK COMMUNICATIONS,INC.)
- KZOO (1210 AM; 1 kW; HONOLULU, HI; Owner: POLYNESIAN BROADCASTING, INC.)
Strongest FM radio stations in Honolulu:
- KHUI (99.5 FM; HONOLULU, HI; Owner: NEW WAVE BROADCASTING, L.P.)
- KXME (104.3 FM; KANEOHE, HI; Owner: CXR HOLDINGS, INC.)
- KRTR-FM (96.3 FM; KAILUA, HI; Owner: CXR HOLDINGS, INC.)
- KTUH (90.3 FM; HONOLULU, HI; Owner: THE UNIVERSITY OF HAWAII)
- K215EH (90.9 FM; KAILUA, HI; Owner: CALVARY CHAPEL OF TWIN FALLS, INC.)
- KAIM-FM (95.5 FM; HONOLULU, HI; Owner: SALEM MEDIA OF HAWAII, INC.)
- KAHA (105.9 FM; HONOLULU, HI; Owner: KASA MOKU KA PAWA BROADCASTING, INC.)
- KCCN-FM (100.3 FM; HONOLULU, HI; Owner: CXR HOLDINGS, INC.)
- KGMZ-FM (107.9 FM; AIEA, HI; Owner: HONOLULU BROADCASTING, INC.)
- KINE-FM (105.1 FM; HONOLULU, HI; Owner: CXR HOLDINGS, INC.)
- KUCD (101.9 FM; PEARL CITY, HI; Owner: CAPSTAR TX LIMITED PARTNERSHIP)
- KSSK-FM (92.3 FM; WAIPAHU, HI; Owner: CAPSTAR TX LIMITED PARTNERSHIP)
- KIPO (89.3 FM; HONOLULU, HI; Owner: HAWAII PUBLIC RADIO)
- KDDB (102.7 FM; WAIPAHU, HI; Owner: NEW WAVE BROADCASTING, L.P.)
- KPOI-FM (97.5 FM; HONOLULU, HI; Owner: NEW WAVE BROADCASTING, L.P.)
- KQMQ-FM (93.1 FM; HONOLULU, HI; Owner: NEW WAVE BROADCASTING, L.P.)
- KUMU-FM (94.7 FM; HONOLULU, HI; Owner: MAVERICK MEDIA OF OAHU LICENSE LLC)
- KDNN (98.5 FM; HONOLULU, HI; Owner: CAPSTAR TX LIMITED PARTNERSHIP)
- K216FI (91.1 FM; HONOLULU, HI; Owner: CALVARY CHAPEL OF TWIN FALLS, INC.)
- KIKI-FM (93.9 FM; HONOLULU, HI; Owner: CAPSTAR TX LIMITED PARTNERSHIP)
TV broadcast stations around Honolulu:
- KHON-TV (Channel 2; HONOLULU, HI; Owner: EMMIS TELEVISION LICENSE CORPORATION)
- KGMB (Channel 9; HONOLULU, HI; Owner: EMMIS TELEVISION LICENSE CORPORATION)
- KITV (Channel 4; HONOLULU, HI; Owner: KITV HEARST-ARGYLE TV, INC. (CA CORP.))
- KHET (Channel 11; HONOLULU, HI; Owner: HAWAII PUBLIC TELEVISION FOUNDATION)
- KHNL (Channel 13; HONOLULU, HI; Owner: RAYCOM NATIONAL, INC.)
- KBFD (Channel 32; HONOLULU, HI; Owner: THE ALLEN BROADCASTING CORP.)
- KFVE (Channel 5; HONOLULU, HI; Owner: RAYCOM NATIONAL, INC.)
- K42CO (Channel 42; HONOLULU, HI; Owner: OCEANIA BROADCASTING NETWORK, INC.)
- KPXO (Channel 66; KANEOHE, HI; Owner: PAXSON HAWAII LICENSE, INC.)
- KWHE (Channel 14; HONOLULU, HI; Owner: LESEA BROADCASTING CORPORATION)
- KIKU (Channel 20; HONOLULU, HI; Owner: KHLS, INC.)
- KHLU-LP (Channel 60; HONOLULU, HI; Owner: HTV/HTN/HAWAIIAN TV NETWORK, LTD.)
- K44DQ (Channel 44; KANEOHE, HI; Owner: RAYCOM NATIONAL, INC.)
Medal of Honor Recipients
Medal of Honor Recipient born in Honolulu: Elmelindo R. Smith.
- National Bridge Inventory (NBI) Statistics
- 272Number of bridges
- 10,568ft / 3,221mTotal length
- $321,621,000Total costs
- 10,823,407Total average daily traffic
- 246,945Total average daily truck traffic
- 15,040,192Total future (year 2023) average daily traffic
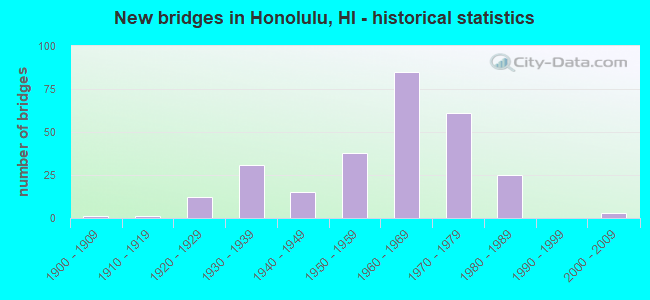
- New bridges - historical statistics
- 11900-1909
- 11910-1919
- 121920-1929
- 311930-1939
- 151940-1949
- 381950-1959
- 851960-1969
- 611970-1979
- 251980-1989
- 32000-2009
FCC Registered Antenna Towers: 690 (See the full list of FCC Registered Antenna Towers)
FCC Registered Commercial Land Mobile Towers: 27 (See the full list of FCC Registered Commercial Land Mobile Towers in Honolulu, HI)
FCC Registered Private Land Mobile Towers: 35 (See the full list of FCC Registered Private Land Mobile Towers)
FCC Registered Broadcast Land Mobile Towers: 439 (See the full list of FCC Registered Broadcast Land Mobile Towers)
FCC Registered Microwave Towers: 533 (See the full list of FCC Registered Microwave Towers in this town)
FCC Registered Paging Towers: 53 (See the full list of FCC Registered Paging Towers)
FCC Registered Maritime Coast & Aviation Ground Towers: 131 (See the full list of FCC Registered Maritime Coast & Aviation Ground Towers)
FCC Registered Amateur Radio Licenses: 2,281 (See the full list of FCC Registered Amateur Radio Licenses in Honolulu)
FAA Registered Aircraft Manufacturers and Dealers: 7 (See the full list of FAA Registered Manufacturers and Dealers in Honolulu)
FAA Registered Aircraft: 343 (See the full list of FAA Registered Aircraft)
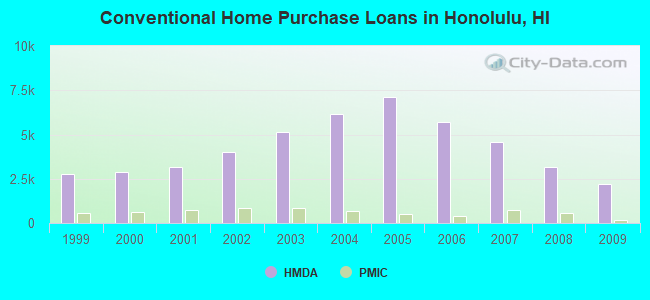
| Home Mortgage Disclosure Act Aggregated Statistics For Year 2009 (Based on 101 full and 1 partial tracts) | ||||||||||||||
| A) FHA, FSA/RHS & VA Home Purchase Loans | B) Conventional Home Purchase Loans | C) Refinancings | D) Home Improvement Loans | E) Loans on Dwellings For 5+ Families | F) Non-occupant Loans on < 5 Family Dwellings (A B C & D) | G) Loans On Manufactured Home Dwelling (A B C & D) | ||||||||
|---|---|---|---|---|---|---|---|---|---|---|---|---|---|---|
| Number | Average Value | Number | Average Value | Number | Average Value | Number | Average Value | Number | Average Value | Number | Average Value | Number | Average Value | |
| LOANS ORIGINATED | 305 | $396,404 | 2,213 | $351,772 | 7,349 | $361,703 | 475 | $334,776 | 31 | $1,695,548 | 1,192 | $311,173 | 0 | $0 |
| APPLICATIONS APPROVED, NOT ACCEPTED | 23 | $427,463 | 132 | $370,154 | 766 | $389,131 | 29 | $350,258 | 1 | $2,875,000 | 132 | $315,114 | 0 | $0 |
| APPLICATIONS DENIED | 44 | $394,023 | 258 | $404,285 | 1,746 | $399,616 | 86 | $258,303 | 4 | $533,750 | 431 | $347,953 | 0 | $0 |
| APPLICATIONS WITHDRAWN | 45 | $442,062 | 293 | $423,045 | 1,179 | $382,040 | 60 | $359,067 | 4 | $639,668 | 246 | $347,110 | 1 | $450,000 |
| FILES CLOSED FOR INCOMPLETENESS | 6 | $518,000 | 17 | $856,843 | 177 | $407,064 | 6 | $203,500 | 0 | $0 | 39 | $443,436 | 1 | $12,000 |
Detailed mortgage data for all 105 tracts in Honolulu, HI
| Private Mortgage Insurance Companies Aggregated Statistics For Year 2009 (Based on 59 full and 1 partial tracts) | ||||||
| A) Conventional Home Purchase Loans | B) Refinancings | C) Non-occupant Loans on < 5 Family Dwellings (A & B) | ||||
|---|---|---|---|---|---|---|
| Number | Average Value | Number | Average Value | Number | Average Value | |
| LOANS ORIGINATED | 152 | $336,934 | 51 | $345,784 | 16 | $282,688 |
| APPLICATIONS APPROVED, NOT ACCEPTED | 42 | $344,119 | 30 | $377,600 | 5 | $254,600 |
| APPLICATIONS DENIED | 20 | $369,885 | 21 | $447,830 | 1 | $214,000 |
| APPLICATIONS WITHDRAWN | 8 | $313,000 | 18 | $377,023 | 2 | $391,000 |
| FILES CLOSED FOR INCOMPLETENESS | 2 | $328,000 | 3 | $430,000 | 0 | $0 |
2003 - 2018 National Fire Incident Reporting System (NFIRS) incidents
- Fire incident types reported to NFIRS in Honolulu, HI
- 5,36147.5%Outside Fires
- 4,12936.6%Structure Fires
- 1,77515.7%Mobile Property/Vehicle Fires
- 240.2%Other
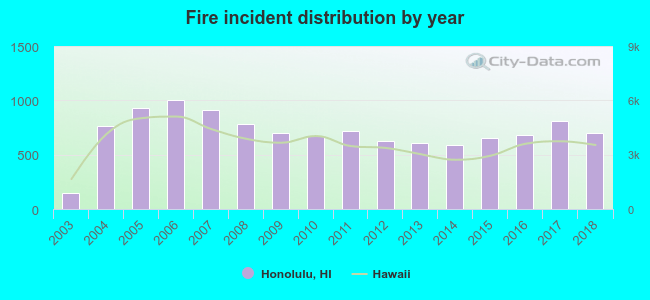 Based on the data from the years 2003 - 2018 the average number of fire incidents per year is 706. The highest number of reported fire incidents - 1,001 took place in 2006, and the least - 150 in 2003. The data has a rising trend.
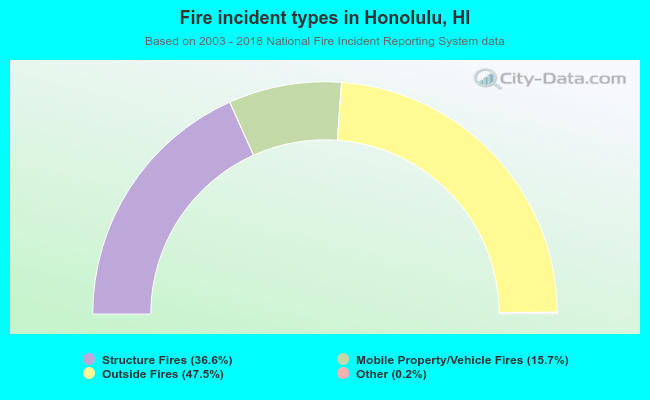 When looking into fire subcategories, the most reports belonged to: Outside Fires (47.5%), and Structure Fires (36.6%).
Fire-safe hotels and motels in Honolulu, Hawaii:
- Ramada Plaza Waikiki, 1830 Ala Moana Blvd, Honolulu, Hawaii 96815 , Phone: (808) 955-1111, Fax: (808) 945-2814
- Hawaii Prince Hotel Waikiki And Golf Club, 100 Holomoana Blvd, Honolulu, Hawaii 96815 , Phone: (808) 956-1111, Fax: (808) 946-0811
- Aston Waikiki Beach Hotel, 2570 Kalakaua Ave, Honolulu, Hawaii 96815 , Phone: (808) 922-2511, Fax: (808) 921-6270
- Outrigger Islander Waikiki, 270 Lewers St, Honolulu, Hawaii 96815 , Phone: (800) 688-7444, Fax: (800) 622-4852
- Ilima Hotel, 445 Nohonani St, Honolulu, Hawaii 96815 , Phone: (800) 801-9366, Fax: (888) 864-5462
- Imperial Hawaii Resort, 205 Lewers St, Honolulu, Hawaii 96815 , Phone: (808) 347-2582, Fax: (808) 922-1998
- The Kahala Hotel & Resort, 5000 Kahala Ave, Honolulu, Hawaii 96816 , Phone: (808) 739-8888, Fax: (808) 737-2478
- Hilton Waikiki Beach, 2500 Kuhio Ave, Honolulu, Hawaii 96815 , Phone: (808) 922-0811, Fax: (808) 921-5550
- 55 other hotels and motels
| Most common first names in Honolulu, HI among deceased individuals | ||
| Name | Count | Lived (average) |
|---|---|---|
| John | 1,453 | 74.0 years |
| James | 1,199 | 73.2 years |
| William | 1,180 | 73.4 years |
| Robert | 1,145 | 72.9 years |
| George | 1,138 | 74.9 years |
| Mary | 1,103 | 79.9 years |
| Richard | 866 | 73.5 years |
| Charles | 851 | 73.9 years |
| Joseph | 802 | 73.6 years |
| Henry | 695 | 75.7 years |
| Most common last names in Honolulu, HI among deceased individuals | ||
| Last name | Count | Lived (average) |
|---|---|---|
| Lee | 1,060 | 78.3 years |
| Wong | 887 | 79.1 years |
| Chang | 571 | 78.5 years |
| Young | 552 | 77.8 years |
| Ching | 537 | 79.8 years |
| Chun | 521 | 80.1 years |
| Lum | 480 | 79.5 years |
| Kim | 460 | 77.8 years |
| Nakamura | 401 | 79.1 years |
| Lau | 365 | 78.8 years |
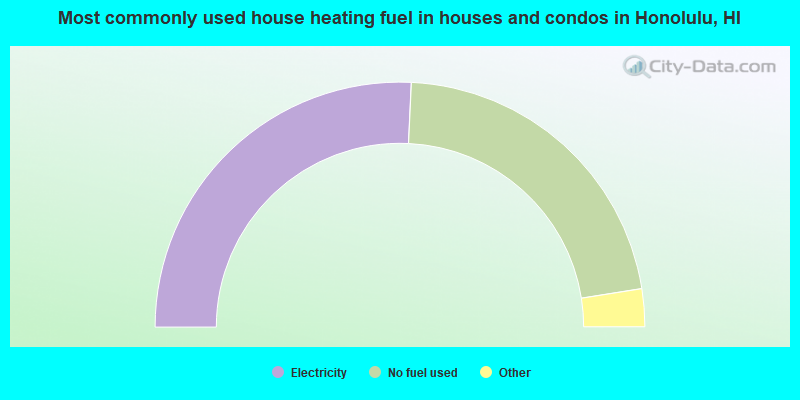
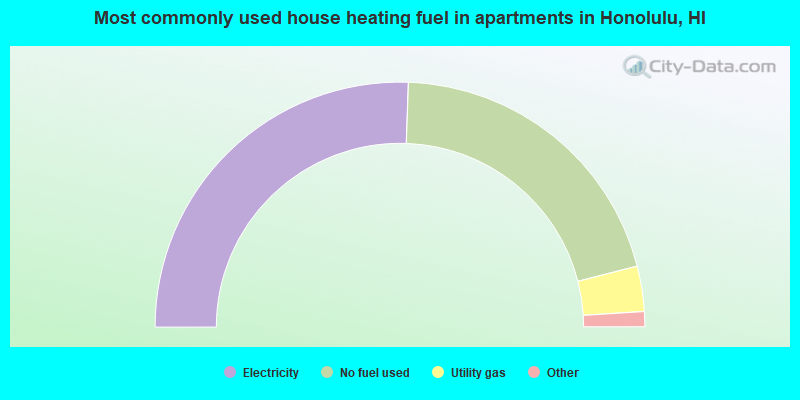
- 51.5%Electricity
- 43.5%No fuel used
- 3.1%Utility gas
- 1.1%Solar energy
- 0.5%Bottled, tank, or LP gas
- 0.1%Wood
- 51.1%Electricity
- 40.9%No fuel used
- 6.0%Utility gas
- 1.2%Bottled, tank, or LP gas
- 0.6%Solar energy
- 0.1%Fuel oil, kerosene, etc.
Honolulu compared to Hawaii state average:
- Unemployed percentage below state average.
- Hispanic race population percentage below state average.
- Renting percentage significantly below state average.
- Length of stay since moving in significantly above state average.
- Number of rooms per house significantly below state average.
- House age significantly below state average.
- Institutionalized population percentage significantly above state average.
Honolulu, HI compared to other similar cities:
Honolulu on our top lists:
- #1 on the list of "Top 101 cities with largest percentage of females in occupations: retail sales workers except cashiers (population 50,000+)"
- #1 on the list of "Top 101 cities with largest percentage of males in occupations: transportation, tourism, and lodging attendants (population 50,000+)"
- #1 on the list of "Top 101 cities with largest percentage of males in industries: jewelry, luggage, and leather goods stores (population 50,000+)"
- #1 on the list of "Top 101 cities with largest percentage of females in industries: jewelry, luggage, and leather goods stores (population 50,000+)"
- #1 on the list of "Top 101 cities with the smallest temperature differences during a year (population 50,000+)"
- #1 on the list of "Top 101 cities with largest percentage of males in occupations: cooks and food preparation workers (population 50,000+)"
- #2 on the list of "Top 101 cities with largest percentage of males in industries: clothing and accessories, including shoe, stores (population 50,000+)"
- #2 on the list of "Top 101 cities with largest percentage of females in industries: other direct selling establishments (population 50,000+)"
- #2 on the list of "Top 101 cities with largest percentage of males in occupations: other food preparation and serving workers including supervisors (population 50,000+)"
- #2 on the list of "Top 101 cities with largest percentage of females in industries: clothing and accessories, including shoe, stores (population 50,000+)"
- #3 on the list of "Top 101 cities with largest percentage of males in occupations: information and record clerks except customer service representatives (population 50,000+)"
- #3 on the list of "Top 101 cities with largest percentage of females in occupations: transportation, tourism, and lodging attendants (population 50,000+)"
- #4 on the list of "Top 101 cities with largest percentage of females in industries: used merchandise, gift, novelty, and souvenir, and other miscellaneous stores (population 50,000+)"
- #5 on the list of "Top 101 cities with the highest average yearly precipitation (population 50,000+)"
- #5 on the list of "Top 101 cities with largest percentage of males in industries: used merchandise, gift, novelty, and souvenir, and other miscellaneous stores (population 50,000+)"
- #6 on the list of "Top 101 cities with the largest percentage of people in crews of maritime vessels (population 1,000+)"
- #7 on the list of "Top 101 cities with the smallest differences between daily high and daily low temperatures (population 50,000+)"
- #9 on the list of "Top 101 cities with largest percentage of females in industries: air transportation (population 50,000+)"
- #10 on the list of "Top 101 cities with the largest percentage of high school students in private schools (3,000+ students)"
- #11 on the list of "Top 101 cities with the most full-time park and recreation workers per 1000 residents (population 5,000+)"
- #7 on the list of "Top 101 counties with the lowest average weight of females"
- #15 on the list of "Top 101 counties with the highest ground withdrawal of fresh water for public supply"
- #21 on the list of "Top 101 counties with the most Other congregations"
- #25 on the list of "Top 101 counties with the most Other adherents"
- #25 on the list of "Top 101 counties with the highest carbon monoxide air pollution readings in 2012 (ppm)"
State forum archive:

|
|
Total of 911 patent applications in 2008-2024.


