Crime rate in Inglewood, California (CA): murders, rapes, robberies, assaults, burglaries, thefts, auto thefts, arson, law enforcement employees, police officers, crime map
Crime rate in Inglewood, CA
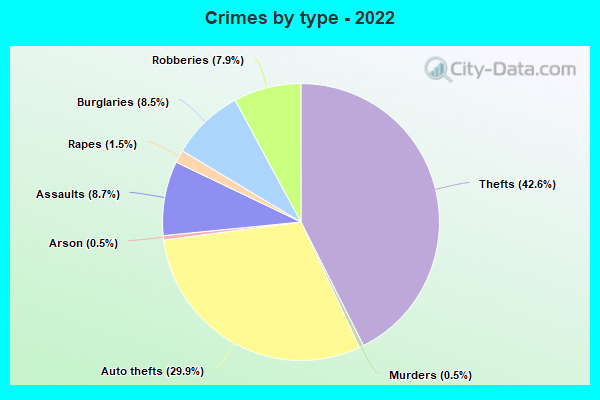
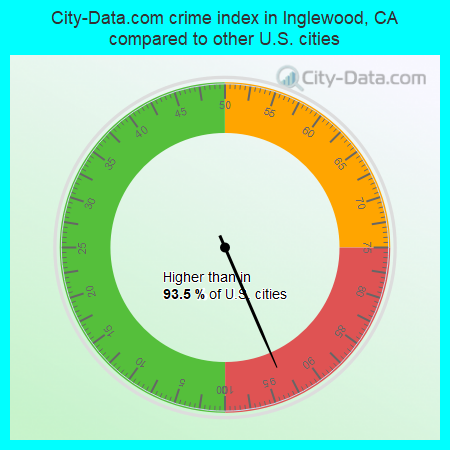
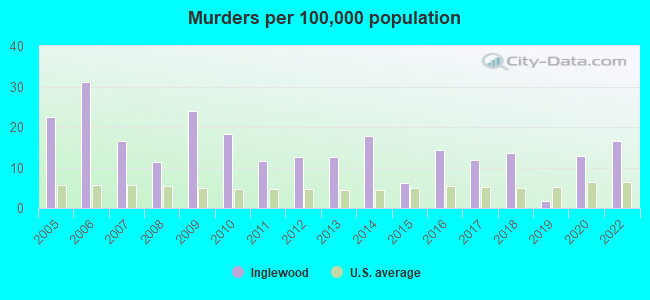
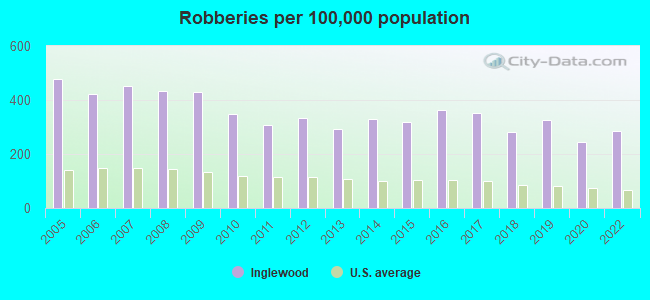
The 2022 crime rate in Inglewood, CA is 391 (City-Data.com crime index), which is 1.6 times higher than the U.S. average. It was higher than in 93.5% U.S. cities. The 2022 Inglewood crime rate rose by 18% compared to 2020. The number of homicides stood at 17 - an increase of 3 compared to 2020. In the last 5 years Inglewood has seen increasing violent crime and increasing property crime.See how dangerous Inglewood, CA is compared to the nearest cities:
(Note: Higher means more crime)
(Note: Higher means more crime)
| Inglewood: | 390.6 |
| Hawthorne: | 344.1 |
| El Segundo: | 512.0 |
| Culver City: | 472.5 |
| Lawndale: | 220.1 |
| Gardena: | 352.6 |
| Manhattan Beach: | 210.5 |
| Hermosa Beach: | 228.7 |
| Redondo Beach: | 217.4 |
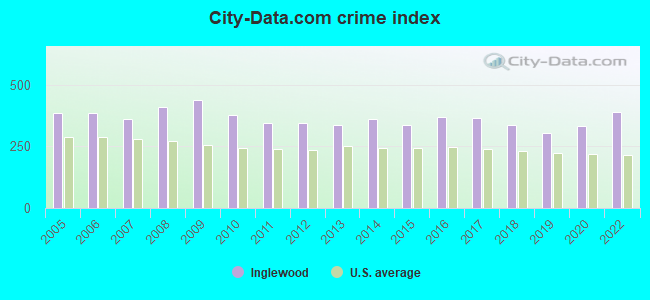
The City-Data.com crime index weighs serious crimes and violent crimes more heavily. Higher means more crime, U.S. average is 246.1. It adjusts for the number of visitors and daily workers commuting into cities.
- means the value is smaller than the state average.- means the value is about the same as the state average.
- means the value is bigger than the state average.
- means the value is much bigger than the state average.
According to our research of California and other state lists, there were 232 registered sex offenders living in Inglewood, California as of April 26, 2024.
The ratio of all residents to sex offenders in Inglewood is 477 to 1.
Violent crime rate in 2022
| Inglewood: | 383.5 |
| U.S. Average: | 219.8 |
Violent crime rate in 2020
| Inglewood: | 353.7 |
| U.S. Average: | 228.2 |
Violent crime rate in 2019
| Inglewood: | 332.8 |
| U.S. Average: | 219.9 |
Violent crime rate in 2018
| Inglewood: | 351.8 |
| U.S. Average: | 221.2 |
Violent crime rate in 2017
| Inglewood: | 392.6 |
| U.S. Average: | 226.2 |
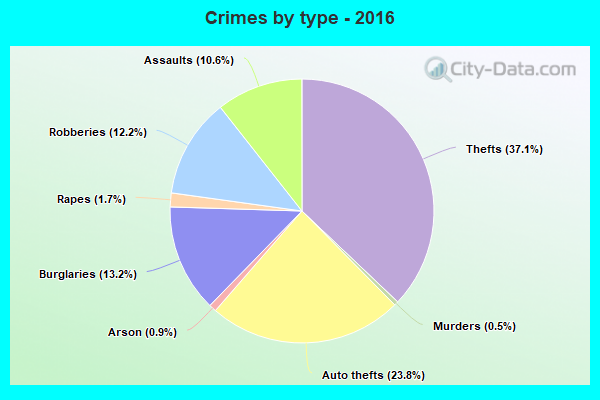
Violent crime rate in 2016
| Inglewood: | 416.7 |
| U.S. Average: | 227.3 |
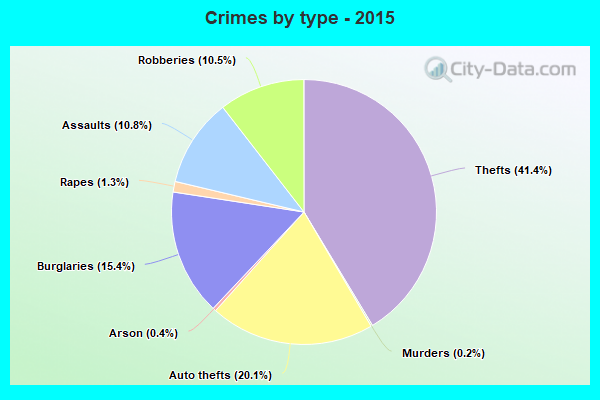
Violent crime rate in 2015
| Inglewood: | 373.5 |
| U.S. Average: | 219.3 |
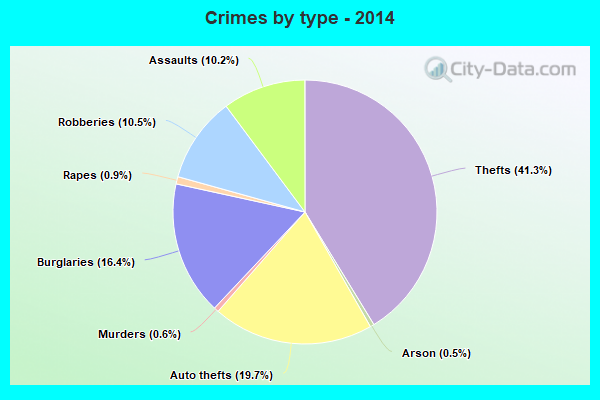
Violent crime rate in 2014
| Inglewood: | 390.6 |
| U.S. Average: | 211.1 |
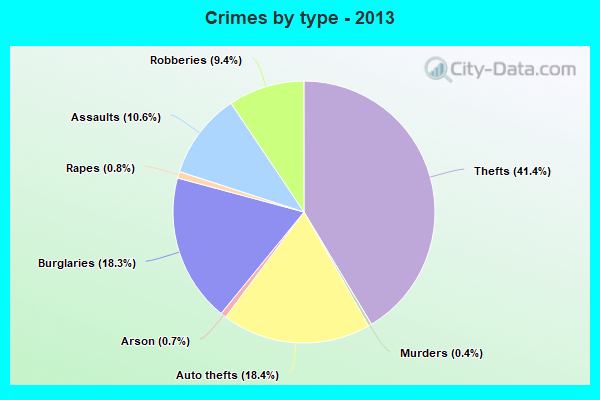
Violent crime rate in 2013
| Inglewood: | 362.7 |
| U.S. Average: | 214.2 |
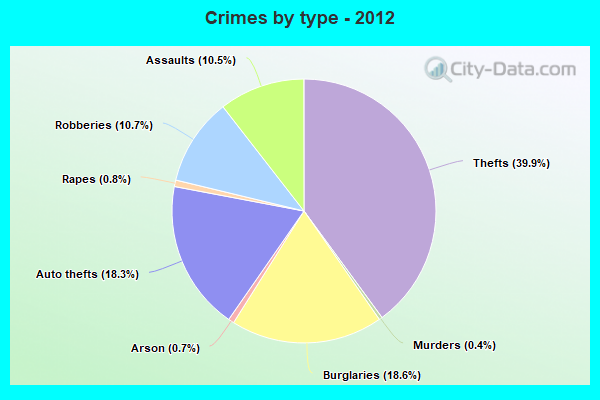
Violent crime rate in 2012
| Inglewood: | 380.8 |
| U.S. Average: | 187.4 |
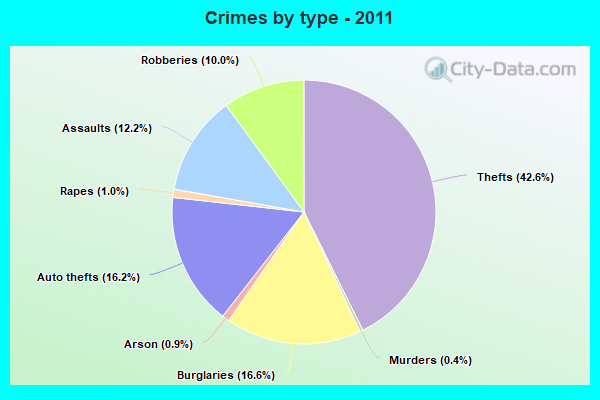
Violent crime rate in 2011
| Inglewood: | 396.5 |
| U.S. Average: | 187.1 |
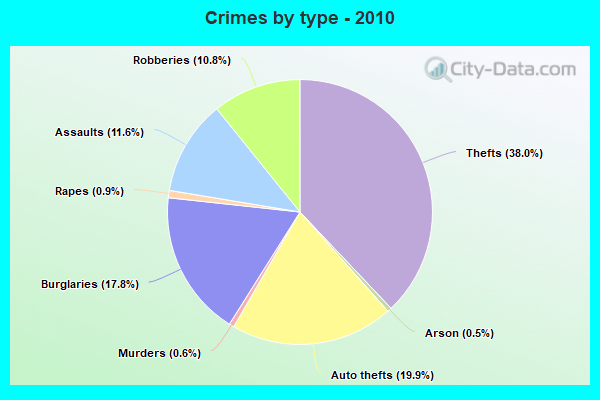
Violent crime rate in 2010
| Inglewood: | 426.3 |
| U.S. Average: | 195.7 |
Violent crime rate in 2009
| Inglewood: | 511.0 |
| U.S. Average: | 208.9 |
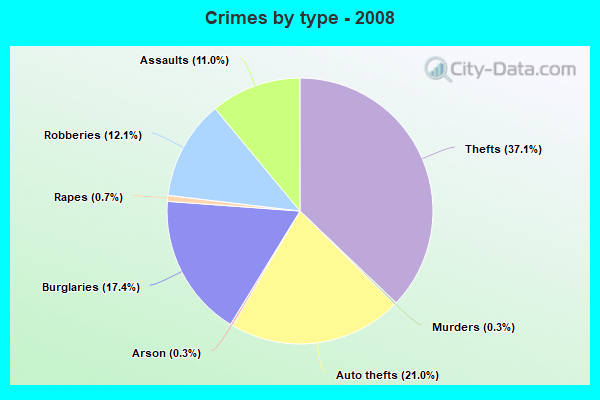
Violent crime rate in 2008
| Inglewood: | 464.9 |
| U.S. Average: | 222.5 |
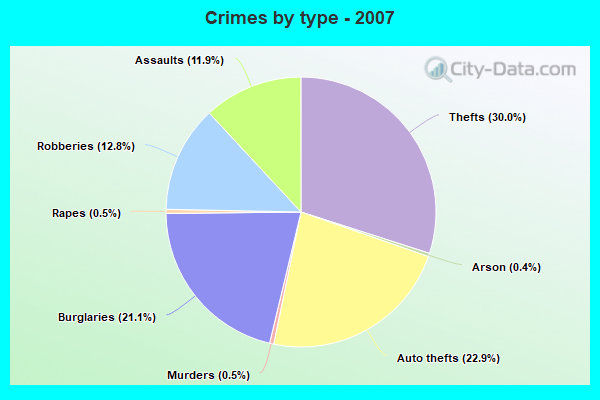
Violent crime rate in 2007
| Inglewood: | 412.4 |
| U.S. Average: | 229.1 |
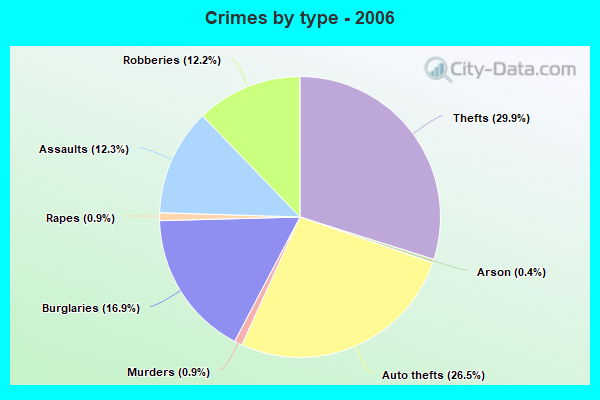
Violent crime rate in 2006
| Inglewood: | 442.1 |
| U.S. Average: | 232.6 |
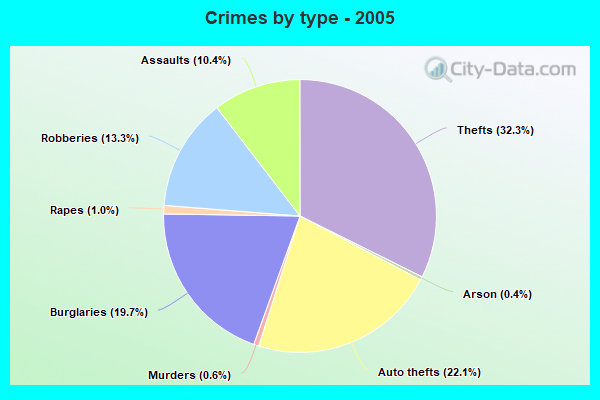
Violent crime rate in 2005
| Inglewood: | 433.3 |
| U.S. Average: | 227.0 |
Property crime rate in 2022
| Inglewood: | 297.6 |
| U.S. Average: | 166.5 |
Property crime rate in 2020
| Inglewood: | 244.7 |
| U.S. Average: | 169.6 |
Property crime rate in 2019
| Inglewood: | 208.4 |
| U.S. Average: | 179.7 |
Property crime rate in 2018
| Inglewood: | 244.3 |
| U.S. Average: | 190.2 |
Property crime rate in 2017
| Inglewood: | 263.5 |
| U.S. Average: | 206.4 |
Property crime rate in 2016
| Inglewood: | 238.6 |
| U.S. Average: | 216.6 |
Property crime rate in 2015
| Inglewood: | 246.6 |
| U.S. Average: | 221.5 |
Property crime rate in 2014
| Inglewood: | 262.5 |
| U.S. Average: | 230.8 |
Property crime rate in 2013
| Inglewood: | 264.6 |
| U.S. Average: | 250.4 |
Property crime rate in 2012
| Inglewood: | 264.0 |
| U.S. Average: | 267.3 |
Property crime rate in 2011
| Inglewood: | 243.1 |
| U.S. Average: | 273.5 |
Property crime rate in 2010
| Inglewood: | 271.7 |
| U.S. Average: | 276.4 |
Property crime rate in 2009
| Inglewood: | 290.3 |
| U.S. Average: | 285.6 |
Property crime rate in 2008
| Inglewood: | 305.0 |
| U.S. Average: | 302.2 |
Property crime rate in 2007
| Inglewood: | 274.0 |
| U.S. Average: | 309.2 |
Property crime rate in 2006
| Inglewood: | 261.4 |
| U.S. Average: | 317.3 |
Property crime rate in 2005
| Inglewood: | 272.4 |
| U.S. Average: | 322.3 |
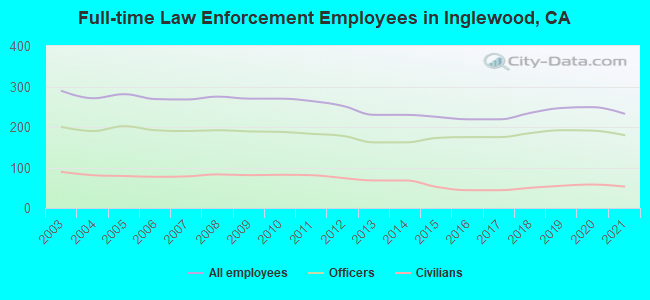
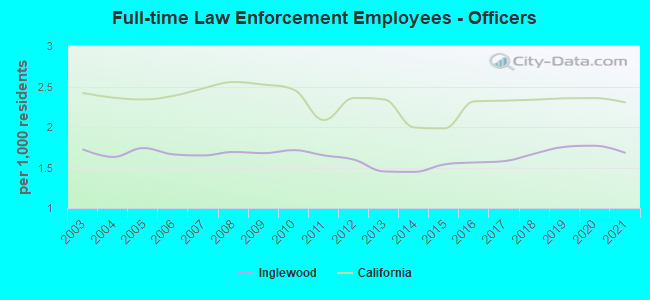
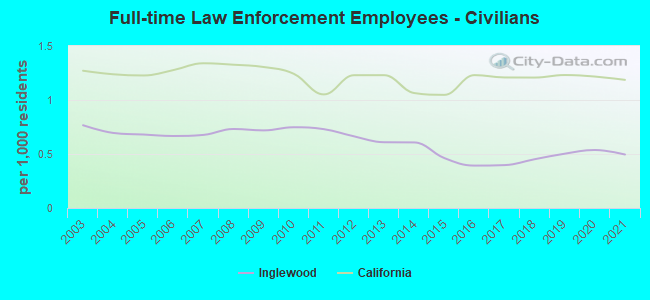
Full-time law enforcement employees in 2021, including police officers: 233 (180 officers - 158 male; 22 female).
| Officers per 1,000 residents here: | 1.68 |
| California average: | 2.30 |
Full-time law enforcement employees in 2020, including police officers: 249 (191 officers - 169 male; 22 female).
| Officers per 1,000 residents here: | 1.77 |
| California average: | 2.36 |
Full-time law enforcement employees in 2019, including police officers: 247 (192 officers - 171 male; 21 female).
| Officers per 1,000 residents here: | 1.76 |
| California average: | 2.35 |
Full-time law enforcement employees in 2018, including police officers: 235 (185 officers - 164 male; 21 female).
| Officers per 1,000 residents here: | 1.67 |
| California average: | 2.34 |
Full-time law enforcement employees in 2017, including police officers: 219 (175 officers - 155 male; 20 female).
| Officers per 1,000 residents here: | 1.58 |
| California average: | 2.32 |
Full-time law enforcement employees in 2016, including police officers: 219 (175 officers - 153 male; 22 female).
| Officers per 1,000 residents here: | 1.56 |
| California average: | 2.32 |
Full-time law enforcement employees in 2015, including police officers: 225 (173 officers - 151 male; 22 female).
| Officers per 1,000 residents here: | 1.54 |
| California average: | 1.98 |
Full-time law enforcement employees in 2014, including police officers: 230 (162 officers - 144 male; 18 female).
| Officers per 1,000 residents here: | 1.45 |
| California average: | 2.00 |
Full-time law enforcement employees in 2013, including police officers: 230 (162 officers - 144 male; 18 female).
| Officers per 1,000 residents here: | 1.45 |
| California average: | 2.34 |
Full-time law enforcement employees in 2012, including police officers: 252 (178 officers - 157 male; 21 female).
| Officers per 1,000 residents here: | 1.60 |
| California average: | 2.36 |
Full-time law enforcement employees in 2011, including police officers: 264 (183 officers - 160 male; 23 female).
| Officers per 1,000 residents here: | 1.65 |
| California average: | 2.09 |
Full-time law enforcement employees in 2010, including police officers: 270 (188 officers - 163 male; 25 female).
| Officers per 1,000 residents here: | 1.71 |
| California average: | 2.46 |
Full-time law enforcement employees in 2009, including police officers: 270 (189 officers - 166 male; 23 female).
| Officers per 1,000 residents here: | 1.68 |
| California average: | 2.52 |
Full-time law enforcement employees in 2008, including police officers: 275 (192 officers - 169 male; 23 female).
| Officers per 1,000 residents here: | 1.69 |
| California average: | 2.55 |
Full-time law enforcement employees in 2007, including police officers: 268 (190 officers - 166 male; 24 female).
| Officers per 1,000 residents here: | 1.65 |
| California average: | 2.48 |
Full-time law enforcement employees in 2006, including police officers: 269 (192 officers - 169 male; 23 female).
| Officers per 1,000 residents here: | 1.66 |
| California average: | 2.38 |
Full-time law enforcement employees in 2005, including police officers: 281 (202 officers - 178 male; 24 female).
| Officers per 1,000 residents here: | 1.74 |
| California average: | 2.34 |
Full-time law enforcement employees in 2004, including police officers: 271 (190 officers - 171 male; 19 female).
| Officers per 1,000 residents here: | 1.63 |
| California average: | 2.36 |
Full-time law enforcement employees in 2003, including police officers: 289 (200 officers - 178 male; 22 female).
| Officers per 1,000 residents here: | 1.72 |
| California average: | 2.42 |