Crime rate in Johnson City, Tennessee (TN): murders, rapes, robberies, assaults, burglaries, thefts, auto thefts, arson, law enforcement employees, police officers, crime map
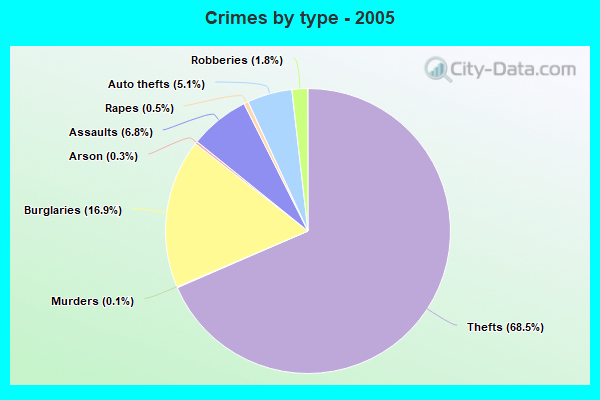
Crime rate in Johnson City, TN
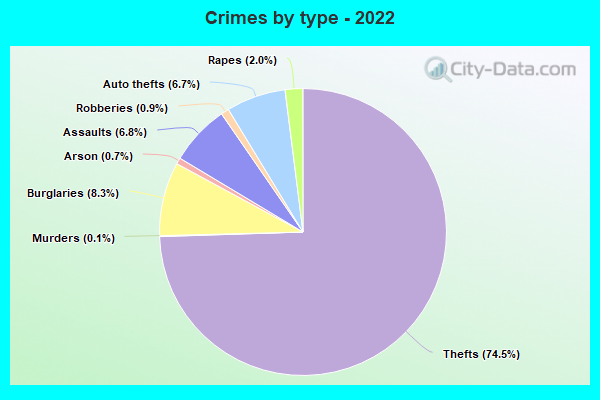
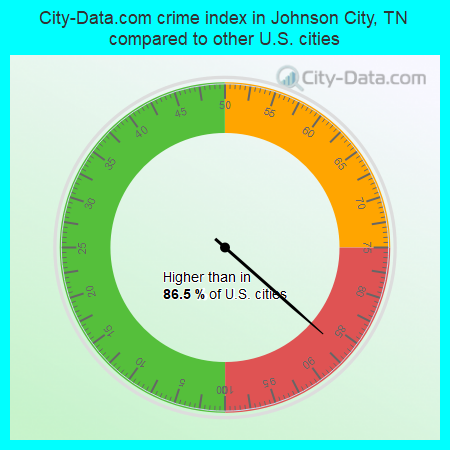
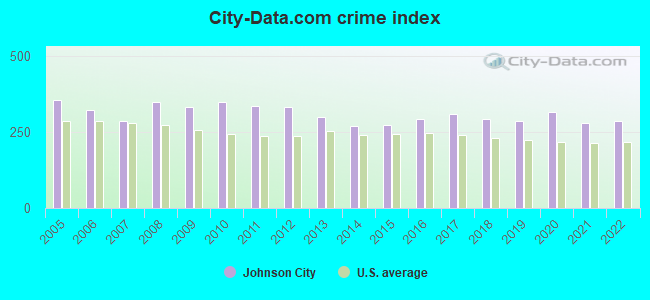
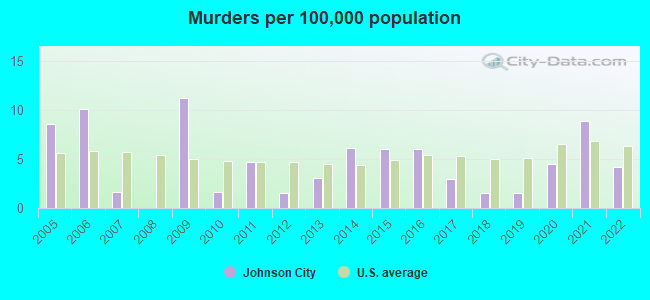
The 2022 crime rate in Johnson City, TN is 288 (City-Data.com crime index), which is comparable to the U.S. average. It was higher than in 86.5% U.S. cities. The 2022 Johnson City crime rate rose by 3% compared to 2021. The number of homicides stood at 3 - a decrease of 3 compared to 2021. In the last 5 years Johnson City has seen increasing violent crime and decline of property crime.See how dangerous Johnson City, TN is compared to the nearest cities:
(Note: Higher means more crime)
(Note: Higher means more crime)
| Johnson City: | 288.2 |
| Jonesborough: | 97.5 |
| Elizabethton: | 160.8 |
| Unicoi: | 70.7 |
| Bluff City: | 143.4 |
| Erwin: | 38.9 |
| Kingsport: | 412.7 |
| Bristol: | 248.3 |
| Bristol: | 275.9 |
The City-Data.com crime index weighs serious crimes and violent crimes more heavily. Higher means more crime, U.S. average is 246.1. It adjusts for the number of visitors and daily workers commuting into cities.
- means the value is smaller than the state average.- means the value is about the same as the state average.
- means the value is bigger than the state average.
- means the value is much bigger than the state average.
According to our research of Tennessee and other state lists, there were 185 registered sex offenders living in Johnson City, Tennessee as of April 26, 2024.
The ratio of all residents to sex offenders in Johnson City is 359 to 1.
The ratio of registered sex offenders to all residents in this city is near the state average.
Violent crime rate in 2022
| Johnson City: | 232.0 |
| U.S. Average: | 219.8 |
Violent crime rate in 2021
| Johnson City: | 222.9 |
| U.S. Average: | 224.8 |
Violent crime rate in 2020
| Johnson City: | 249.7 |
| U.S. Average: | 228.2 |
Violent crime rate in 2019
| Johnson City: | 239.6 |
| U.S. Average: | 219.9 |
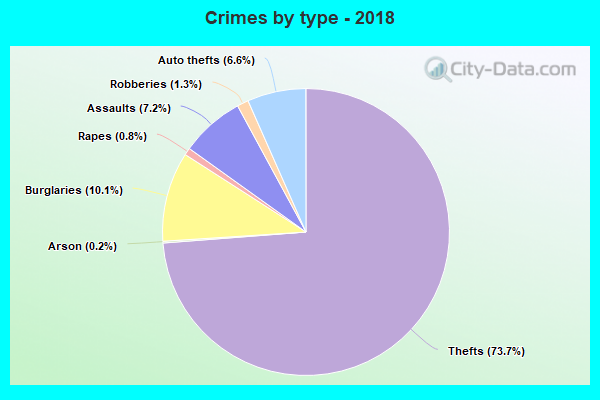
Violent crime rate in 2018
| Johnson City: | 225.3 |
| U.S. Average: | 221.2 |
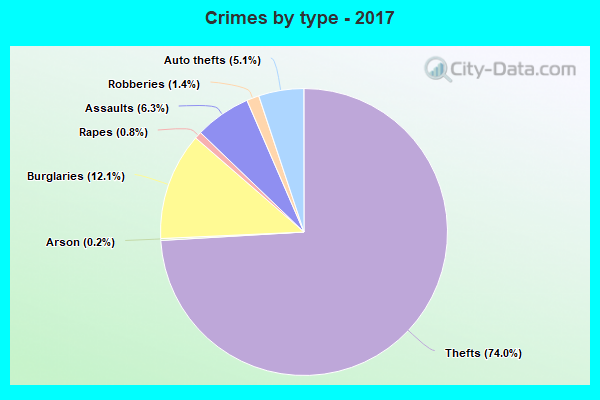
Violent crime rate in 2017
| Johnson City: | 222.5 |
| U.S. Average: | 226.2 |
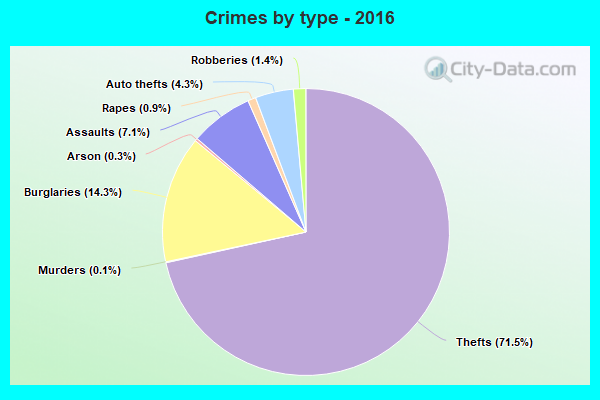
Violent crime rate in 2016
| Johnson City: | 227.8 |
| U.S. Average: | 227.3 |
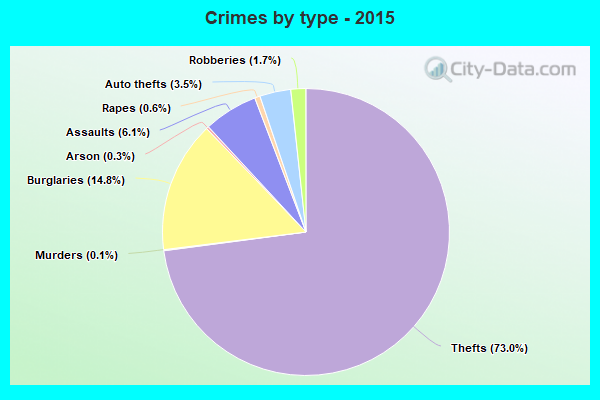
Violent crime rate in 2015
| Johnson City: | 195.9 |
| U.S. Average: | 219.3 |
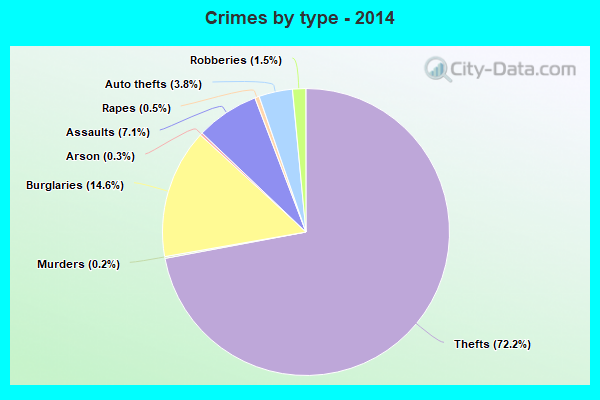
Violent crime rate in 2014
| Johnson City: | 202.2 |
| U.S. Average: | 211.1 |
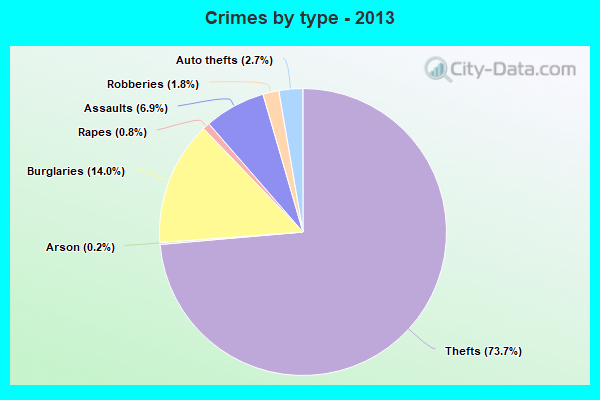
Violent crime rate in 2013
| Johnson City: | 232.6 |
| U.S. Average: | 214.2 |
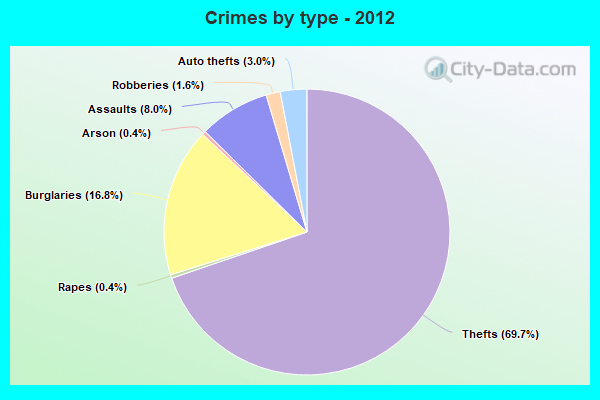
Violent crime rate in 2012
| Johnson City: | 263.4 |
| U.S. Average: | 187.4 |
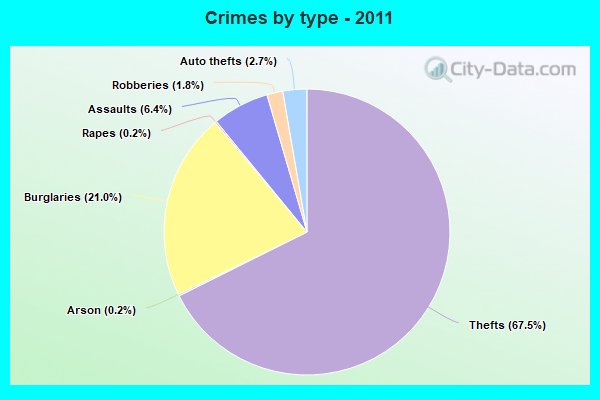
Violent crime rate in 2011
| Johnson City: | 230.7 |
| U.S. Average: | 187.1 |
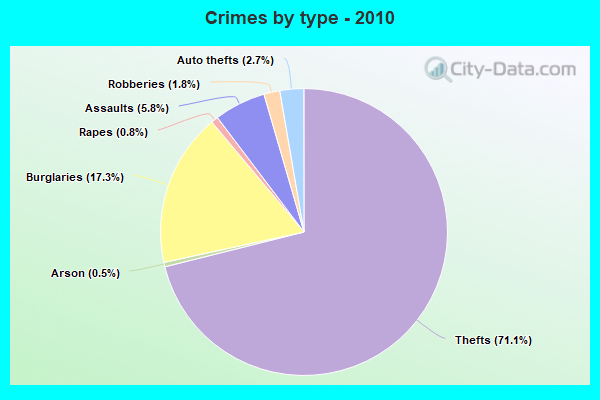
Violent crime rate in 2010
| Johnson City: | 243.9 |
| U.S. Average: | 195.7 |
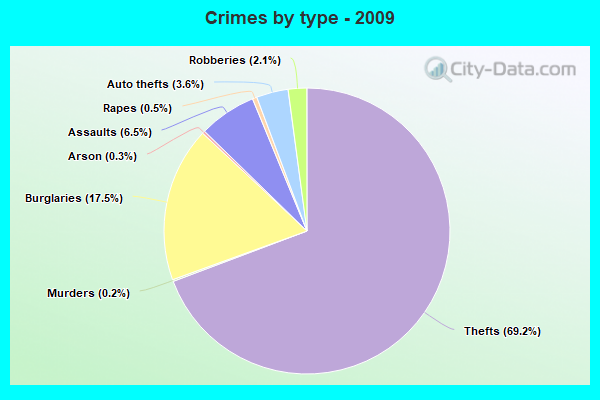
Violent crime rate in 2009
| Johnson City: | 248.8 |
| U.S. Average: | 208.9 |
Violent crime rate in 2008
| Johnson City: | 269.9 |
| U.S. Average: | 222.5 |
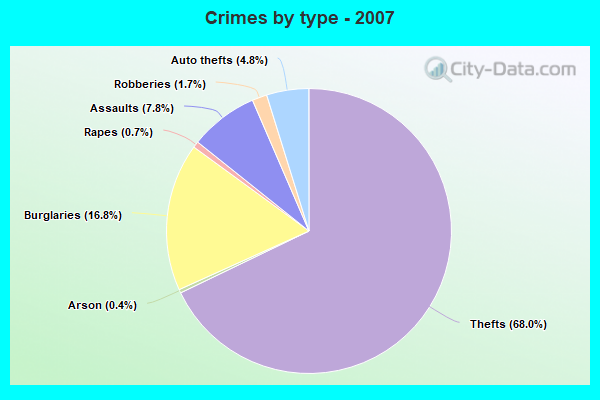
Violent crime rate in 2007
| Johnson City: | 225.4 |
| U.S. Average: | 229.1 |
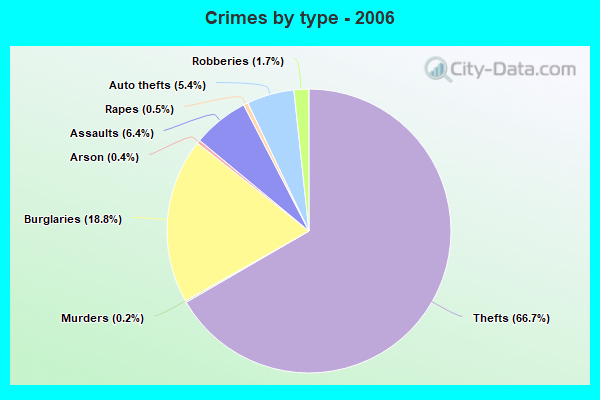
Violent crime rate in 2006
| Johnson City: | 228.6 |
| U.S. Average: | 232.6 |
Violent crime rate in 2005
| Johnson City: | 260.7 |
| U.S. Average: | 227.0 |
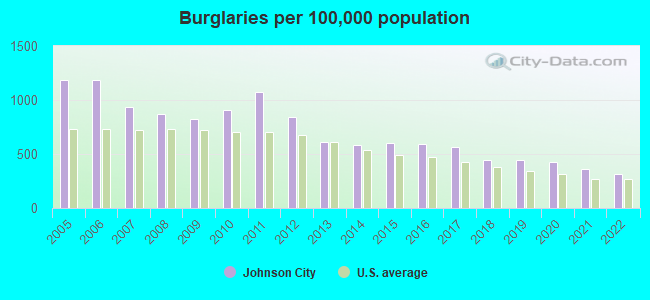
Property crime rate in 2022
| Johnson City: | 244.2 |
| U.S. Average: | 166.5 |
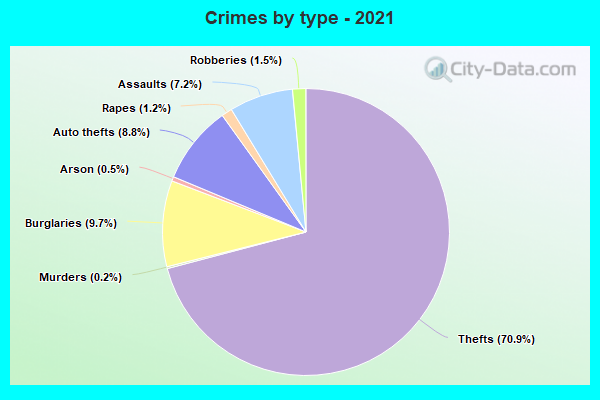
Property crime rate in 2021
| Johnson City: | 253.8 |
| U.S. Average: | 157.8 |
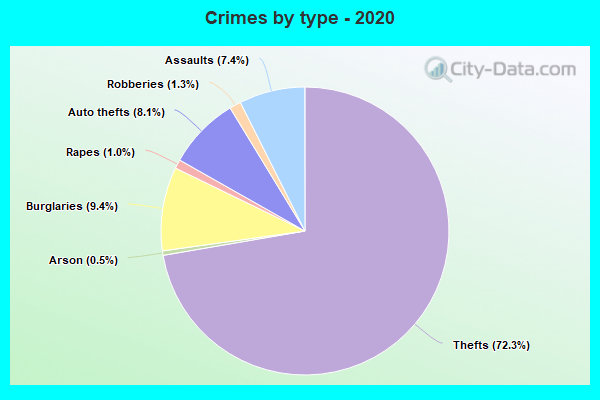
Property crime rate in 2020
| Johnson City: | 302.7 |
| U.S. Average: | 169.6 |
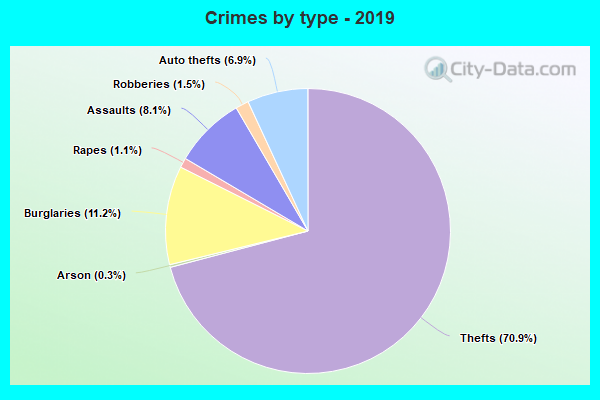
Property crime rate in 2019
| Johnson City: | 272.6 |
| U.S. Average: | 179.7 |
Property crime rate in 2018
| Johnson City: | 291.8 |
| U.S. Average: | 190.2 |
Property crime rate in 2017
| Johnson City: | 318.3 |
| U.S. Average: | 206.4 |
Property crime rate in 2016
| Johnson City: | 294.4 |
| U.S. Average: | 216.6 |
Property crime rate in 2015
| Johnson City: | 290.9 |
| U.S. Average: | 221.5 |
Property crime rate in 2014
| Johnson City: | 283.6 |
| U.S. Average: | 230.8 |
Property crime rate in 2013
| Johnson City: | 302.6 |
| U.S. Average: | 250.4 |
Property crime rate in 2012
| Johnson City: | 365.5 |
| U.S. Average: | 267.3 |
Property crime rate in 2011
| Johnson City: | 407.2 |
| U.S. Average: | 273.5 |
Property crime rate in 2010
| Johnson City: | 389.6 |
| U.S. Average: | 276.4 |
Property crime rate in 2009
| Johnson City: | 352.1 |
| U.S. Average: | 285.6 |
Property crime rate in 2008
| Johnson City: | 379.2 |
| U.S. Average: | 302.2 |
Property crime rate in 2007
| Johnson City: | 310.2 |
| U.S. Average: | 309.2 |
Property crime rate in 2006
| Johnson City: | 369.2 |
| U.S. Average: | 317.3 |
Property crime rate in 2005
| Johnson City: | 394.0 |
| U.S. Average: | 322.3 |
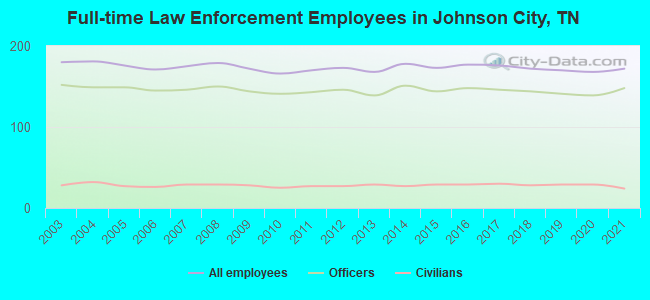
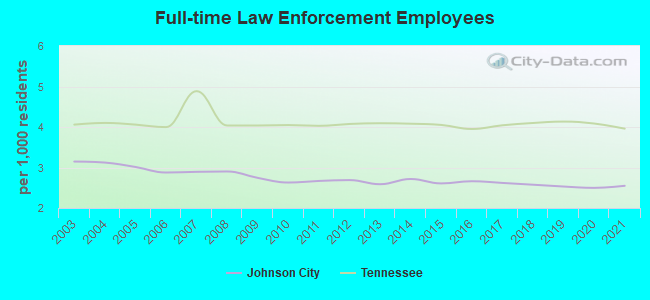
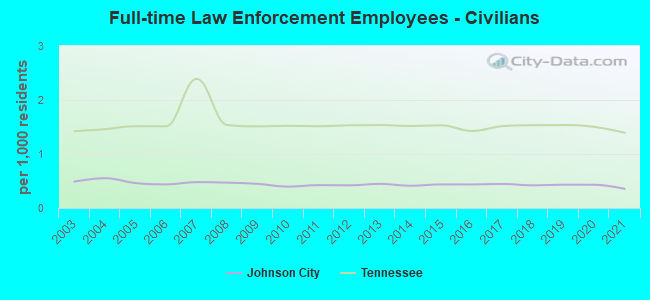
Full-time law enforcement employees in 2021, including police officers: 172 (148 officers - 128 male; 20 female).
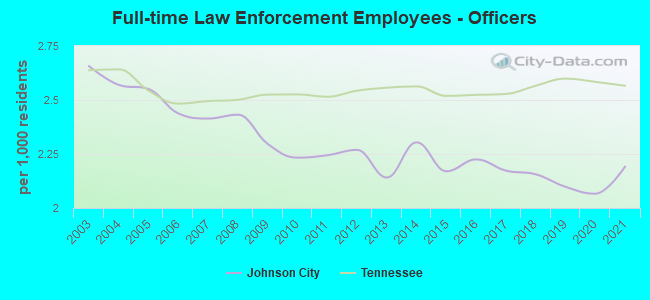
| Officers per 1,000 residents here: | 2.19 |
| Tennessee average: | 2.57 |
Full-time law enforcement employees in 2020, including police officers: 168 (139 officers - 121 male; 18 female).
| Officers per 1,000 residents here: | 2.07 |
| Tennessee average: | 2.58 |
Full-time law enforcement employees in 2019, including police officers: 170 (141 officers - 122 male; 19 female).
| Officers per 1,000 residents here: | 2.10 |
| Tennessee average: | 2.60 |
Full-time law enforcement employees in 2018, including police officers: 172 (144 officers - 127 male; 17 female).
| Officers per 1,000 residents here: | 2.16 |
| Tennessee average: | 2.57 |
Full-time law enforcement employees in 2017, including police officers: 176 (146 officers - 129 male; 17 female).
| Officers per 1,000 residents here: | 2.17 |
| Tennessee average: | 2.53 |
Full-time law enforcement employees in 2016, including police officers: 177 (148 officers - 132 male; 16 female).
| Officers per 1,000 residents here: | 2.23 |
| Tennessee average: | 2.52 |
Full-time law enforcement employees in 2015, including police officers: 173 (144 officers - 133 male; 11 female).
| Officers per 1,000 residents here: | 2.17 |
| Tennessee average: | 2.52 |
Full-time law enforcement employees in 2014, including police officers: 178 (151 officers - 140 male; 11 female).
| Officers per 1,000 residents here: | 2.30 |
| Tennessee average: | 2.56 |
Full-time law enforcement employees in 2013, including police officers: 168 (139 officers - 129 male; 10 female).
| Officers per 1,000 residents here: | 2.14 |
| Tennessee average: | 2.56 |
Full-time law enforcement employees in 2012, including police officers: 173 (146 officers - 134 male; 12 female).
| Officers per 1,000 residents here: | 2.27 |
| Tennessee average: | 2.54 |
Full-time law enforcement employees in 2011, including police officers: 170 (143 officers - 132 male; 11 female).
| Officers per 1,000 residents here: | 2.24 |
| Tennessee average: | 2.52 |
Full-time law enforcement employees in 2010, including police officers: 166 (141 officers - 131 male; 10 female).
| Officers per 1,000 residents here: | 2.23 |
| Tennessee average: | 2.53 |
Full-time law enforcement employees in 2009, including police officers: 172 (144 officers - 132 male; 12 female).
| Officers per 1,000 residents here: | 2.30 |
| Tennessee average: | 2.52 |
Full-time law enforcement employees in 2008, including police officers: 179 (150 officers - 138 male; 12 female).
| Officers per 1,000 residents here: | 2.43 |
| Tennessee average: | 2.50 |
Full-time law enforcement employees in 2007, including police officers: 175 (146 officers - 133 male; 13 female).
| Officers per 1,000 residents here: | 2.41 |
| Tennessee average: | 2.50 |
Full-time law enforcement employees in 2006, including police officers: 171 (145 officers - 135 male; 10 female).
| Officers per 1,000 residents here: | 2.44 |
| Tennessee average: | 2.48 |
Full-time law enforcement employees in 2005, including police officers: 176 (149 officers - 137 male; 12 female).
| Officers per 1,000 residents here: | 2.55 |
| Tennessee average: | 2.54 |
Full-time law enforcement employees in 2004, including police officers: 181 (149 officers - 134 male; 15 female).
| Officers per 1,000 residents here: | 2.57 |
| Tennessee average: | 2.64 |
Full-time law enforcement employees in 2003, including police officers: 180 (152 officers - 137 male; 15 female).
| Officers per 1,000 residents here: | 2.66 |
| Tennessee average: | 2.64 |