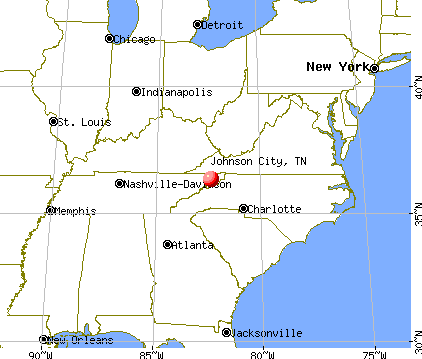
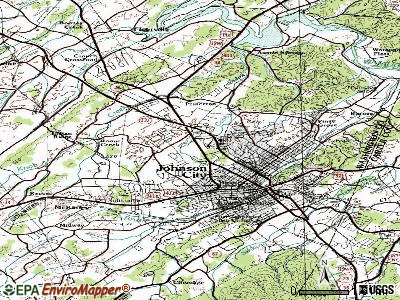
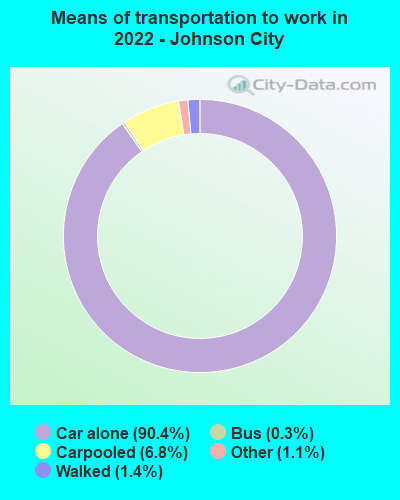
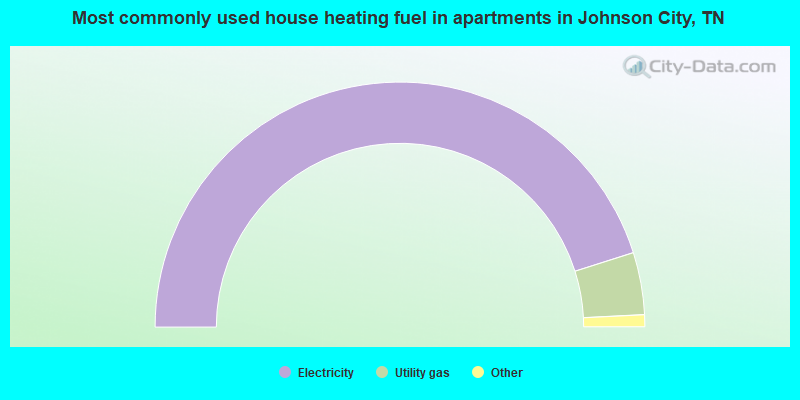
Johnson City, Tennessee

Johnson City: Sunlit graves of the patriotic at the Johnson City Veterans Cemetery,
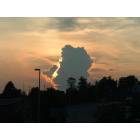
Johnson City: Another shot of sunsetting above Sunset Dr. in Johnson City taken by Rob Cookenour of www.giveittorob.com
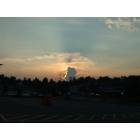
Johnson City: Sunsetting above Sunset Dr. in Johnson City taken by Rob Cookenour of www.giveittorob.com
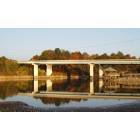
Johnson City: Devault Bridge, Johnson City, TN
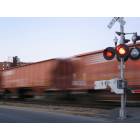
Johnson City: train passing downtown
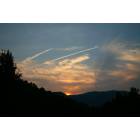
Johnson City: Buffalo Mountain Sunset
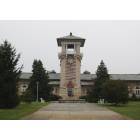
Johnson City: VA, Bell Tower, Mountain Home, Johnson City, TN
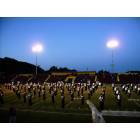
Johnson City: science hill high school marching band
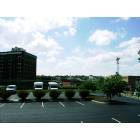
Johnson City: downtown Johnson City from Munsey Church parking lot
Johnson City: downtown
Johnson City: VA Hospital campus in January.
- see
21
more - add
your
Submit your own pictures of this city and show them to the world
- OSM Map
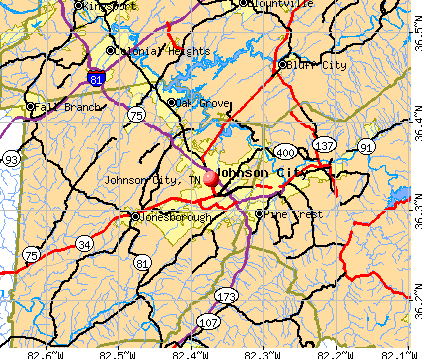
- General Map
- Google Map
- MSN Map
Population change since 2000: +30.7%
 |
| Males: 33,425 | |
| Females: 39,089 |
| Median resident age: | 34.4 years |
| Tennessee median age: | 39.2 years |
Zip codes: 37604, 37614, 37659, 37694.
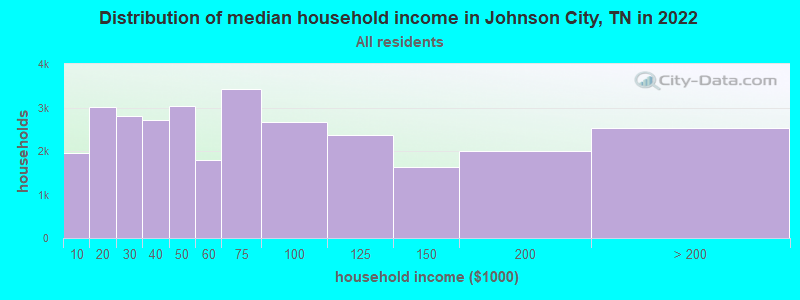
Johnson City Zip Code Map| Johnson City: | $55,228 |
| TN: | $65,254 |
Estimated per capita income in 2022: $38,524 (it was $20,364 in 2000)
Johnson City city income, earnings, and wages data
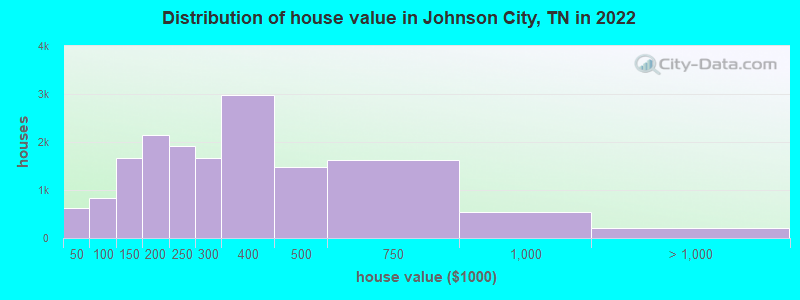
Estimated median house or condo value in 2022: $251,700 (it was $95,300 in 2000)
| Johnson City: | $251,700 |
| TN: | $284,800 |
Mean prices in 2022: all housing units: $321,072; detached houses: $345,084; townhouses or other attached units: $273,896; in 2-unit structures: $180,937; in 3-to-4-unit structures: $74,614; in 5-or-more-unit structures: $141,197; mobile homes: $44,858
Median gross rent in 2022: $913.
(17.6% for White Non-Hispanic residents, 26.7% for Black residents, 36.5% for Hispanic or Latino residents, 59.0% for American Indian residents, 26.8% for other race residents, 27.9% for two or more races residents)
Detailed information about poverty and poor residents in Johnson City, TN


Compare current foreclosures in Johnson City, TN:
| Photo | Address | Area | Beds / Baths | Price | Details |
|---|---|---|---|---|---|

|
#1
Miller Hill Rd
Johnson City, TN 37601
|
- sq. feet
|
- baths - beds |
$93,600
|
show details |

|
#2
Buckingham Dr
Johnson City, TN 37604
|
1,648 sq. feet
|
2 baths - beds |
show details | |

|
#3
Brandonwood Dr
Johnson City, TN 37604
|
1,674 sq. feet
|
2 baths - beds |
show details | |

|
#4
Lowridge Rd
Johnson City, TN 37604
|
1,392 sq. feet
|
1 baths - beds |
show details | |

|
#5
Whispering Pines Rd
Johnson City, TN 37601
|
- sq. feet
|
2 baths 3 beds |
show details | |

|
#6
Jackson Ave
Johnson City, TN 37604
|
1,176 sq. feet
|
1 baths - beds |
show details | |

|
#7
Suncrest St
Johnson City, TN 37615
|
1,270 sq. feet
|
1 baths - beds |
show details | |

|
#8
Whittling Wood Dr, C O James Warlick
Johnson City, TN 37601
|
2,186 sq. feet
|
2 baths - beds |
show details | |

|
#9
Gray Station Rd
Johnson City, TN 37615
|
1,334 sq. feet
|
1 baths - beds |
show details | |

|
#10
W Poplar St
Johnson City, TN 37604
|
1,030 sq. feet
|
1 baths - beds |
show details |
| Photo | Address | Area | Beds / Baths | Price | Details |
|---|---|---|---|---|---|

|
#11
Polk Ave
Johnson City, TN 37604
|
1,020 sq. feet
|
1 baths - beds |
show details | |

|
#12
Westwood St
Johnson City, TN 37604
|
1,632 sq. feet
|
1 baths - beds |
show details | |

|
#13
Cedar Ln
Johnson City, TN 37615
|
1,036 sq. feet
|
1 baths - beds |
show details | |

|
#14
Louise St
Johnson City, TN 37601
|
1,092 sq. feet
|
1 baths - beds |
show details | |

|
#15
Sparks Rd
Johnson City, TN 37601
|
1,368 sq. feet
|
1 baths - beds |
show details | |

|
#16
Woodside Dr
Johnson City, TN 37604
|
3,792 sq. feet
|
2 baths - beds |
show details | |

|
#17
Oak St
Johnson City, TN 37615
|
820 sq. feet
|
1 baths - beds |
show details | |

|
#18
Woodbury Dr
Johnson City, TN 37615
|
1,075 sq. feet
|
1 baths - beds |
show details | |

|
#19
E 11th Ave
Johnson City, TN 37601
|
1,380 sq. feet
|
1 baths - beds |
show details | |

|
#20
Gray Station Rd
Johnson City, TN 37615
|
784 sq. feet
|
1 baths - beds |
show details |
| Photo | Address | Area | Beds / Baths | Price | Details |
|---|---|---|---|---|---|

|
#21
Blazerview Rd
Johnson City, TN 37615
|
1,268 sq. feet
|
2 baths - beds |
show details | |

|
#22
Fairridge Rd
Johnson City, TN 37604
|
1,596 sq. feet
|
3 baths - beds |
show details | |

|
#23
Pardee St
Johnson City, TN 37601
|
945 sq. feet
|
1 baths - beds |
show details | |

|
#24
Glendale Dr
Johnson City, TN 37604
|
2,132 sq. feet
|
1 baths - beds |
show details | |

|
#25
Indian Ridge Rd
Johnson City, TN 37604
|
768 sq. feet
|
1 baths - beds |
show details | |

|
#26
Faith Cir
Johnson City, TN 37604
|
936 sq. feet
|
1 baths - beds |
show details | |

|
#27
Heatherly Ln
Johnson City, TN 37604
|
1,280 sq. feet
|
1 baths - beds |
show details | |

|
#28
Tee Ct
Johnson City, TN 37601
|
1,464 sq. feet
|
2 baths - beds |
show details | |

|
#29
Bowers St
Johnson City, TN 37601
|
1,250 sq. feet
|
2 baths - beds |
show details | |

|
#30
Sheffield Ct
Johnson City, TN 37604
|
1,971 sq. feet
|
2 baths - beds |
show details |
| Photo | Address | Area | Beds / Baths | Price | Details |
|---|---|---|---|---|---|

|
#31
Cedar St
Johnson City, TN 37601
|
1,456 sq. feet
|
2 baths - beds |
show details | |

|
#32
Sunrise Valley Dr
Johnson City, TN 37604
|
2,145 sq. feet
|
2 baths - beds |
show details | |

|
#33
E Fairview Ave Apt 2
Johnson City, TN 37601
|
1,472 sq. feet
|
2 baths - beds |
show details | |

|
#34
Lee Cir
Johnson City, TN 37604
|
948 sq. feet
|
1 baths - beds |
show details | |

|
#35
Douglas Dr
Johnson City, TN 37604
|
3,036 sq. feet
|
3 baths - beds |
show details | |

|
#36
Northeast Dr
Johnson City, TN 37601
|
816 sq. feet
|
1 baths - beds |
show details | |

|
#37
Molton Cir
Johnson City, TN 37615
|
1,025 sq. feet
|
1 baths - beds |
show details | |

|
#38
Long St
Johnson City, TN 37601
|
1,204 sq. feet
|
1 baths - beds |
show details | |

|
#39
Ballard Rd
Johnson City, TN 37604
|
1,403 sq. feet
|
2 baths - beds |
show details | |

|
#40
Clearview Dr
Johnson City, TN 37604
|
975 sq. feet
|
1 baths - beds |
show details |
| Photo | Address | Area | Beds / Baths | Price | Details |
|---|---|---|---|---|---|

|
#41
Greenbriar Cir Apt 6
Johnson City, TN 37601
|
1,518 sq. feet
|
2 baths - beds |
show details | |

|
#42
Suncrest Dr
Johnson City, TN 37615
|
2,080 sq. feet
|
2 baths - beds |
show details | |

|
#43
Colorado St
Johnson City, TN 37601
|
1,040 sq. feet
|
2 baths - beds |
show details | |

|
#44
Granbrook Dr
Johnson City, TN 37601
|
1,215 sq. feet
|
1 baths - beds |
show details | |

|
#45
Cresland Dr
Johnson City, TN 37601
|
1,334 sq. feet
|
1 baths - beds |
show details | |

|
#46
Sun St
Johnson City, TN 37615
|
1,232 sq. feet
|
1 baths - beds |
show details | |

|
#47
Cindy Anne Dr
Johnson City, TN 37615
|
2,042 sq. feet
|
2 baths - beds |
show details | |

|
#48
N North St
Johnson City, TN 37604
|
876 sq. feet
|
1 baths - beds |
show details | |

|
#49
Castlewood Ct
Johnson City, TN 37601
|
1,798 sq. feet
|
2 baths - beds |
show details | |

|
Check over 1 million property listings on Foreclosure.com!
|
browse all offers | |||


- 59,49182.3%White alone
- 4,1585.8%Hispanic
- 3,7535.2%Two or more races
- 2,7783.8%Black alone
- 1,5622.2%Asian alone
- 930.1%Other race alone
- 610.08%American Indian alone
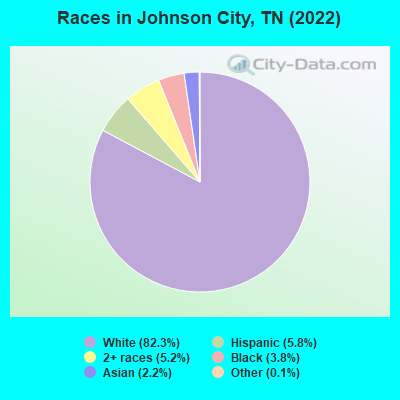
Races in Johnson City detailed stats: ancestries, foreign born residents, place of birth
According to our research of Tennessee and other state lists, there were 185 registered sex offenders living in Johnson City, Tennessee as of April 27, 2024.
The ratio of all residents to sex offenders in Johnson City is 359 to 1.
The ratio of registered sex offenders to all residents in this city is near the state average.
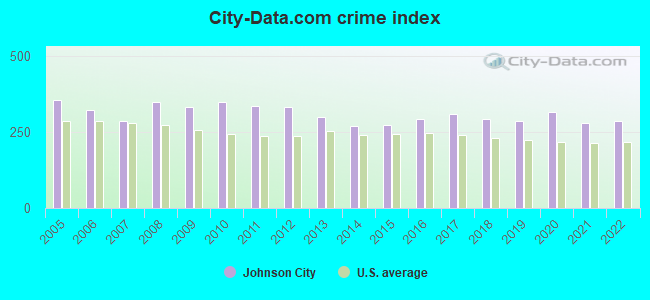
The City-Data.com crime index weighs serious crimes and violent crimes more heavily. Higher means more crime, U.S. average is 246.1. It adjusts for the number of visitors and daily workers commuting into cities.
- means the value is smaller than the state average.- means the value is about the same as the state average.
- means the value is bigger than the state average.
- means the value is much bigger than the state average.
Crime rate in Johnson City detailed stats: murders, rapes, robberies, assaults, burglaries, thefts, arson
Full-time law enforcement employees in 2021, including police officers: 172 (148 officers - 128 male; 20 female).
| Officers per 1,000 residents here: | 2.19 |
| Tennessee average: | 2.57 |
 Recent articles from our blog. Our writers, many of them Ph.D. graduates or candidates, create easy-to-read articles on a wide variety of topics.


Latest news from Johnson City, TN collected exclusively by city-data.com from local newspapers, TV, and radio stations
Ancestries: American (22.9%), English (19.0%), Irish (9.4%), German (5.4%), European (2.9%), Scotch-Irish (2.6%).
Current Local Time: EST time zone
Incorporated in 1869
Elevation: 1635 feet
Land area: 39.3 square miles.
Population density: 1,846 people per square mile (low).
4,322 residents are foreign born (2.2% Latin America, 1.7% Asia, 1.1% Africa, 0.7% Europe).
| This city: | 6.0% |
| Tennessee: | 5.4% |
Median real estate property taxes paid for housing units with mortgages in 2022: $1,465 (0.6%)
Median real estate property taxes paid for housing units with no mortgage in 2022: $1,988 (0.8%)
Nearest city with pop. 200,000+: Charlotte, NC  (116.6 miles , pop. 540,828).
Nearest city with pop. 1,000,000+: Philadelphia, PA (467.4 miles , pop. 1,517,550).
Nearest cities:
), ), ), ), )Latitude: 36.34 N, Longitude: 82.37 W
Daytime population change due to commuting: +22,765 (+31.9%)
Workers who live and work in this city: 27,073 (73.2%)
Area code: 423
Johnson City, Tennessee accommodation & food services, waste management - Economy and Business Data
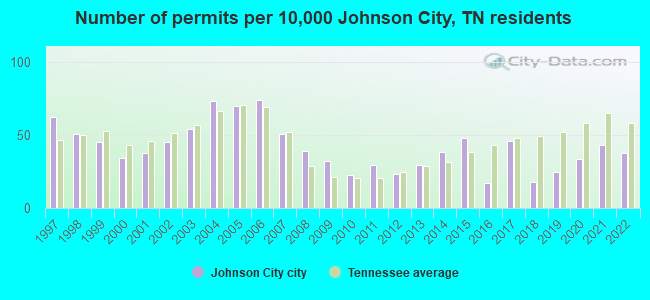
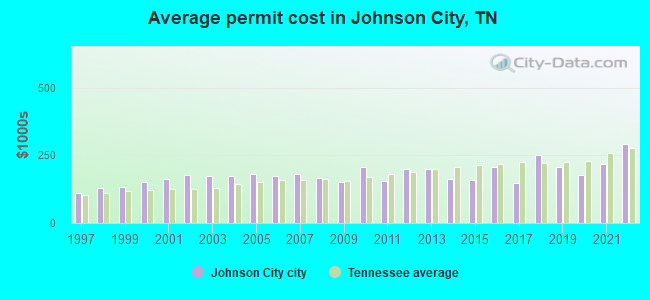
Single-family new house construction building permits:
- 2022: 210 buildings, average cost: $291,500
- 2021: 241 buildings, average cost: $218,400
- 2020: 185 buildings, average cost: $176,200
- 2019: 135 buildings, average cost: $207,000
- 2018: 100 buildings, average cost: $251,300
- 2017: 254 buildings, average cost: $148,500
- 2016: 96 buildings, average cost: $205,700
- 2015: 265 buildings, average cost: $159,600
- 2014: 214 buildings, average cost: $163,500
- 2013: 162 buildings, average cost: $199,200
- 2012: 131 buildings, average cost: $200,600
- 2011: 163 buildings, average cost: $153,800
- 2010: 125 buildings, average cost: $206,300
- 2009: 180 buildings, average cost: $150,600
- 2008: 215 buildings, average cost: $165,300
- 2007: 283 buildings, average cost: $181,800
- 2006: 411 buildings, average cost: $173,000
- 2005: 388 buildings, average cost: $180,700
- 2004: 406 buildings, average cost: $172,700
- 2003: 300 buildings, average cost: $174,400
- 2002: 249 buildings, average cost: $176,100
- 2001: 209 buildings, average cost: $161,300
- 2000: 189 buildings, average cost: $150,300
- 1999: 251 buildings, average cost: $134,700
- 1998: 283 buildings, average cost: $131,100
- 1997: 344 buildings, average cost: $109,500
| Here: | 3.0% |
| Tennessee: | 3.0% |
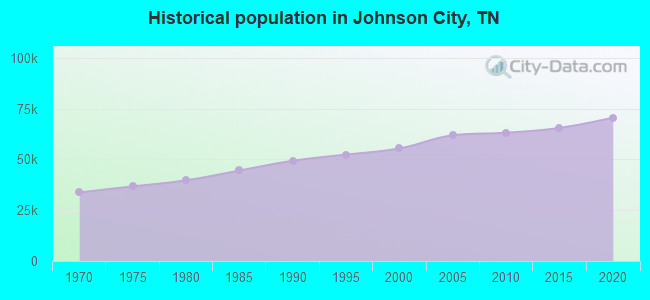
Population change in the 1990s: +3,568 (+6.9%).
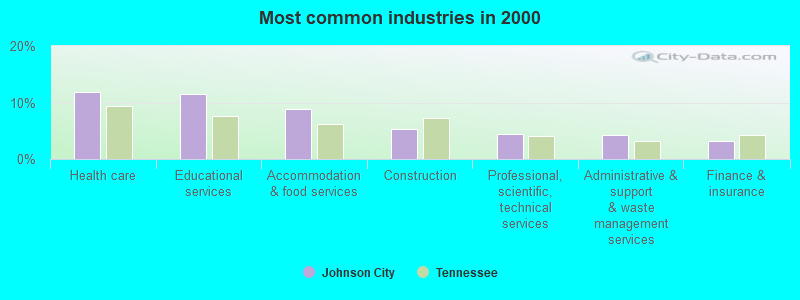
- Health care (11.9%)
- Educational services (11.5%)
- Accommodation & food services (8.9%)
- Construction (5.4%)
- Professional, scientific, technical services (4.4%)
- Administrative & support & waste management services (4.3%)
- Finance & insurance (3.2%)
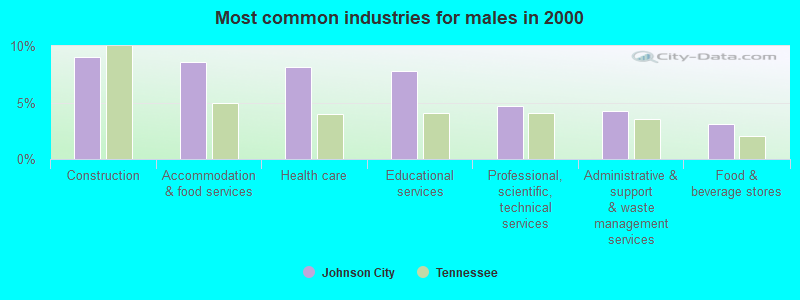
- Construction (9.0%)
- Accommodation & food services (8.6%)
- Health care (8.2%)
- Educational services (7.8%)
- Professional, scientific, technical services (4.7%)
- Administrative & support & waste management services (4.2%)
- Food & beverage stores (3.1%)
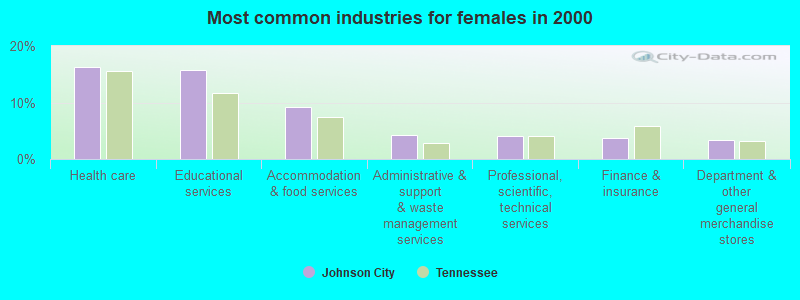
- Health care (16.2%)
- Educational services (15.8%)
- Accommodation & food services (9.2%)
- Administrative & support & waste management services (4.3%)
- Professional, scientific, technical services (4.0%)
- Finance & insurance (3.6%)
- Department & other general merchandise stores (3.4%)
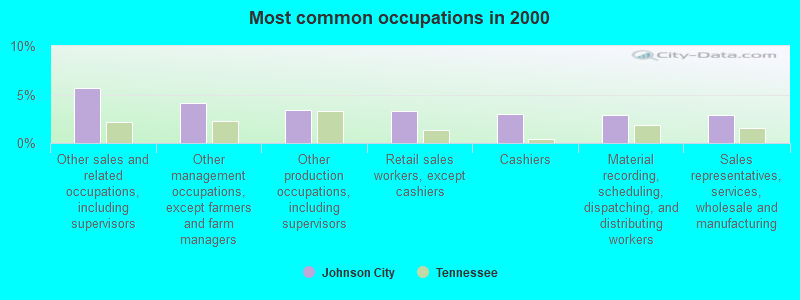
- Other sales and related occupations, including supervisors (5.7%)
- Other management occupations, except farmers and farm managers (4.1%)
- Other production occupations, including supervisors (3.4%)
- Retail sales workers, except cashiers (3.3%)
- Cashiers (3.0%)
- Material recording, scheduling, dispatching, and distributing workers (2.9%)
- Sales representatives, services, wholesale and manufacturing (2.8%)
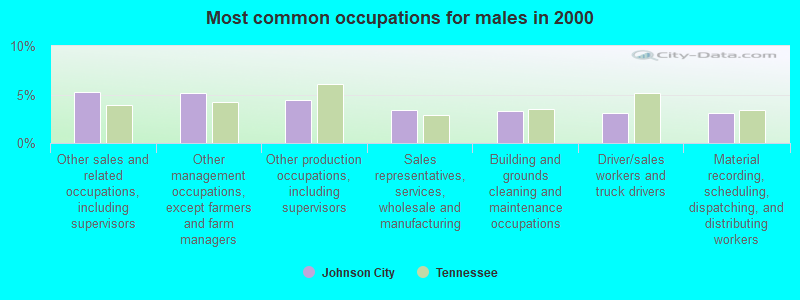
- Other sales and related occupations, including supervisors (5.3%)
- Other management occupations, except farmers and farm managers (5.2%)
- Other production occupations, including supervisors (4.5%)
- Sales representatives, services, wholesale and manufacturing (3.4%)
- Building and grounds cleaning and maintenance occupations (3.3%)
- Driver/sales workers and truck drivers (3.1%)
- Material recording, scheduling, dispatching, and distributing workers (3.1%)
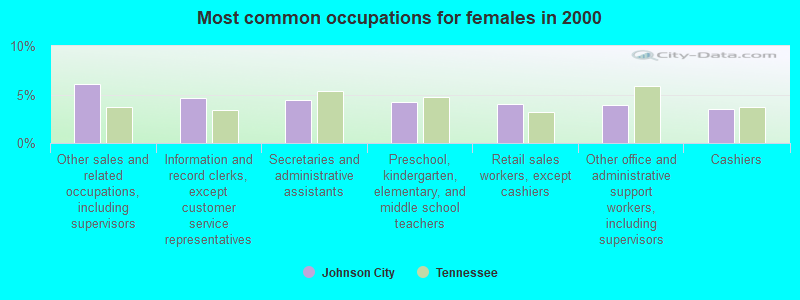
- Other sales and related occupations, including supervisors (6.1%)
- Information and record clerks, except customer service representatives (4.6%)
- Secretaries and administrative assistants (4.5%)
- Preschool, kindergarten, elementary, and middle school teachers (4.2%)
- Retail sales workers, except cashiers (4.0%)
- Other office and administrative support workers, including supervisors (3.9%)
- Cashiers (3.5%)
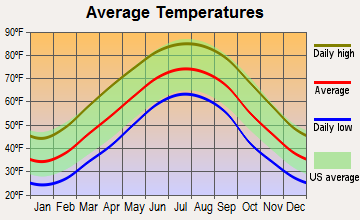
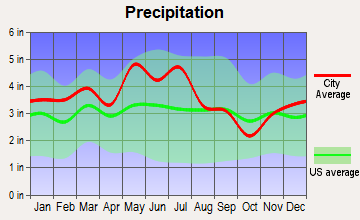
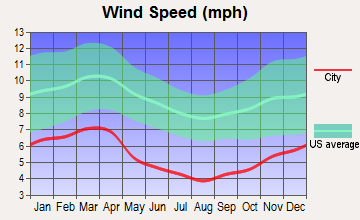
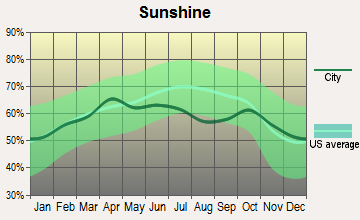
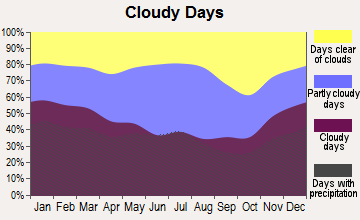
Average climate in Johnson City, Tennessee
Based on data reported by over 4,000 weather stations

|
|

(lower is better)
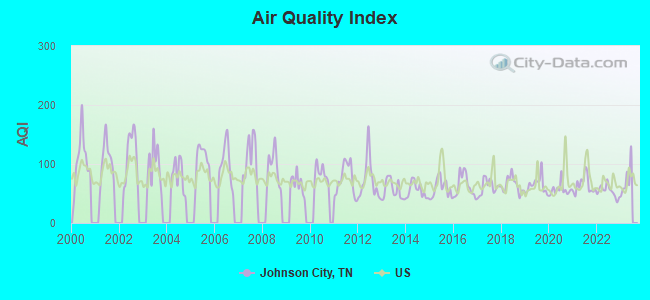
Air Quality Index (AQI) level in 2022 was 53.6. This is better than average.
| City: | 53.6 |
| U.S.: | 72.6 |
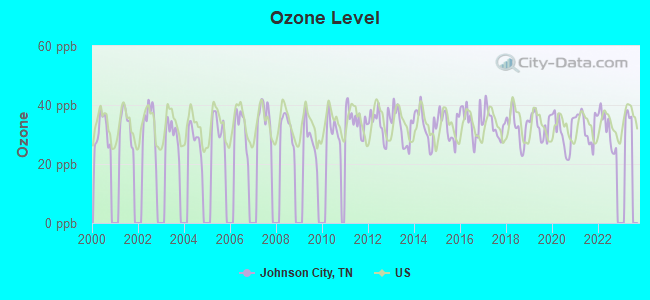
Ozone [ppb] level in 2022 was 31.7. This is about average. Closest monitor was 14.2 miles away from the city center.
| City: | 31.7 |
| U.S.: | 33.3 |
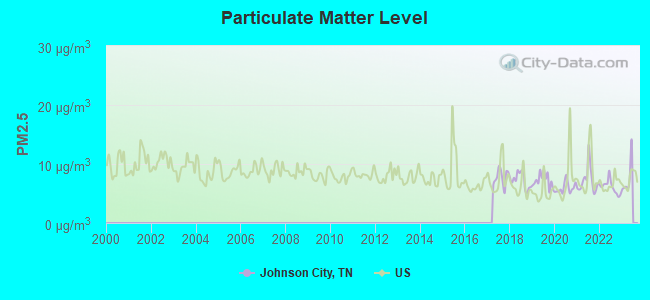
Particulate Matter (PM2.5) [µg/m3] level in 2022 was 6.10. This is better than average. Closest monitor was 16.3 miles away from the city center.
| City: | 6.10 |
| U.S.: | 8.11 |
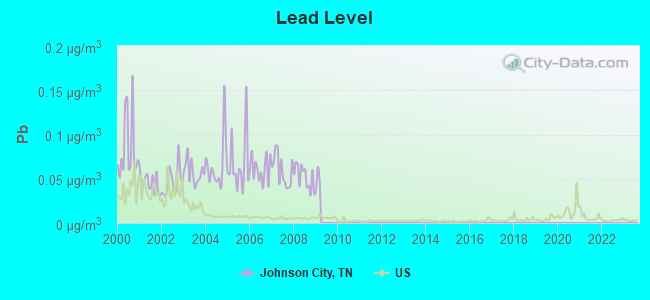
Lead (Pb) [µg/m3] level in 2008 was 0.0520. This is significantly worse than average. Closest monitor was 1.4 miles away from the city center.
| City: | 0.0520 |
| U.S.: | 0.0093 |
Tornado activity:
Johnson City-area historical tornado activity is significantly below Tennessee state average. It is 69% smaller than the overall U.S. average.
On 7/10/1980, a category F3 (max. wind speeds 158-206 mph) tornado 9.5 miles away from the Johnson City city center injured 12 people and caused between $50,000 and $500,000 in damages.
On 4/8/1957, a category F2 (max. wind speeds 113-157 mph) tornado 9.9 miles away from the city center caused between $500 and $5000 in damages.
Earthquake activity:
Johnson City-area historical earthquake activity is significantly above Tennessee state average. It is 25% greater than the overall U.S. average.On 8/9/2020 at 12:07:37, a magnitude 5.1 (5.1 MW, Depth: 4.7 mi, Class: Moderate, Intensity: VI - VII) earthquake occurred 71.9 miles away from Johnson City center
On 8/23/2011 at 17:51:04, a magnitude 5.8 (5.8 MW, Depth: 3.7 mi) earthquake occurred 267.8 miles away from Johnson City center
On 7/27/1980 at 18:52:21, a magnitude 5.2 (5.1 MB, 4.7 MS, 5.0 UK, 5.2 UK) earthquake occurred 155.5 miles away from the city center
On 11/30/1973 at 07:48:41, a magnitude 4.7 (4.7 MB, 4.6 ML, Class: Light, Intensity: IV - V) earthquake occurred 96.3 miles away from the city center
On 8/2/1974 at 08:52:09, a magnitude 4.9 (4.3 MB, 4.9 LG) earthquake occurred 170.5 miles away from the city center
On 11/23/2006 at 10:42:57, a magnitude 4.3 (4.3 MB) earthquake occurred 61.0 miles away from Johnson City center
Magnitude types: regional Lg-wave magnitude (LG), body-wave magnitude (MB), local magnitude (ML), surface-wave magnitude (MS), moment magnitude (MW)
Natural disasters:
The number of natural disasters in Washington County (9) is smaller than the US average (15).Major Disasters (Presidential) Declared: 5
Emergencies Declared: 2
Causes of natural disasters: Floods: 6, Storms: 5, Tornadoes: 2, Winds: 2, Heavy Rain: 1, Hurricane: 1, Snowfall: 1, Winter Storm: 1, Other: 1 (Note: some incidents may be assigned to more than one category).
Hospitals in Johnson City:
- (CLOSED) JAMES H AND CECILE C QUILLEN REHAB HOSP (2511 WESLEY ST BOX 5340)
- (CLOSED) WOODRIDGE HOSPITAL (403 STATE OF FRANKLIN RD)
- COMCARE INC SHADYBROOK (109 SHADYBROOK DRIVE)
- COMCARE INC/KING SPRINGS (1214 KING SPRINGS ROAD)
- FRANKLIN WOODS COMMUNITY HOSPITAL (Voluntary non-profit - Private, 300 MED TECH PARKWAY)
- JOHNSON CITY MEDICAL CENTER (Voluntary non-profit - Private, provides emergency services, 400 N STATE OF FRANKLIN RD)
- JOHNSON CITY SPECIALTY HOSPITAL (203 E WATAUGA AVE)
Nursing Homes in Johnson City:
- APPALACHIAN CHRISTIAN VILLAGE (2012 SHERWOOD DRIVE)
- ASBURY CENTER (BOONE FAIRVIEW STREETS)
- ASBURY PLACE AT JOHNSON CITY (105 WEST MYTRLE AVENUE)
- CHRISTIAN CARE CENTER OF JOHNSON CITY, INC (140 TECHNOLOGY LANE)
- COLONIAL HILL HEALTH CARE CENTER (ROUTE 4 BRISTOL HWY)
- FRANKLIN TRANSITIONAL CARE (400 NORTH STATE OF FRANKLIN ROAD)
- FRANKLIN TRANSITIONAL CARE (400 NORTH STATE OF FRANKLIN)
- LAKEBRIDGE HEALTH CARE CENTER (115 WOODLAWN DRIVE)
- NHC HEALTHCARE, JOHNSON CITY (3209 BRISTOL HWY)
Dialysis Facilities in Johnson City:
- DAVITA TENNESSEE VALLEY DIAL CNTR (107 WOODLAWN DR)
- FMC JOHNSON CITY (100 TECHNOLOGY LANE)
- SMOKIE MOUNTAIN DIALYSIS CENTER (101 MED TECH PARKWAY)
Home Health Centers in Johnson City:
Airports and heliports located in Johnson City:
- Johnson City Airport (0A4) (Runways: 1, Itinerant Ops: 1,000, Local Ops: 6,550, Military Ops: 100)
- Windmill Hill Airport (5TN2) (Runways: 1)
- Air Trade Center Heliport (TN57)
- Bell Helicopter Heliport (89TN)
- Johnson City Medical Center Heliport (TN91)
Colleges/Universities in Johnson City:
- East Tennessee State University (Full-time enrollment: 12,774; Public; Website: www.etsu.edu; Offers Doctor's degree)
- Jenny Lea Academy of Cosmetology and Aesthetics (Full-time enrollment: 164; Location: 222 E Unaka Ave; Private, for-profit; Website: www.jennyleaacademy.com)
- ITT Technical Institute-Johnson City (Full-time enrollment: 126; Location: 4721 Lake Park Dr; Private, for-profit; Website: www.itt-tech.edu)
- Emmanuel Christian Seminary (Full-time enrollment: 79; Location: One Walker Dr; Private, not-for-profit; Website: www.ecs.edu; Offers Doctor's degree)
Other colleges/universities with over 2000 students near Johnson City:
- Northeast State Community College (about 11 miles; Blountville, TN; Full-time enrollment: 4,480)
- King University (about 22 miles; Bristol, TN; FT enrollment: 2,472)
- Tusculum College (about 25 miles; Greeneville, TN; FT enrollment: 2,070)
- Appalachian State University (about 40 miles; Boone, NC; FT enrollment: 17,362)
- Walters State Community College (about 51 miles; Morristown, TN; FT enrollment: 4,359)
- University of North Carolina at Asheville (about 51 miles; Asheville, NC; FT enrollment: 3,312)
- Asheville-Buncombe Technical Community College (about 54 miles; Asheville, NC; FT enrollment: 6,992)
Public high schools in Johnson City:
- SCIENCE HILL HIGH SCHOOL (Students: 2,855, Location: 251 COTTY JONES LA, Grades: 9-12)
- UNIVERSITY SCHOOL (Students: 511, Location: 1 ALEXENDRA DR, Grades: KG-12)
- WASHINGTON COUNTY ADULT HIGH SCHOOL (Location: 2002 INDIAN RIDGE RD, Grades: 9-12)
- WASHINGTON COUNTY VIRTUAL SCHOOL (Location: 2002 INDIAN RIDGE RD, Grades: 9-12)
Private high school in Johnson City:
Biggest public elementary/middle schools in Johnson City:
- HAPPY VALLEY ELEMENTARY (Students: 659, Location: 1840 MILLIGAN HW, Grades: KG-4)
- LAKE RIDGE ELEMENTARY (Students: 562, Location: 100 LAKE RIDGE SQUARE, Grades: KG-4)
- FAIRMONT ELEMENTARY (Students: 465, Location: 1405 LESTER HARRIS RD, Grades: KG-4)
- TOWNE ACRES ELEMENTARY (Students: 437, Location: 2310 LARKSPUR DR, Grades: KG-4)
- BOONES CREEK MIDDLE SCHOOL (Students: 435, Location: 4352 NORTH ROAN ST, Grades: 5-8)
- NORTH SIDE ELEMENTARY (Students: 309, Location: 1000 N ROAN ST, Grades: PK-4)
- MOUNTAIN VIEW ELEMENTARY (Location: 907 KING SPRINGS RD, Grades: KG-4)
- WOODLAND ELEMENTARY (Location: 2303 INDIAN RIDGE RD, Grades: PK-4)
- SOUTH SIDE ELEMENTARY (Location: 1011 SOUTHWEST AV, Grades: PK-4)
- INDIAN TRAIL INTERMEDIATE SCHOOL (Location: 307 CAR MOL DR, Grades: 5-6)
Private elementary/middle schools in Johnson City:
User-submitted facts and corrections:
- milligan college is directly across from emmanuel school of religion. wjhl broadcast from johnson city
- Nearby college: Milligan College, a private liberal arts college established in 1866. Located 3 miles from Johnson City, near Elizabethton. Offers four-year undergraduate degrees and master's degrees (occupational therapy, business administration, and education).
Points of interest:
Notable locations in Johnson City: Brush Creek Sewage Treatment Plant (A), Fountain Square (B), Johnson City Industrial Park (C), Liberty Bell Complex (D), Pine Oaks Golf Course (E), Knob Creek (F), Johnson City Golf and Country Club (G), Tipton-Haynes Farm (H), James H and Cecile C Quillen Rehabilitation Hospital (I), Johnson City Fire Department Station 6 (J), Johnson City Fire Department Station 8 (K), Johnson City Fire Department Station 9 (L), Watauga Avenue Fire Station (M), Johnson City Fire Department Station 5 (N), Johnson City Hall (O), Indian Ridge Fire Station (P), Freedom Hall Civic Center (Q), Johnson City Fire Department Station 4 (R), Johnson City Fire Department Station 2 (S), Johnson City Fire Department Station 3 Headquarters (T). Display/hide their locations on the map
Shopping Centers: Center South Shopping Center (1), Central Shopping Center (2), Creekside Shopping Center (3), Holiday Shopping Center (4), Johnson City Plaza Shopping Center (5), Kens Plaza Shopping Center (6), King Springs Shopping Center (7), Landmark Village Shopping Center (8), Miracle Mall Shopping Center (9). Display/hide their locations on the map
Main business address in Johnson City: NN INC (A). Display/hide its location on the map
Churches in Johnson City include: Union Church (A), Snow Chapel (B), Westside Church (C), Antioch Baptist Church (D), West Market Street United Methodist Church (E), Watauga Avenue Presbyterian Church (F), Unaka Baptist Church (G), Tiner Hill Methodist Church (H), Thankful Baptist Church (I). Display/hide their locations on the map
Cemeteries: Mountain Home National Cemetery (1), Jobe Cemetery (2), Washington County Memory Gardens (3), Young-Lyle-Strickland Cemetery (4), Young Cemetery (5), White Cemetery (6), Tipton-Haynes Cemetery (7). Display/hide their locations on the map
Reservoir: Sampson-Wood Lake (A). Display/hide its location on the map
Creeks: Brush Creek (A), Carroll Creek (B), Catbird Creek (C), Knob Creek (D), Lick Creek (E). Display/hide their locations on the map
Parks in Johnson City include: Carver Park (1), Civitan Park (2), D R Beeson Park (3), Jaycee Park (4), Memorial Park (5), Lakeview Park (6), Lions Park (7), Massengill Memorial (8), New Kiwanis Park (9). Display/hide their locations on the map
Tourist attractions: Hands On Regional Museum (315 East Main Street) (1), Clubs & Organizations - Tipton-Haynes Historical Associates (Museums; 2620 South Roan Street) (2), Fun Adventure (Amusement & Theme Parks; 112 Sunset Drive) (3), Adventure Travel (Recreational Trips & Guides; 245 Highland Hills Drive) (4). Display/hide their approximate locations on the map
Hotels: Fox Motel (3406 W Market St) (1), Carnegie Hotel and Spa (1216 West State Of Franklin Road) (2), Carnegie Hotel - Wellington's Restaurant (1216 West State Of Franklin Road) (3), Hampton Inn Johnson City (508 North State Of Franklin Road) (4), Garden Plaza - Johnson City (211 Mockingbird Ln) (5), Doubletree Hotel Johnson City (211 Mockingbird Lane) (6), Best Western Johnson City Htl (2406 North Roan Street) (7), Comfort Suites Johnson City (3118 Browns Mill Road) (8), Holiday Inn (101 West Springbrook Drive) (9). Display/hide their approximate locations on the map
Courts: Johnson City City - Government Offices- Juvenile Court (102 West Myrtle Avenue) (1), Federal Bureau Of Investigation (208 Sunset Drive) (2), Washington County Tn Offices - Chancery Court- Clerk And Master- Downtown Ce (Downtown Centre) (3), Washington County Tn Offices - Sessions Court- Downtown Centre (Downtown Centre) (4), Washington County Tn Offices - Circuit Court Clerk- Downtown Centre (Downtown Centre) (5). Display/hide their approximate locations on the map
Birthplace of: Ed Whitson - Baseball player, Joe Bowman (marksman) - Recipient of the Purple Heart medal, Aubrayo Franklin - 2005 NFL player (Baltimore Ravens, born: Aug 27, 1980), Brad Teague - Nextel Cup series NASCAR driver (born: Dec 9, 1947), Catherine Marshall - Book editor, David Cole (record producer) - Record producer, Drew Johnson (politics) - Journalist, Earl Gladstone Hunt, Jr. - Autobiographer, Edward K. Reedy - Director of the Georgia Tech Research Institute, Fred Archer (baseball) - Professional baseball player.
Drinking water stations with addresses in Johnson City and their reported violations in the past:
JOHNSON CITY WATER DEPT (Population served: 101,832, Surface water):Past monitoring violations:
- Monitoring, Repeat Major (TCR) - In JUN-2008, Contaminant: Coliform (TCR). Follow-up actions: St Violation/Reminder Notice (JUL-31-2008), St Public Notif requested (JUL-31-2008), St Compliance achieved (JUL-31-2008)
- Monitoring and Reporting (DBP) - Between APR-2008 and JUN-2008, Contaminant: Chlorine. Follow-up actions: St Violation/Reminder Notice (JUL-31-2008), St Public Notif requested (JUL-31-2008), St Compliance achieved (SEP-30-2008)
- Monitoring and Reporting (DBP) - Between OCT-2007 and DEC-2007, Contaminant: CARBON, TOTAL. Follow-up actions: St Public Notif requested (DEC-03-2007), St Violation/Reminder Notice (DEC-03-2007), St Compliance achieved (DEC-31-2007)
| This city: | 2.2 people |
| Tennessee: | 2.5 people |
| This city: | 55.4% |
| Whole state: | 67.3% |
| This city: | 6.2% |
| Whole state: | 5.8% |
Likely homosexual households (counted as self-reported same-sex unmarried-partner households)
- Lesbian couples: 0.4% of all households
- Gay men: 0.4% of all households
People in group quarters in Johnson City in 2010:
- 2,657 people in college/university student housing
- 626 people in nursing facilities/skilled-nursing facilities
- 239 people in residential treatment centers for adults
- 152 people in other noninstitutional facilities
- 104 people in local jails and other municipal confinement facilities
- 104 people in emergency and transitional shelters (with sleeping facilities) for people experiencing homelessness
- 32 people in group homes intended for adults
- 11 people in correctional facilities intended for juveniles
- 9 people in residential treatment centers for juveniles (non-correctional)
- 2 people in workers' group living quarters and job corps centers
People in group quarters in Johnson City in 2000:
- 1,919 people in college dormitories (includes college quarters off campus)
- 708 people in nursing homes
- 390 people in hospitals/wards and hospices for chronically ill
- 390 people in other hospitals or wards for chronically ill
- 205 people in other noninstitutional group quarters
- 44 people in local jails and other confinement facilities (including police lockups)
- 33 people in homes for the mentally ill
- 32 people in homes for the mentally retarded
- 16 people in short-term care, detention or diagnostic centers for delinquent children
- 13 people in unknown juvenile institutions
- 7 people in other group homes
- 5 people in orthopedic wards and institutions for the physically handicapped
Banks with most branches in Johnson City (2011 data):
- Jefferson Federal Bank: Boones Creek Branch, West Walnut Street Branch, West Oakland Avenue Branch, North Roan Branch. Info updated 2008/12/04: Bank assets: $530.9 mil, Deposits: $432.6 mil, headquarters in Morristown, TN, negative income in the last year, Commercial Lending Specialization, 13 total offices, Holding Company: Jefferson Bancshares, Inc.
- SunTrust Bank: Market Street Medical Center Branch, Johnson City Main Branch, Broadway Branch, Walnut Street Branch. Info updated 2010/05/27: Bank assets: $171,291.7 mil, Deposits: $129,833.2 mil, headquarters in Atlanta, GA, positive income, Commercial Lending Specialization, 1716 total offices, Holding Company: Suntrust Banks, Inc.
- First Tennessee Bank, National Association: North Roan Branch, State Of Franklin Branch, Johnson City Crossings Financial Cen, North Roan Branch. Info updated 2009/09/08: Bank assets: $24,563.4 mil, Deposits: $16,402.1 mil, headquarters in Memphis, TN, positive income, Commercial Lending Specialization, 180 total offices, Holding Company: First Horizon National Corporation
- First Community Bank: Poeple's Community Branch, Johnson City Branch, Boones Creek Branch. Info updated 2011/07/12: Bank assets: $2,144.1 mil, Deposits: $1,561.3 mil, headquarters in Bluefield, VA, positive income, Commercial Lending Specialization, 58 total offices, Holding Company: First Community Bancshares, Inc.
- Bank of Tennessee: University Branch, Mountcastle Branch, Medtech Branch. Info updated 2006/11/03: Bank assets: $640.0 mil, Deposits: $524.3 mil, headquarters in Kingsport, TN, positive income, Commercial Lending Specialization, 15 total offices, Holding Company: Banctenn Corp.
- Branch Banking and Trust Company: State Of Franklin Branch, Johnson City University Parkway Bran, Johnson City Main Branch. Info updated 2010/03/29: Bank assets: $168,867.6 mil, Deposits: $127,549.5 mil, headquarters in Winston Salem, NC, positive income, Commercial Lending Specialization, 1793 total offices, Holding Company: Bb&T Corporation
- Regions Bank: North Johnson City Branch, University - Johnson City Branch, East Watauga Branch. Info updated 2011/02/24: Bank assets: $123,368.2 mil, Deposits: $98,301.3 mil, headquarters in Birmingham, AL, positive income, Commercial Lending Specialization, 1778 total offices, Holding Company: Regions Financial Corporation
- Capital Bank, National Association: State Of Franklin Branch, South Roan Branch, Boones Creek Branch. Info updated 2011/09/21: Bank assets: $6,448.0 mil, Deposits: $5,135.4 mil, headquarters in Miami, FL, positive income, Commercial Lending Specialization, 152 total offices, Holding Company: North American Financial Holdings, Inc.
- Bank of America, National Association: North Roane Branch at 2105 North Roane Street, branch established on 1978/05/15; West Market Street at 1616 West Market Street, branch established on 1974/12/18. Info updated 2009/11/18: Bank assets: $1,451,969.3 mil, Deposits: $1,077,176.8 mil, headquarters in Charlotte, NC, positive income, 5782 total offices, Holding Company: Bank Of America Corporation
- 12 other banks with 15 local branches
For population 15 years and over in Johnson City:
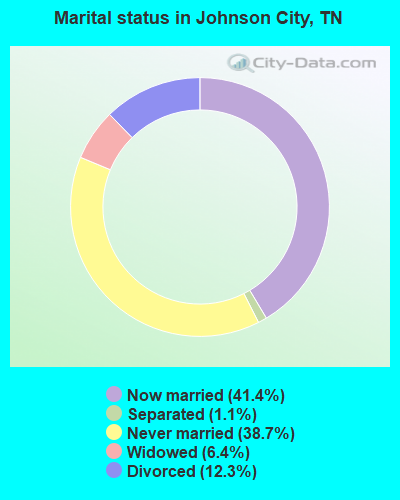
- Never married: 38.7%
- Now married: 41.4%
- Separated: 1.1%
- Widowed: 6.4%
- Divorced: 12.3%
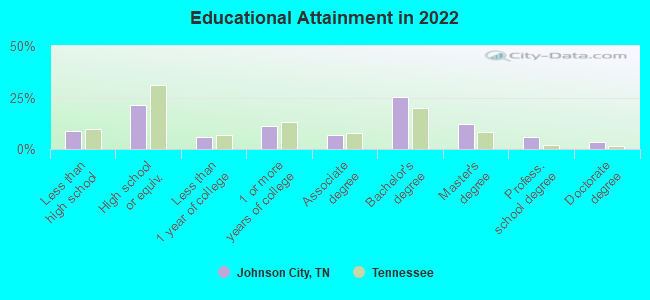
For population 25 years and over in Johnson City:
- High school or higher: 91.3%
- Bachelor's degree or higher: 46.5%
- Graduate or professional degree: 21.1%
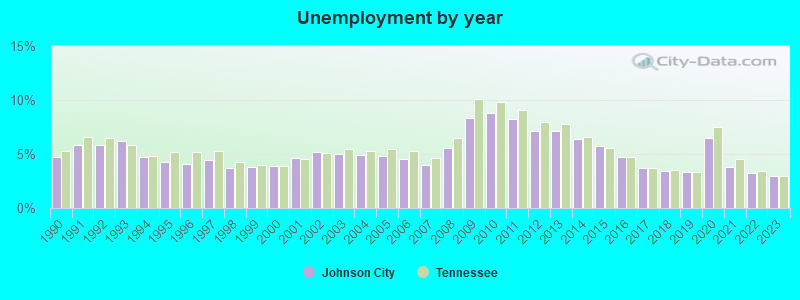
- Unemployed: 5.7%
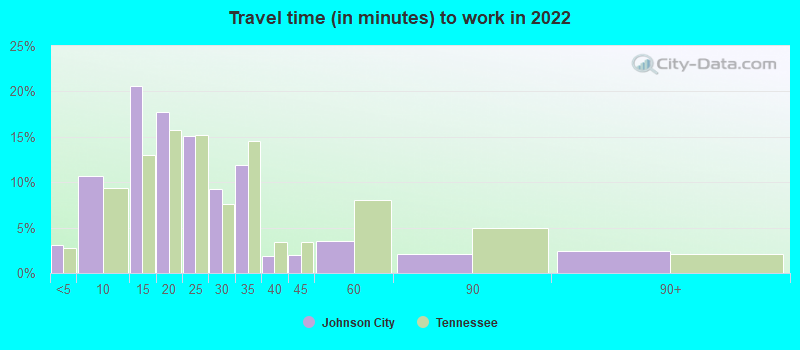
- Mean travel time to work (commute): 17.8 minutes
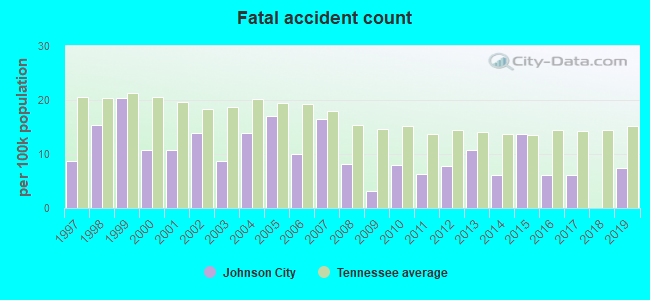
| Here: | 12.2 |
| Tennessee average: | 11.4 |
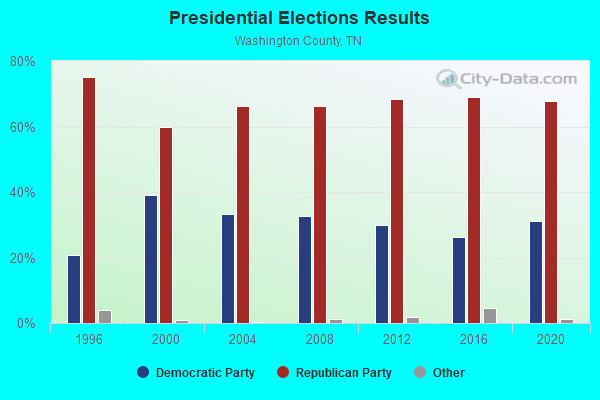
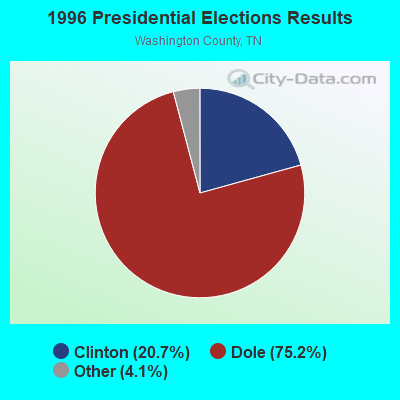
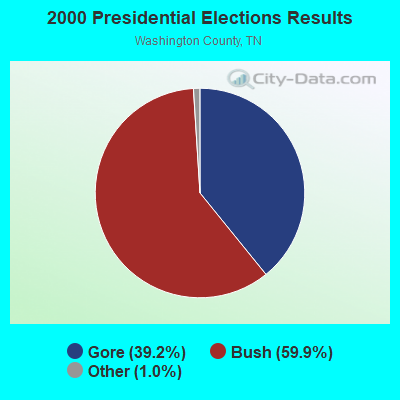

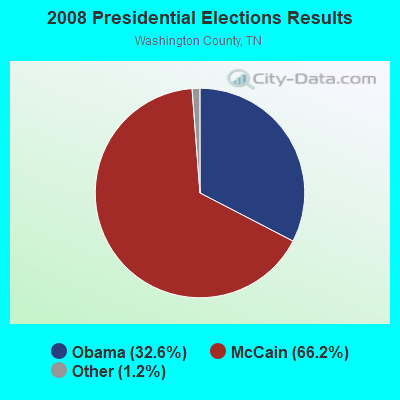
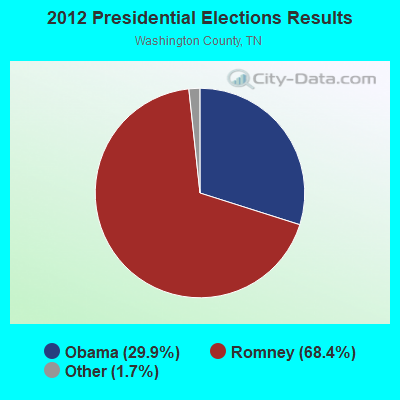
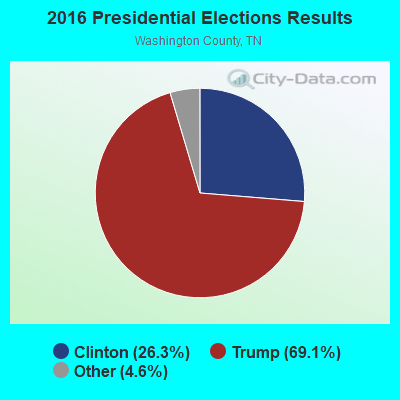

Graphs represent county-level data. Detailed 2008 Election Results
Religion statistics for Johnson City, TN (based on Washington County data)
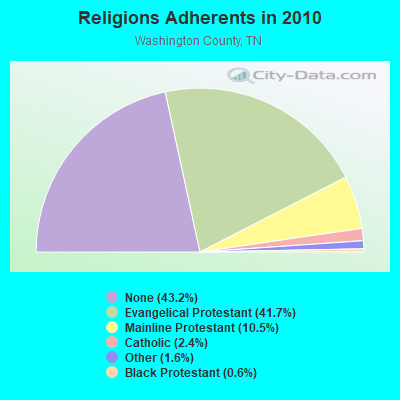
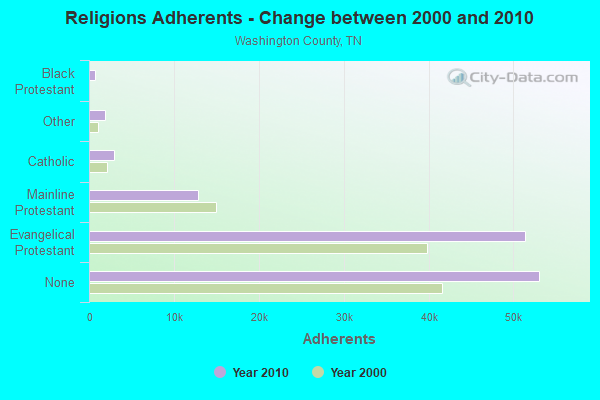
| Religion | Adherents | Congregations |
|---|---|---|
| Evangelical Protestant | 51,327 | 182 |
| Mainline Protestant | 12,877 | 50 |
| Catholic | 3,000 | 1 |
| Other | 1,924 | 8 |
| Black Protestant | 736 | 5 |
| Orthodox | 45 | 1 |
| None | 53,070 | - |
Food Environment Statistics:
| Washington County: | 1.72 / 10,000 pop. |
| Tennessee: | 1.99 / 10,000 pop. |
| This county: | 0.26 / 10,000 pop. |
| Tennessee: | 0.17 / 10,000 pop. |
| Washington County: | 0.09 / 10,000 pop. |
| Tennessee: | 0.65 / 10,000 pop. |
| Washington County: | 5.07 / 10,000 pop. |
| Tennessee: | 5.16 / 10,000 pop. |
| Washington County: | 8.16 / 10,000 pop. |
| State: | 6.56 / 10,000 pop. |
| Washington County: | 10.7% |
| Tennessee: | 11.4% |
| Here: | 29.0% |
| State: | 30.2% |
| This county: | 14.0% |
| Tennessee: | 13.5% |
Health and Nutrition:
| This city: | 50.9% |
| Tennessee: | 49.3% |
| Johnson City: | 48.4% |
| Tennessee: | 46.1% |
| Johnson City: | 28.4 |
| State: | 28.8 |
| This city: | 20.3% |
| Tennessee: | 21.0% |
| This city: | 10.8% |
| Tennessee: | 10.5% |
| Johnson City: | 6.9 |
| Tennessee: | 6.8 |
| Johnson City: | 33.1% |
| Tennessee: | 33.9% |
| Johnson City: | 57.6% |
| Tennessee: | 55.9% |
| Johnson City: | 78.8% |
| Tennessee: | 79.1% |
More about Health and Nutrition of Johnson City, TN Residents
| Local government employment and payroll (March 2022) | |||||
| Function | Full-time employees | Monthly full-time payroll | Average yearly full-time wage | Part-time employees | Monthly part-time payroll |
|---|---|---|---|---|---|
| Elementary and Secondary - Instruction | 849 | $3,795,898 | $53,652 | 65 | $104,082 |
| Elementary and Secondary - Other Total | 201 | $636,376 | $37,993 | 108 | $109,504 |
| Electric Power | 192 | $1,375,337 | $85,959 | 10 | $5,941 |
| Police Protection - Officers | 144 | $629,338 | $52,445 | 0 | $0 |
| Firefighters | 123 | $534,351 | $52,132 | 0 | $0 |
| Water Supply | 120 | $454,779 | $45,478 | 1 | $1,364 |
| Streets and Highways | 87 | $361,464 | $49,857 | 5 | $7,110 |
| Parks and Recreation | 69 | $235,957 | $41,036 | 63 | $52,293 |
| Transit | 57 | $225,025 | $47,374 | 32 | $48,812 |
| Solid Waste Management | 52 | $179,014 | $41,311 | 0 | $0 |
| Other and Unallocable | 50 | $197,762 | $47,463 | 10 | $12,072 |
| Sewerage | 49 | $203,734 | $49,894 | 0 | $0 |
| Other Government Administration | 43 | $248,582 | $69,372 | 2 | $2,653 |
| Financial Administration | 34 | $162,863 | $57,481 | 0 | $0 |
| Local Libraries | 23 | $87,564 | $45,686 | 15 | $16,997 |
| Police - Other | 15 | $46,841 | $37,473 | 7 | $8,124 |
| Judicial and Legal | 14 | $59,467 | $50,972 | 1 | $1,052 |
| Correction | 8 | $25,285 | $37,928 | 0 | $0 |
| Fire - Other | 6 | $26,199 | $52,398 | 0 | $0 |
| Totals for Government | 2,136 | $9,485,837 | $53,291 | 319 | $370,003 |
Johnson City government finances - Expenditure in 2021 (per resident):
- Construction - Electric Utilities: $15,599,000 ($215.12)
General - Other: $15,033,000 ($207.31)
Sewerage: $11,487,000 ($158.41)
Water Utilities: $11,487,000 ($158.41)
Solid Waste Management: $3,007,000 ($41.47)
Elementary and Secondary Education: $166,000 ($2.29)
Libraries: $7,000 ($0.10)
- Current Operations - Electric Utilities: $171,544,000 ($2365.67)
Elementary and Secondary Education: $88,819,000 ($1224.85)
Police Protection: $14,575,000 ($201.00)
General - Other: $13,298,000 ($183.39)
Solid Waste Management: $12,063,000 ($166.35)
Regular Highways: $11,982,000 ($165.24)
Sewerage: $11,637,000 ($160.48)
Local Fire Protection: $11,376,000 ($156.88)
Water Utilities: $10,243,000 ($141.26)
Parks and Recreation: $7,325,000 ($101.01)
Transit Utilities: $3,735,000 ($51.51)
Libraries: $2,172,000 ($29.95)
Financial Administration: $1,813,000 ($25.00)
Judicial and Legal Services: $1,567,000 ($21.61)
Central Staff Services: $1,559,000 ($21.50)
General Public Buildings: $1,149,000 ($15.85)
Housing and Community Development: $548,000 ($7.56)
- Electric Utilities - Interest on Debt: $1,323,000 ($18.24)
- General - Interest on Debt: $5,507,000 ($75.94)
- Intergovernmental to Local - Other - Electric Utilities: $5,617,000 ($77.46)
Other - General - Other: $136,000 ($1.88)
Other - Elementary and Secondary Education: $3,000 ($0.04)
- Other Capital Outlay - General - Other: $4,504,000 ($62.11)
Elementary and Secondary Education: $2,805,000 ($38.68)
Electric Utilities: $2,152,000 ($29.68)
- Total Salaries and Wages: $54,320,000 ($749.10)
- Water Utilities - Interest on Debt: $1,313,000 ($18.11)
Johnson City government finances - Revenue in 2021 (per resident):
- Charges - Sewerage: $21,971,000 ($302.99)
Solid Waste Management: $14,496,000 ($199.91)
Elementary and Secondary Education - Other: $6,453,000 ($88.99)
Other: $1,777,000 ($24.51)
Parks and Recreation: $1,433,000 ($19.76)
Elementary and Secondary Education School Tuition and Transportation: $257,000 ($3.54)
Elementary and Secondary Education School Lunch: $65,000 ($0.90)
- Federal Intergovernmental - Housing and Community Development: $370,000 ($5.10)
Transit Utilities: $273,000 ($3.76)
Education: $188,000 ($2.59)
Highways: $172,000 ($2.37)
Other: $114,000 ($1.57)
General Local Government Support: $31,000 ($0.43)
- Local Intergovernmental - Education: $47,678,000 ($657.50)
Other: $3,553,000 ($49.00)
- Miscellaneous - General Revenue - Other: $1,946,000 ($26.84)
Interest Earnings: $1,438,000 ($19.83)
Fines and Forfeits: $1,285,000 ($17.72)
Rents: $599,000 ($8.26)
Donations From Private Sources: $59,000 ($0.81)
- Revenue - Electric Utilities: $197,952,000 ($2729.85)
Water Utilities: $18,725,000 ($258.23)
Transit Utilities: $448,000 ($6.18)
- State Intergovernmental - Education: $47,584,000 ($656.20)
General Local Government Support: $8,185,000 ($112.87)
Transit Utilities: $3,936,000 ($54.28)
Highways: $2,878,000 ($39.69)
Other: $1,905,000 ($26.27)
Housing and Community Development: $188,000 ($2.59)
- Tax - Property: $60,572,000 ($835.31)
General Sales and Gross Receipts: $41,277,000 ($569.23)
Occupation and Business License - Other: $3,379,000 ($46.60)
Alcoholic Beverage Sales: $3,183,000 ($43.89)
Other Selective Sales: $2,211,000 ($30.49)
Other License: $964,000 ($13.29)
Public Utilities Sales: $847,000 ($11.68)
Johnson City government finances - Debt in 2021 (per resident):
- Long Term Debt - Beginning Outstanding - Unspecified Public Purpose: $214,255,000 ($2954.67)
Outstanding Unspecified Public Purpose: $154,183,000 ($2126.25)
Retired Unspecified Public Purpose: $60,072,000 ($828.42)
Beginning Outstanding - Public Debt for Private Purpose: $317,000 ($4.37)
Outstanding Nonguaranteed - Industrial Revenue: $241,000 ($3.32)
Retired Nonguaranteed - Public Debt for Private Purpose: $76,000 ($1.05)
Johnson City government finances - Cash and Securities in 2021 (per resident):
- Other Funds - Cash and Securities: $136,835,000 ($1887.01)
- Sinking Funds - Cash and Securities: $55,316,000 ($762.83)
| Businesses in Johnson City, TN | ||||
| Name | Count | Name | Count | |
|---|---|---|---|---|
| AT&T | 1 | Little Caesars Pizza | 3 | |
| Abercrombie & Fitch | 1 | Long John Silver's | 3 | |
| Ace Hardware | 1 | Lowe's | 1 | |
| Advance Auto Parts | 3 | Marriott | 1 | |
| Aeropostale | 1 | MasterBrand Cabinets | 3 | |
| American Eagle Outfitters | 1 | Maurices | 1 | |
| Applebee's | 1 | Mazda | 1 | |
| Arby's | 2 | McDonald's | 6 | |
| Ashley Furniture | 1 | Men's Wearhouse | 2 | |
| AutoZone | 2 | Motel 6 | 1 | |
| Barnes & Noble | 1 | Motherhood Maternity | 1 | |
| Baskin-Robbins | 1 | New Balance | 2 | |
| Bath & Body Works | 1 | Nike | 12 | |
| Bed Bath & Beyond | 1 | Nissan | 1 | |
| Best Western | 1 | Office Depot | 1 | |
| Blockbuster | 3 | OfficeMax | 1 | |
| Burger King | 2 | Old Navy | 1 | |
| CVS | 4 | Olive Garden | 1 | |
| Catherines | 1 | Outback | 1 | |
| Chevrolet | 1 | Outback Steakhouse | 1 | |
| Chick-Fil-A | 3 | Pac Sun | 1 | |
| Chico's | 1 | Panera Bread | 1 | |
| Chuck E. Cheese's | 1 | Papa John's Pizza | 2 | |
| Coldwater Creek | 1 | Payless | 1 | |
| Comfort Inn | 1 | Penske | 1 | |
| Comfort Suites | 1 | PetSmart | 1 | |
| Cracker Barrel | 1 | Pier 1 Imports | 1 | |
| Curves | 1 | Pizza Hut | 2 | |
| Dairy Queen | 2 | Plato's Closet | 1 | |
| Days Inn | 1 | Quiznos | 1 | |
| Domino's Pizza | 2 | RadioShack | 2 | |
| DressBarn | 1 | Ramada | 1 | |
| Dressbarn | 1 | Red Lobster | 1 | |
| Express | 1 | Red Roof Inn | 1 | |
| Famous Footwear | 1 | Rite Aid | 1 | |
| FedEx | 15 | Ruby Tuesday | 1 | |
| Finish Line | 1 | Ryan's Grill | 1 | |
| Ford | 1 | SAS Shoes | 1 | |
| Forever 21 | 1 | SONIC Drive-In | 2 | |
| GNC | 1 | Sam's Club | 1 | |
| GameStop | 3 | Sears | 3 | |
| Gap | 1 | Shoe Carnival | 1 | |
| Goodwill | 2 | Sleep Inn | 1 | |
| Gymboree | 1 | Spencer Gifts | 1 | |
| H&R Block | 4 | Sprint Nextel | 3 | |
| Hardee's | 2 | Starbucks | 1 | |
| Haworth | 1 | Subaru | 1 | |
| Hilton | 2 | Subway | 6 | |
| Holiday Inn | 2 | Super 8 | 1 | |
| Hollister Co. | 1 | T-Mobile | 5 | |
| Home Depot | 1 | T.J.Maxx | 1 | |
| Honda | 1 | Taco Bell | 2 | |
| Hot Topic | 1 | Talbots | 1 | |
| Hyundai | 1 | Target | 1 | |
| IHOP | 1 | Toyota | 1 | |
| JCPenney | 1 | Toys"R"Us | 1 | |
| JoS. A. Bank | 1 | U-Haul | 6 | |
| Jones New York | 3 | UPS | 18 | |
| Journeys | 1 | Vans | 3 | |
| Justice | 1 | Verizon Wireless | 1 | |
| KFC | 2 | Victoria's Secret | 1 | |
| Kincaid | 2 | Volkswagen | 1 | |
| Kmart | 1 | Waffle House | 1 | |
| Kohl's | 1 | Walgreens | 4 | |
| Kroger | 3 | Walmart | 2 | |
| La-Z-Boy | 2 | Wendy's | 2 | |
| Lane Furniture | 4 | Wet Seal | 1 | |
| LensCrafters | 1 | |||
Strongest AM radio stations in Johnson City:
- WETB (790 AM; 5 kW; JOHNSON CITY, TN; Owner: MOUNTAIN SIGNALS, INC.)
- WKTP (1590 AM; 10 kW; JONESBOROUGH, TN; Owner: HOLSTON VALLEY BROADCASTING CORP.)
- WPWT (870 AM; daytime; 10 kW; COLONIAL HEIGHTS, TN; Owner: INFORMATION COMMUNICATIONS CORP.)
- WJCW (910 AM; 5 kW; JOHNSON CITY, TN; Owner: CITADEL BROADCASTING COMPANY)
- WHGG (1090 AM; daytime; 10 kW; KINGSPORT, TN; Owner: APPALACHIAN EDUCATIONAL COMMUNICATIO)
- WGOC (640 AM; 10 kW; BLOUNTVILLE, TN; Owner: CITADEL BROADCASTING COMPANY)
- WZAP (690 AM; 10 kW; BRISTOL, VA; Owner: RAM COMMUNICATIONS, INC.)
- WFGW (1010 AM; 50 kW; BLACK MOUNTAIN, NC; Owner: BLUE RIDGE BROADCASTING CORP.)
- WEMB (1420 AM; 5 kW; ERWIN, TN; Owner: W E M B, INC.)
- WKIN (1320 AM; 5 kW; KINGSPORT, TN; Owner: CITADEL BROADCASTING COMPANY)
- WBEJ (1240 AM; 1 kW; ELIZABETHTON, TN; Owner: CB RADIO, INC.)
- WHHQ (1520 AM; daytime; 1 kW; ELIZABETHTON, TN)
- WFHG (980 AM; 5 kW; BRISTOL, VA; Owner: BRISTOL BROADCASTING COMPANY, INC.)
Strongest FM radio stations in Johnson City:
- WQUT (101.5 FM; JOHNSON CITY, TN; Owner: CITADEL BROADCASTING COMPANY)
- WPJO (99.3 FM; ELIZABETHTON, TN; Owner: BRISTOL BROADCASTING COMPANY, INC.)
- WHCB (91.5 FM; BRISTOL, TN; Owner: APPALACHIAN EDUC. COMMUNICATION CORP)
- WETS-FM (89.5 FM; JOHNSON CITY, TN; Owner: EAST TENNESSEE STATE UNIVERSITY)
- WXBQ-FM (96.9 FM; BRISTOL, TN; Owner: BRISTOL BROADCASTING COMPANY, INC.)
- W214AP (90.7 FM; JOHNSON CITY, TN; Owner: THE MOODY BIBLE INSTITUTE OF CHICAGO)
- WTFM (98.5 FM; KINGSPORT, TN; Owner: HOLSTON VALLEY BROADCASTING CORP.)
- WCQR-FM (88.3 FM; KINGSPORT, TN; Owner: POSITIVE ALTERNATIVE RADIO, INC.)
- WRZK (95.9 FM; COLONIAL HEIGHTS, TN; Owner: MURRAY COMMUNICATIONS)
- WMIT (106.9 FM; BLACK MOUNTAIN, NC; Owner: BLUE RIDGE BROADCASTING CORPORATION)
- WECR-FM (102.3 FM; BEECH MOUNTAIN, NC; Owner: RONDINARO BROADCASTING, INC)
- WNCW (88.7 FM; SPINDALE, NC; Owner: ISOTHERMAL COMMUNITY COLLEGE)
- WCSK (90.3 FM; KINGSPORT, TN; Owner: KINGSPORT CITY SCHOOLS BD. OF EDUC .)
- WZJS (100.7 FM; BANNER ELK, NC; Owner: HIGHLAND COMMUNICATIONS ASSOCIATES, LLC)
- WAEZ (94.9 FM; GREENEVILLE, TN; Owner: BRISTOL BROADCASTING COMPANY, INC.)
- W249AH (97.7 FM; JOHNSON CITY, TN; Owner: HOLSTON VALLEY BROADCASTING CORP.)
- WKOS (104.9 FM; KINGSPORT, TN; Owner: CITADEL BROADCASTING COMPANY)
- WAXM (93.5 FM; BIG STONE GAP, VA; Owner: VALLEY BROADCASTING, INC.)
- W285DG (104.9 FM; BOONE, NC; Owner: CITADEL BROADCASTING COMPANY)
- W223AA (92.5 FM; BIG STONE GAP, VA; Owner: VALLEY BROADCASTING, INC.)
TV broadcast stations around Johnson City:
- WCYB-TV (Channel 5; BRISTOL, VA; Owner: APPALACHIAN BROADCASTING CORP.)
- WASV-TV (Channel 62; ASHEVILLE, NC; Owner: MEDIA GENERAL BROADCASTING OF SOUTH CAROLINA HOLDINGS, INC.)
- WOPI-CA (Channel 9; BRISTOL,VA/KINGSPORT, TN; Owner: HOLSTON VALLEY BROADCASTING CORPORATION)
- WKPT-LP (Channel 25; KINGSPORT, TN; Owner: HOLSTON VALLEY BROADCASTING CORP.)
- WKPT-TV (Channel 19; KINGSPORT, TN; Owner: HOLSTON VALLEY BROADCASTING CORP.)
- WJHL-TV (Channel 11; JOHNSON CITY, TN; Owner: MEDIA GENERAL COMMUNICATIONS, INC.)
- WAPK-CA (Channel 36; BRISTOL,VA/KINGSPORT, TN; Owner: HOLSTON VALLEY BROADCASTING CORPORATION)
- National Bridge Inventory (NBI) Statistics
- 258Number of bridges
- 2,434ft / 742mTotal length
- $63,884,000Total costs
- 3,661,285Total average daily traffic
- 274,575Total average daily truck traffic
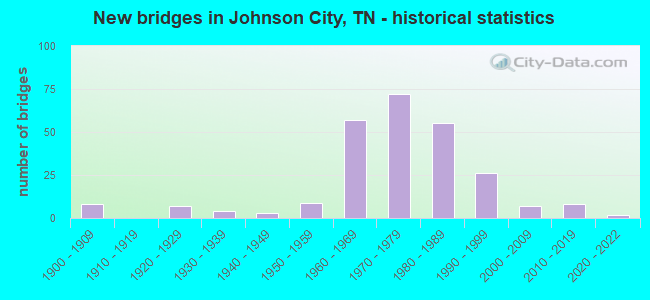
- New bridges - historical statistics
- 81900-1909
- 71920-1929
- 41930-1939
- 31940-1949
- 91950-1959
- 571960-1969
- 721970-1979
- 551980-1989
- 261990-1999
- 72000-2009
- 82010-2019
- 22020-2022
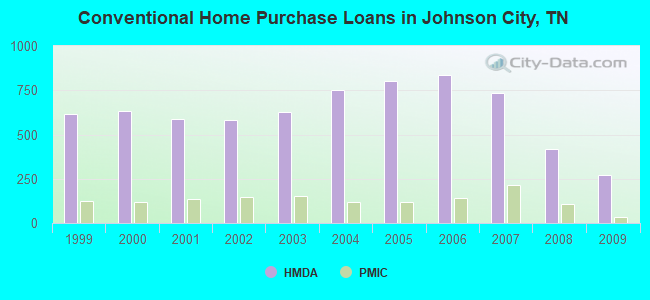
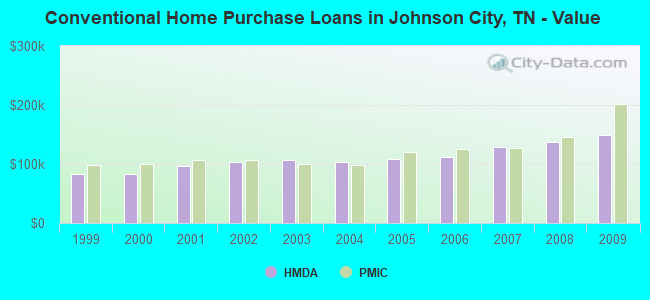
| Home Mortgage Disclosure Act Aggregated Statistics For Year 2009 (Based on 7 full and 7 partial tracts) | ||||||||||||||
| A) FHA, FSA/RHS & VA Home Purchase Loans | B) Conventional Home Purchase Loans | C) Refinancings | D) Home Improvement Loans | E) Loans on Dwellings For 5+ Families | F) Non-occupant Loans on < 5 Family Dwellings (A B C & D) | G) Loans On Manufactured Home Dwelling (A B C & D) | ||||||||
|---|---|---|---|---|---|---|---|---|---|---|---|---|---|---|
| Number | Average Value | Number | Average Value | Number | Average Value | Number | Average Value | Number | Average Value | Number | Average Value | Number | Average Value | |
| LOANS ORIGINATED | 159 | $122,853 | 269 | $149,806 | 776 | $147,818 | 59 | $64,105 | 19 | $633,123 | 134 | $130,682 | 8 | $53,080 |
| APPLICATIONS APPROVED, NOT ACCEPTED | 9 | $118,796 | 15 | $137,221 | 81 | $136,779 | 2 | $71,720 | 0 | $0 | 5 | $128,444 | 2 | $55,065 |
| APPLICATIONS DENIED | 28 | $121,470 | 53 | $115,265 | 230 | $129,741 | 24 | $33,949 | 1 | $17,500 | 30 | $79,873 | 8 | $57,990 |
| APPLICATIONS WITHDRAWN | 18 | $121,963 | 24 | $129,689 | 142 | $153,927 | 6 | $148,837 | 0 | $0 | 6 | $126,937 | 1 | $42,210 |
| FILES CLOSED FOR INCOMPLETENESS | 3 | $123,893 | 3 | $120,727 | 38 | $125,073 | 2 | $96,395 | 1 | $800,000 | 3 | $84,490 | 0 | $0 |
Detailed mortgage data for all 15 tracts in Johnson City, TN
| Private Mortgage Insurance Companies Aggregated Statistics For Year 2009 (Based on 6 full and 7 partial tracts) | ||||
| A) Conventional Home Purchase Loans | B) Refinancings | |||
|---|---|---|---|---|
| Number | Average Value | Number | Average Value | |
| LOANS ORIGINATED | 34 | $201,129 | 26 | $174,193 |
| APPLICATIONS APPROVED, NOT ACCEPTED | 8 | $158,344 | 5 | $144,506 |
| APPLICATIONS DENIED | 3 | $186,497 | 2 | $338,325 |
| APPLICATIONS WITHDRAWN | 2 | $127,335 | 5 | $169,920 |
| FILES CLOSED FOR INCOMPLETENESS | 0 | $0 | 1 | $154,700 |
2002 - 2018 National Fire Incident Reporting System (NFIRS) incidents
- Fire incident types reported to NFIRS in Johnson City, TN
- 2,23140.6%Outside Fires
- 2,15739.2%Structure Fires
- 95517.4%Mobile Property/Vehicle Fires
- 1552.8%Other
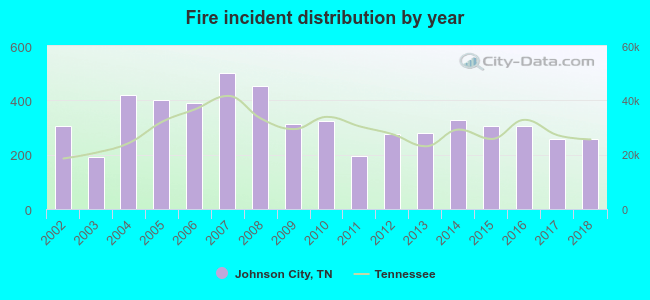 According to the data from the years 2002 - 2018 the average number of fire incidents per year is 323. The highest number of fire incidents - 499 took place in 2007, and the least - 193 in 2003. The data has a decreasing trend.
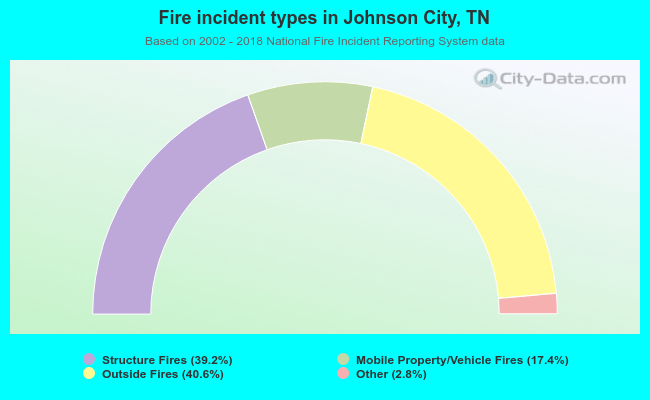 When looking into fire subcategories, the most incidents belonged to: Outside Fires (40.6%), and Structure Fires (39.2%).
Fire-safe hotels and motels in Johnson City, Tennessee:
- Quality Inn & Suites, 207 E Mountcastle Dr, Johnson City, Tennessee 37601 , Phone: (423) 282-3335, Fax: (423) 282-0131
- Garden Plaza Hotel, 211 Mockingbird Ln, Johnson City, Tennessee 37604 , Phone: (423) 929-2000, Fax: (423) 929-2000
- Comfort Suites, 3118 Browns Mill Rd, Johnson City, Tennessee 37604 , Phone: (423) 610-0010, Fax: (423) 610-0153
- Sleep Inn, Inn & Suites, 2020 Franklin Terrace Ct, Johnson City, Tennessee 37604 , Phone: (423) 915-0081, Fax: (423) 915-0029
- Comfort Inn Of Johnson City, 1900 S Roan St, Johnson City, Tennessee 37604 , Phone: (423) 928-9600, Fax: (423) 928-0046
- Baymont Inn & Suites Johnson City, 2606 N Roan St, Johnson City, Tennessee 37601 , Phone: (423) 282-4011, Fax: (423) 282-4011
- Carnegie Hotel, 1216 W State Of Franklin Rd, Johnson City, Tennessee 37604 , Phone: (423) 979-6400, Fax: (423) 979-6424
- Value Place Johnson City, 135 Pinnacle Dr, Johnson City, Tennessee 37615 , Phone: (423) 283-0365
- 7 other hotels and motels
| Most common first names in Johnson City, TN among deceased individuals | ||
| Name | Count | Lived (average) |
|---|---|---|
| James | 605 | 72.0 years |
| Mary | 601 | 78.2 years |
| William | 560 | 74.4 years |
| John | 513 | 74.5 years |
| Robert | 433 | 72.8 years |
| Charles | 361 | 71.4 years |
| George | 269 | 74.2 years |
| Ruth | 199 | 79.9 years |
| Margaret | 188 | 77.4 years |
| Frank | 163 | 75.6 years |
| Most common last names in Johnson City, TN among deceased individuals | ||
| Last name | Count | Lived (average) |
|---|---|---|
| Smith | 257 | 75.8 years |
| Miller | 254 | 75.9 years |
| Johnson | 186 | 76.3 years |
| Jones | 184 | 74.5 years |
| Williams | 167 | 73.3 years |
| Campbell | 146 | 75.0 years |
| Taylor | 140 | 76.0 years |
| Brown | 125 | 75.7 years |
| Cox | 121 | 75.3 years |
| Wilson | 116 | 75.0 years |
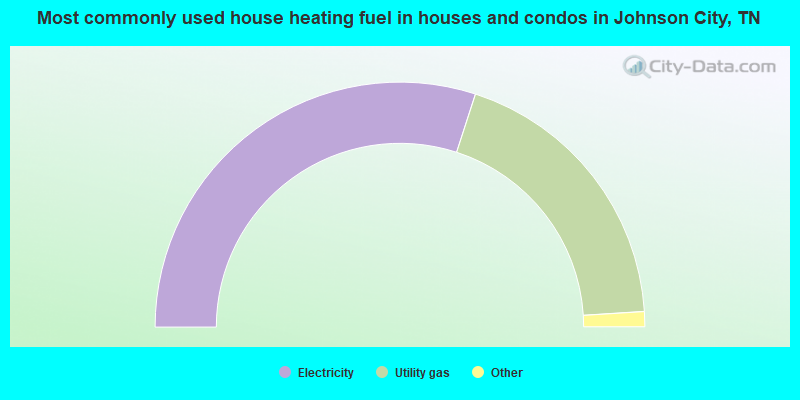
- 60.0%Electricity
- 38.0%Utility gas
- 1.2%Bottled, tank, or LP gas
- 0.2%No fuel used
- 0.2%Other fuel
- 0.2%Wood
- 0.2%Coal or coke
- 90.2%Electricity
- 8.2%Utility gas
- 0.7%Bottled, tank, or LP gas
- 0.4%No fuel used
- 0.2%Coal or coke
- 0.2%Wood
Johnson City compared to Tennessee state average:
- Unemployed percentage below state average.
- Black race population percentage significantly below state average.
- Number of college students above state average.
- Percentage of population with a bachelor's degree or higher above state average.
Johnson City on our top lists:
- #1 on the list of "Top 101 cities with largest percentage of males in occupations: health technologists and technicians (population 50,000+)"
- #7 on the list of "Top 101 cities with largest percentage of males in industries: health care and social assistance (population 50,000+)"
- #10 on the list of "Top 101 cities with largest percentage of females in industries: retail trade (population 50,000+)"
- #18 on the list of "Top 101 cities with largest percentage of females in occupations: education, training, and library occupations (population 50,000+)"
- #20 on the list of "Top 101 cities with largest percentage of males in industries: retail trade (population 50,000+)"
- #21 on the list of "Top 101 cities with largest percentage of males in occupations: education, training, and library occupations (population 50,000+)"
- #25 on the list of "Top 101 cities with largest percentage of females in occupations: sales and related occupations (population 50,000+)"
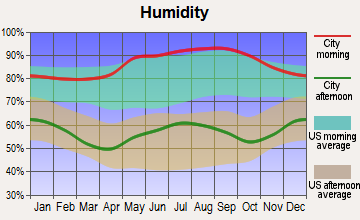
- #25 on the list of "Top 101 cities with the highest maximum monthly morning or afternoon humidity (population 50,000+)"
- #26 on the list of "Top 101 cities with largest percentage of females in occupations: extraction workers (population 50,000+)"
- #26 on the list of "Top 101 cities with largest percentage of females in occupations: fishing and hunting, and forest and logging workers (population 50,000+)"
- #26 on the list of "Top 101 cities with largest percentage of females in industries: farm product raw materials merchant wholesalers (population 50,000+)"
- #27 on the list of "Top 101 cities with largest percentage of females in industries: broadcasting, internet publishing, and telecommunications services (population 50,000+)"
- #27 on the list of "Top 101 cities with largest percentage of males in industries: broadcasting, internet publishing, and telecommunications services (population 50,000+)"
- #27 on the list of "Top 101 cities with largest percentage of males in industries: wholesale electronic markets and agents and brokers (population 50,000+)"
- #27 on the list of "Top 101 cities with largest percentage of females in industries: wholesale electronic markets and agents and brokers (population 50,000+)"
- #30 on the list of "Top 101 cities with the largest household incomes disparities (population 50,000+)"
- #37 on the list of "Top 100 cities with highest percentage of college students (pop. 50,000+)"
- #37 on the list of "Top 101 cities with the most people having Doctorate degrees (population 50,000+)"
- #39 on the list of "Top 101 cities with the highest percentage of English-only speaking households, population 50,000+"
- #43 on the list of "Top 101 cities that people commute into (largest positive percentage daily daytime population change due to commuting) (population 50,000+)"
- #79 on the list of "Top 101 counties with the smallest number of children under 18 without health insurance coverage in 2000 (pop. 50,000+)"

|
|
Total of 297 patent applications in 2008-2024.