Crime rate in Toledo, Ohio (OH): murders, rapes, robberies, assaults, burglaries, thefts, auto thefts, arson, law enforcement employees, police officers, crime map
Crime rate in Toledo, OH
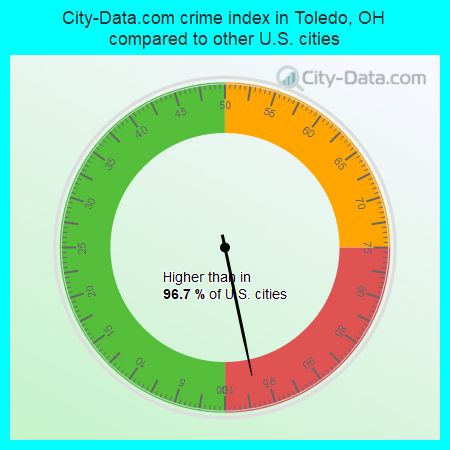
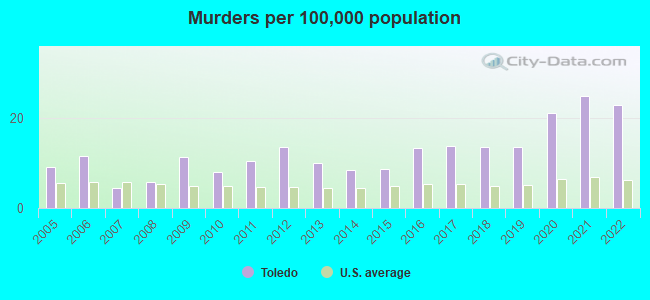
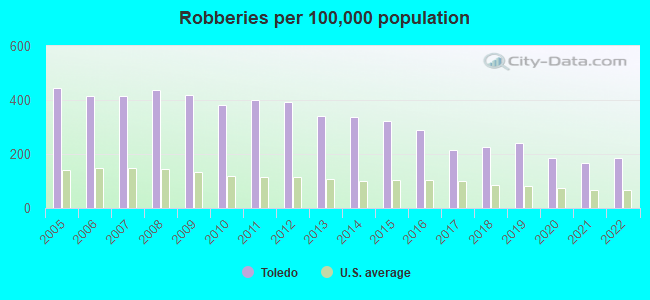
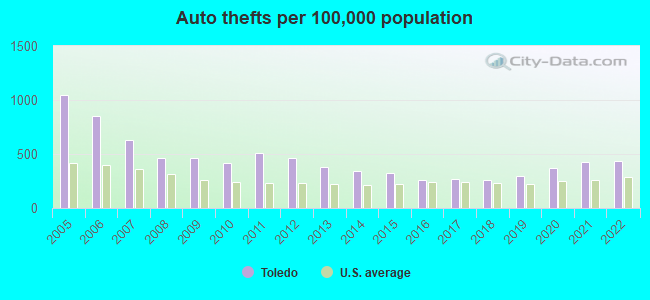
The 2022 crime rate in Toledo, OH is 501 (City-Data.com crime index), which is 2.0 times greater than the U.S. average. It was higher than in 96.7% U.S. cities. The 2022 Toledo crime rate rose by 5% compared to 2021. The number of homicides stood at 61 - a decrease of 6 compared to 2021. In the last 5 years Toledo has seen increasing violent crime and decline of property crime.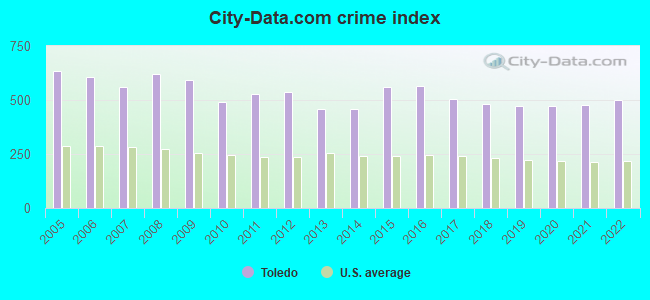
The City-Data.com crime index weighs serious crimes and violent crimes more heavily. Higher means more crime, U.S. average is 246.1. It adjusts for the number of visitors and daily workers commuting into cities.
- means the value is smaller than the state average.- means the value is about the same as the state average.
- means the value is bigger than the state average.
- means the value is much bigger than the state average.
According to our research of Ohio and other state lists, there were 850 registered sex offenders living in Toledo, Ohio as of April 27, 2024.
The ratio of all residents to sex offenders in Toledo is 328 to 1.
Violent crime rate in 2022
| Toledo: | 658.3 |
| U.S. Average: | 219.8 |
Violent crime rate in 2021
| Toledo: | 626.4 |
| U.S. Average: | 224.8 |
Violent crime rate in 2020
| Toledo: | 597.3 |
| U.S. Average: | 228.2 |
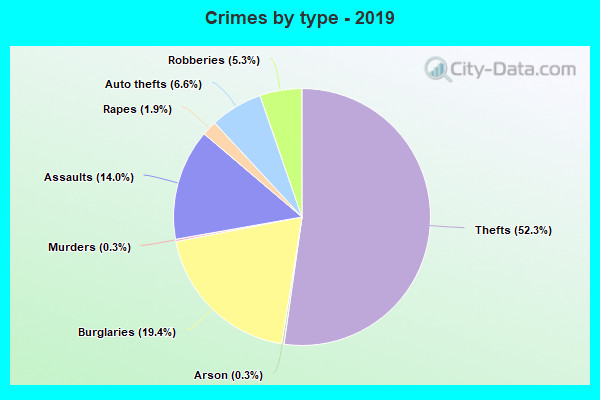
Violent crime rate in 2019
| Toledo: | 546.2 |
| U.S. Average: | 219.9 |
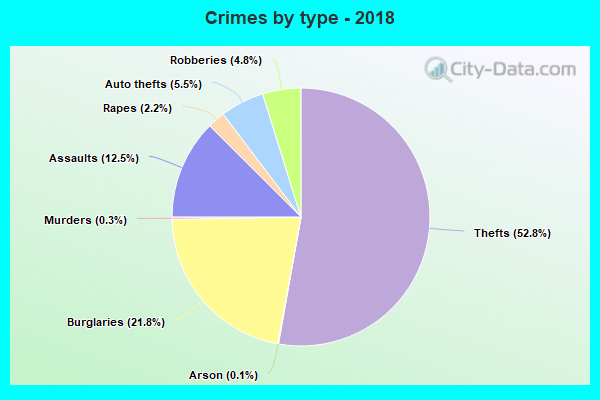
Violent crime rate in 2018
| Toledo: | 532.3 |
| U.S. Average: | 221.2 |
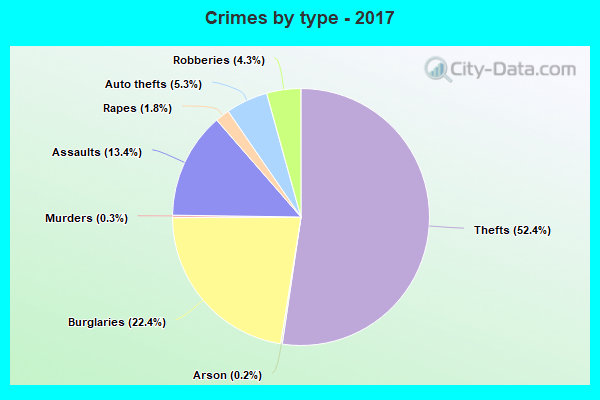
Violent crime rate in 2017
| Toledo: | 560.6 |
| U.S. Average: | 226.2 |
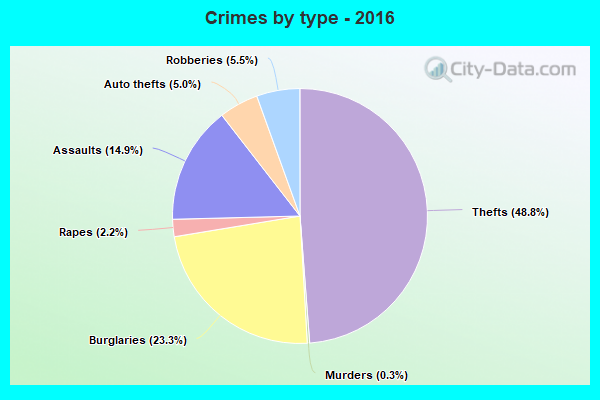
Violent crime rate in 2016
| Toledo: | 672.9 |
| U.S. Average: | 227.3 |
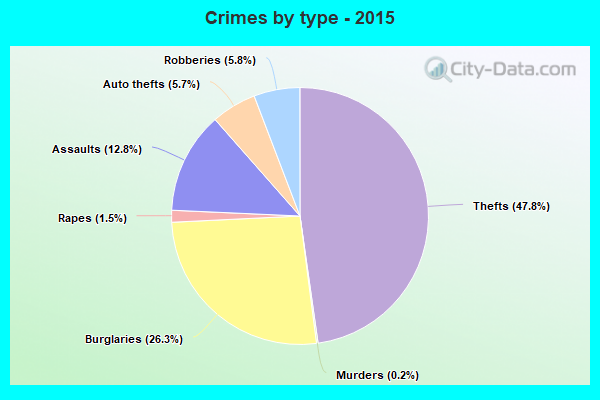
Violent crime rate in 2015
| Toledo: | 618.1 |
| U.S. Average: | 219.3 |
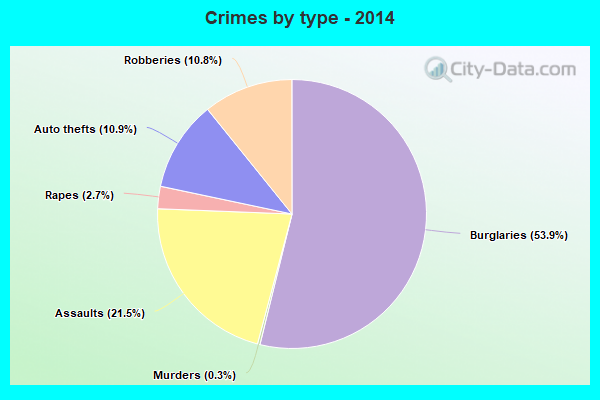
Violent crime rate in 2014
| Toledo: | 599.5 |
| U.S. Average: | 211.1 |
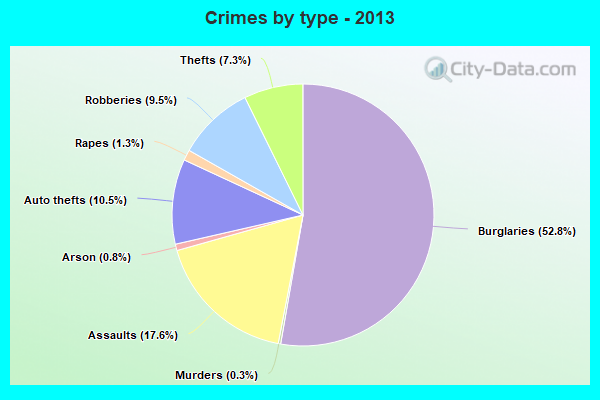
Violent crime rate in 2013
| Toledo: | 550.3 |
| U.S. Average: | 214.2 |
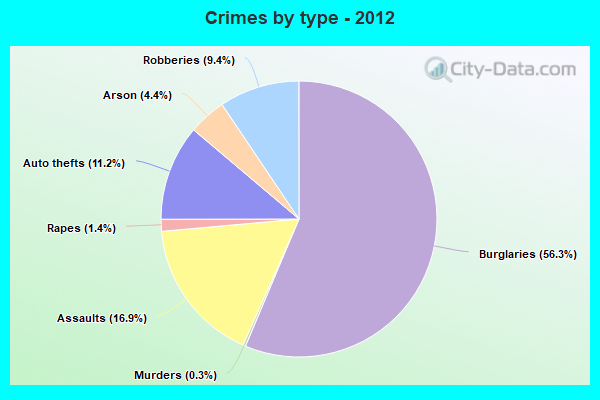
Violent crime rate in 2012
| Toledo: | 636.5 |
| U.S. Average: | 187.4 |
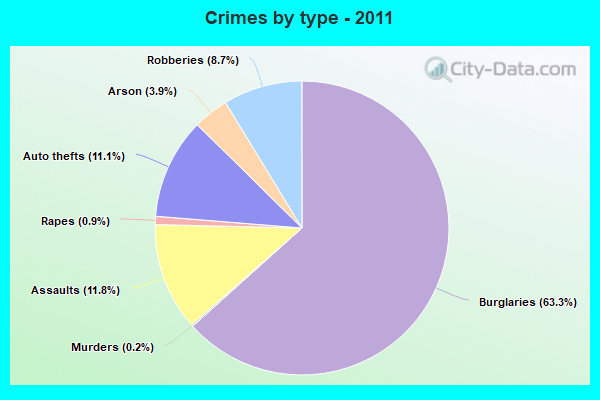
Violent crime rate in 2011
| Toledo: | 536.2 |
| U.S. Average: | 187.1 |
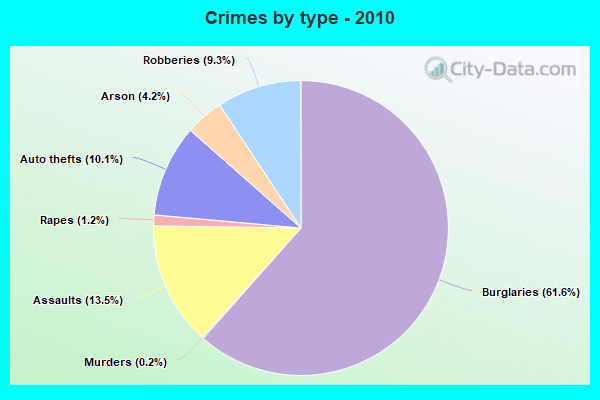
Violent crime rate in 2010
| Toledo: | 533.2 |
| U.S. Average: | 195.7 |
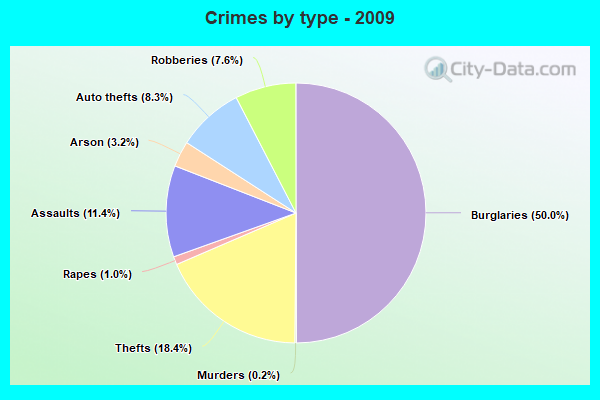
Violent crime rate in 2009
| Toledo: | 603.8 |
| U.S. Average: | 208.9 |
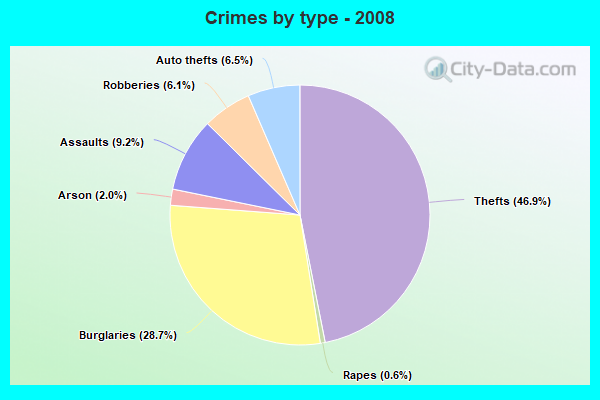
Violent crime rate in 2008
| Toledo: | 599.7 |
| U.S. Average: | 222.5 |
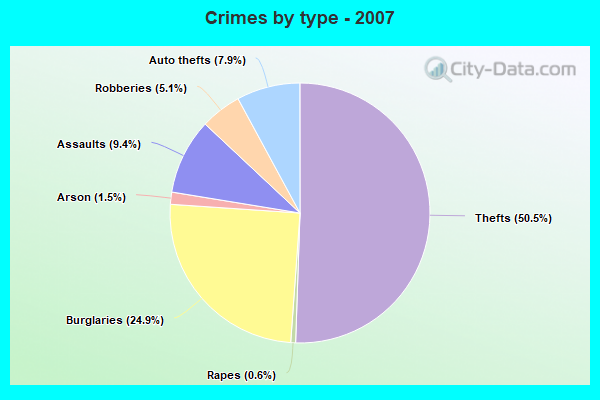
Violent crime rate in 2007
| Toledo: | 535.6 |
| U.S. Average: | 229.1 |
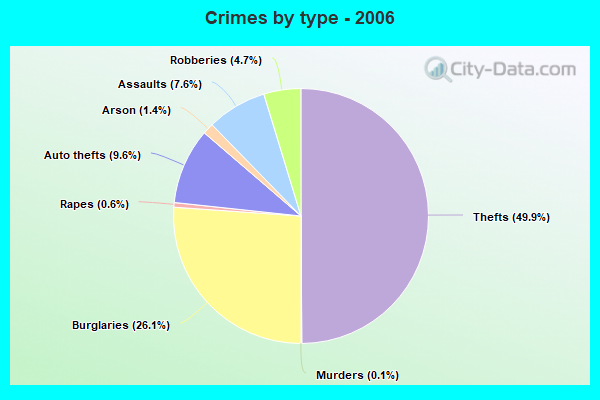
Violent crime rate in 2006
| Toledo: | 513.3 |
| U.S. Average: | 232.6 |
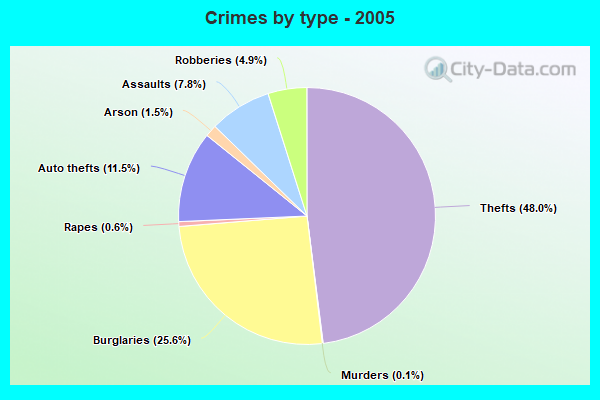
Violent crime rate in 2005
| Toledo: | 541.9 |
| U.S. Average: | 227.0 |
Property crime rate in 2022
| Toledo: | 281.9 |
| U.S. Average: | 166.5 |
Property crime rate in 2021
| Toledo: | 264.6 |
| U.S. Average: | 157.8 |
Property crime rate in 2020
| Toledo: | 284.8 |
| U.S. Average: | 169.6 |
Property crime rate in 2019
| Toledo: | 334.6 |
| U.S. Average: | 179.7 |
Property crime rate in 2018
| Toledo: | 366.4 |
| U.S. Average: | 190.2 |
Property crime rate in 2017
| Toledo: | 397.2 |
| U.S. Average: | 206.4 |
Property crime rate in 2016
| Toledo: | 409.4 |
| U.S. Average: | 216.6 |
Property crime rate in 2015
| Toledo: | 477.4 |
| U.S. Average: | 221.5 |
Property crime rate in 2014
| Toledo: | 384.3 |
| U.S. Average: | 230.8 |
Property crime rate in 2013
| Toledo: | 448.1 |
| U.S. Average: | 250.4 |
Property crime rate in 2012
| Toledo: | 540.5 |
| U.S. Average: | 267.3 |
Property crime rate in 2011
| Toledo: | 658.6 |
| U.S. Average: | 273.5 |
Property crime rate in 2010
| Toledo: | 570.0 |
| U.S. Average: | 276.4 |
Property crime rate in 2009
| Toledo: | 674.0 |
| U.S. Average: | 285.6 |
Property crime rate in 2008
| Toledo: | 648.9 |
| U.S. Average: | 302.2 |
Property crime rate in 2007
| Toledo: | 578.3 |
| U.S. Average: | 309.2 |
Property crime rate in 2006
| Toledo: | 667.6 |
| U.S. Average: | 317.3 |
Property crime rate in 2005
| Toledo: | 697.5 |
| U.S. Average: | 322.3 |
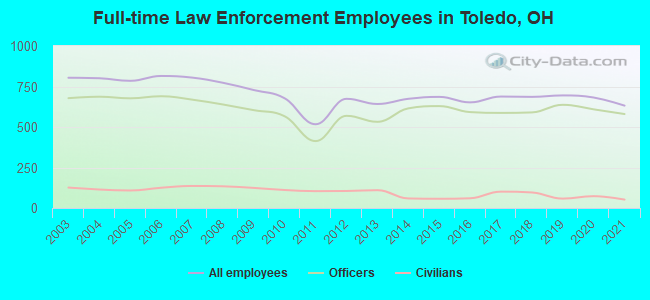
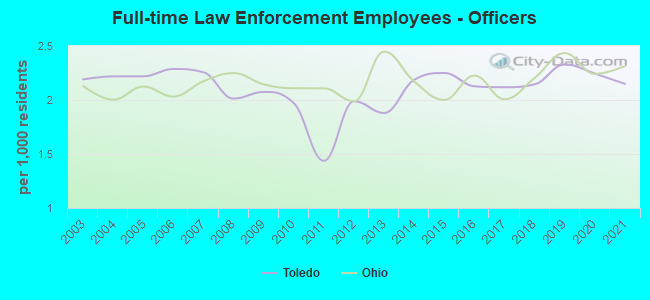
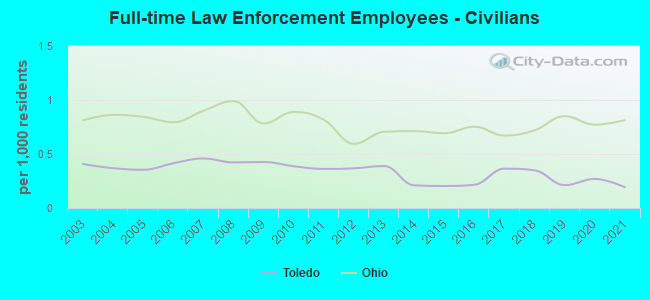
Full-time law enforcement employees in 2021, including police officers: 632 (580 officers - 483 male; 97 female).
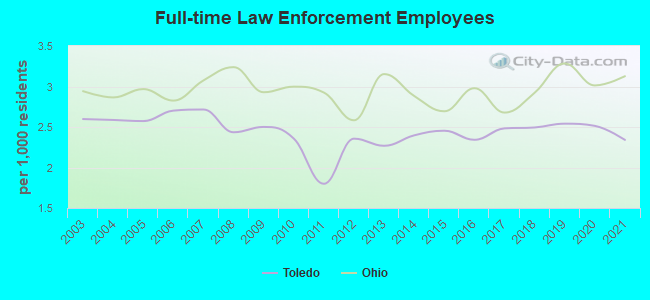
| Officers per 1,000 residents here: | 2.15 |
| Ohio average: | 2.31 |
Full-time law enforcement employees in 2020, including police officers: 682 (609 officers - 505 male; 104 female).
| Officers per 1,000 residents here: | 2.25 |
| Ohio average: | 2.24 |
Full-time law enforcement employees in 2019, including police officers: 695 (637 officers - 530 male; 107 female).
| Officers per 1,000 residents here: | 2.33 |
| Ohio average: | 2.43 |
Full-time law enforcement employees in 2018, including police officers: 686 (590 officers - 502 male; 88 female).
| Officers per 1,000 residents here: | 2.15 |
| Ohio average: | 2.20 |
Full-time law enforcement employees in 2017, including police officers: 688 (587 officers - 496 male; 91 female).
| Officers per 1,000 residents here: | 2.12 |
| Ohio average: | 2.01 |
Full-time law enforcement employees in 2016, including police officers: 652 (592 officers - 499 male; 93 female).
| Officers per 1,000 residents here: | 2.13 |
| Ohio average: | 2.23 |
Full-time law enforcement employees in 2015, including police officers: 686 (629 officers - 526 male; 103 female).
| Officers per 1,000 residents here: | 2.25 |
| Ohio average: | 2.00 |
Full-time law enforcement employees in 2014, including police officers: 674 (615 officers - 517 male; 98 female).
| Officers per 1,000 residents here: | 2.19 |
| Ohio average: | 2.17 |
Full-time law enforcement employees in 2013, including police officers: 642 (532 officers - 438 male; 94 female).
| Officers per 1,000 residents here: | 1.88 |
| Ohio average: | 2.45 |
Full-time law enforcement employees in 2012, including police officers: 674 (569 officers - 469 male; 100 female).
| Officers per 1,000 residents here: | 1.99 |
| Ohio average: | 1.99 |
Full-time law enforcement employees in 2011, including police officers: 517 (413 officers - 330 male; 83 female).
| Officers per 1,000 residents here: | 1.44 |
| Ohio average: | 2.11 |
Full-time law enforcement employees in 2010, including police officers: 677 (566 officers - 454 male; 112 female).
| Officers per 1,000 residents here: | 1.97 |
| Ohio average: | 2.11 |
Full-time law enforcement employees in 2009, including police officers: 728 (604 officers - 485 male; 119 female).
| Officers per 1,000 residents here: | 2.08 |
| Ohio average: | 2.15 |
Full-time law enforcement employees in 2008, including police officers: 773 (639 officers - 509 male; 130 female).
| Officers per 1,000 residents here: | 2.01 |
| Ohio average: | 2.25 |
Full-time law enforcement employees in 2007, including police officers: 805 (669 officers - 531 male; 138 female).
| Officers per 1,000 residents here: | 2.26 |
| Ohio average: | 2.17 |
Full-time law enforcement employees in 2006, including police officers: 815 (690 officers - 549 male; 141 female).
| Officers per 1,000 residents here: | 2.29 |
| Ohio average: | 2.03 |
Full-time law enforcement employees in 2005, including police officers: 785 (677 officers - 539 male; 138 female).
| Officers per 1,000 residents here: | 2.22 |
| Ohio average: | 2.12 |
Full-time law enforcement employees in 2004, including police officers: 801 (687 officers - 545 male; 142 female).
| Officers per 1,000 residents here: | 2.22 |
| Ohio average: | 2.00 |
Full-time law enforcement employees in 2003, including police officers: 804 (678 officers - 537 male; 141 female).
| Officers per 1,000 residents here: | 2.19 |
| Ohio average: | 2.13 |

Zip codes: 43604, 43607, 43608, 43609, 43610, 43612, 43613, 43620.