Estimated zip code population in 2022: 19,857 Zip code population in 2010: 23,687 Zip code population in 2000: 27,560
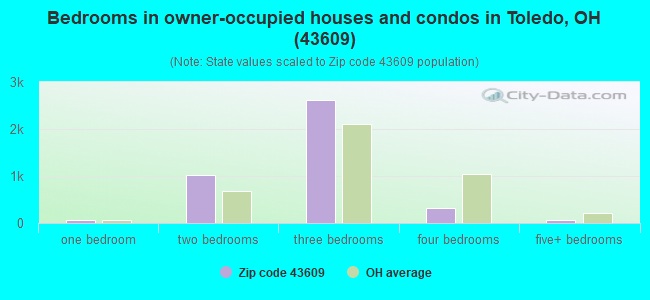
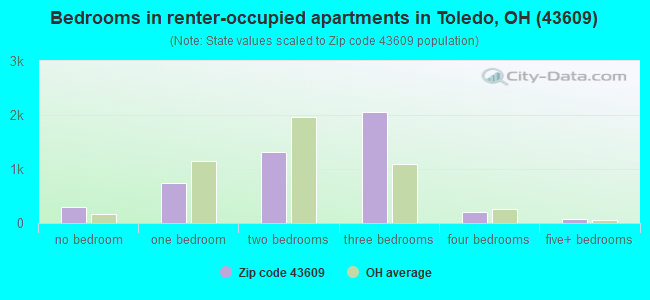
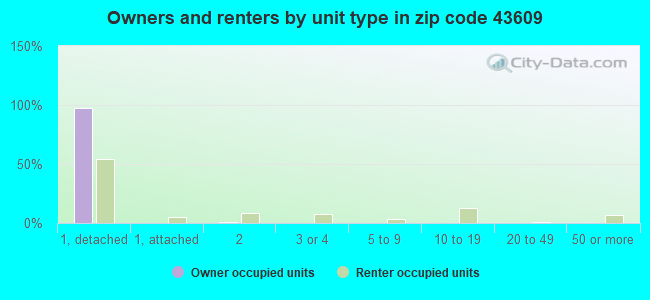
Houses and condos: 10,155 Renter-occupied apartments: 4,722
% of renters here:
53%
State:
33%
March 2022 cost of living index in zip code 43609: 91.2 (less than average, U.S. average is 100)
Land area: 5.2 sq. mi. Water area: 0.8 sq. mi.
Population density: 3,795 people per square mile
(average).
OSM Map
General Map
Google Map
MSN Map
OSM Map
General Map
Google Map
MSN Map
OSM Map
General Map
Google Map
MSN Map
OSM Map
General Map
Google Map
MSN Map
Please wait while loading the map...
Real estate property taxes paid for housing units in 2022:
This zip code:
1.7% ($1,075)
Ohio:
1.3% ($2,639)
Median real estate property taxes paid for housing units with mortgages in 2022: $1,176 (1.6%) Median real estate property taxes paid for housing units with no mortgage in 2022: $959 (1.8%)
Business Search- 14 Million verified businesses
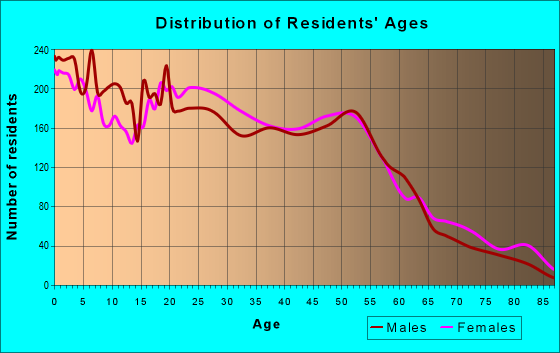
Males: 10,412
(52.4%)
Females: 9,445
(47.6%)
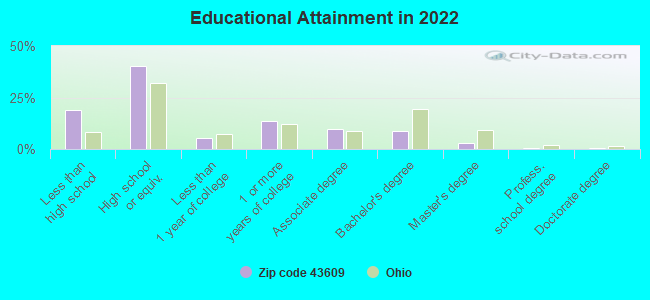
For population 25 years and over in 43609:
High school or higher: 79.4%
Bachelor's degree or higher: 11.6%
Graduate or professional degree: 3.2%
Unemployed: 7.3%
Mean travel time to work (commute): 20.4 minutes
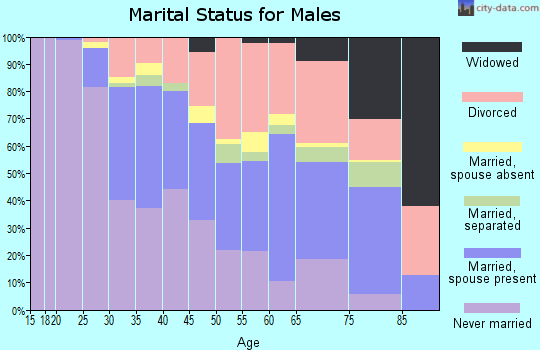
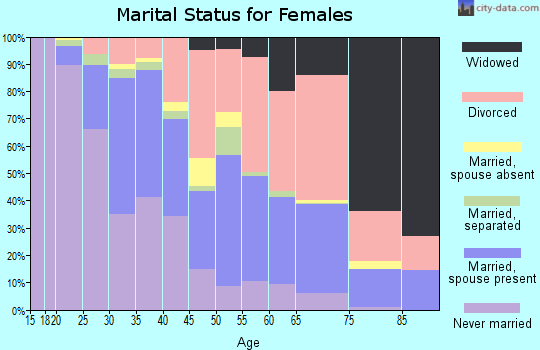
For population 15 years and over in 43609:
Never married: 46.1%
Now married: 30.8%
Separated: 1.5%
Widowed: 6.1%
Divorced: 15.5%
Zip code 43609 compared to state average:
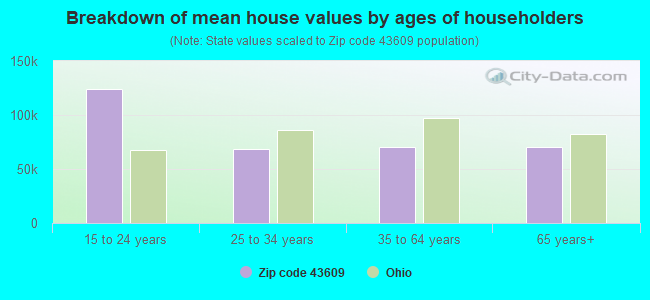
Median house value significantly below state average.
Unemployed percentage above state average.
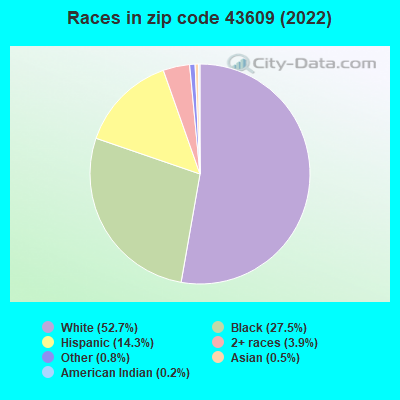
Black race population percentage above state average.
Hispanic race population percentage significantly above state average.
Renting percentage above state average.
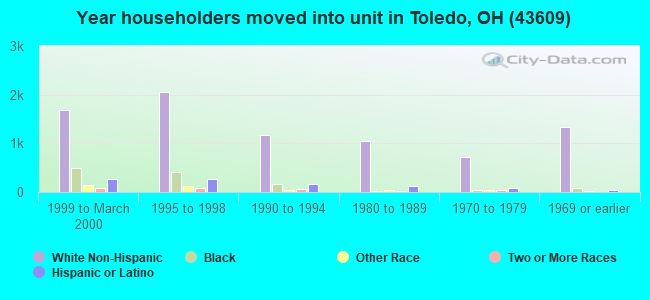
Length of stay since moving in significantly above state average.
House age above state average.
Percentage of population with a bachelor's degree or higher significantly below state average.
Averages for the 2020 tax year for zip code 43609, filed in 2021:
Average Adjusted Gross Income (AGI) in 2020: $30,416 (Individual Income Tax Returns)
Here:
$30,416
State:
$67,288
Salary/wage: $27,238 (reported on 88.1% of returns)
Here:
$27,238
State:
$55,628
(% of AGI for various income ranges: 1153.8% for AGIs below $25k, 3432.4% for AGIs $25k-50k, 6434.1% for AGIs $50k-75k, 10239.0% for AGIs $75k-100k, 16233.6% for AGIs $100k-200k)
Taxable interest for individuals: $352 (reported on 8.1% of returns)
This zip code:
$352
Ohio:
$1,518
(% of AGI for various income ranges: 2.4% for AGIs below $25k, 2.8% for AGIs $25k-50k, 8.9% for AGIs $50k-75k, 8.0% for AGIs $75k-100k, 11.8% for AGIs $100k-200k)
Ordinary dividends: $1,348 (reported on 3.9% of returns)
Here:
$1,348
State:
$7,167
(% of AGI for various income ranges: 2.6% for AGIs below $25k, 4.9% for AGIs $25k-50k, 19.7% for AGIs $50k-75k, 23.5% for AGIs $75k-100k, 52.7% for AGIs $100k-200k)
Net capital gain/loss in AGI: +$1,730 (reported on 3.2% of returns)
Here:
+$1,730
State:
+$18,919
(% of AGI for various income ranges: 1.9% for AGIs below $25k, 4.3% for AGIs $25k-50k, 16.1% for AGIs $50k-75k, 41.0% for AGIs $75k-100k, 98.2% for AGIs $100k-200k)
Profit/loss from business: +$5,571 (reported on 10.9% of returns)
Here:
+$5,571
State:
+$13,744
(% of AGI for various income ranges: 70.1% for AGIs below $25k, 28.6% for AGIs $25k-50k, 93.9% for AGIs $50k-75k, 439.0% for AGIs $75k-100k, 404.5% for AGIs $100k-200k)
Taxable individual retirement arrangement distribution: $10,571 (reported on 2.8% of returns)
43609:
$10,571
Ohio:
$18,876
(% of AGI for various income ranges: 15.5% for AGIs below $25k, 24.2% for AGIs $25k-50k, 73.0% for AGIs $50k-75k, 456.5% for AGIs $75k-100k)
Total itemized deductions: $25,200 (reported on 0.8% of returns)
Here:
$25,200
State:
$33,869
(% of AGI for various income ranges: 50.4% for AGIs $25k-50k, 267.5% for AGIs $75k-100k)
Charity contributions: $7,150 (reported on 0.5% of returns)
Here:
$7,150
State:
$14,577
(% of AGI for various income ranges: 44.7% for AGIs $50k-75k)
Taxes paid: $3,700 (reported on 0.8% of returns)
43609:
$3,700
State:
$7,681
(% of AGI for various income ranges: 5.5% for AGIs $25k-50k, 62.0% for AGIs $75k-100k)
Earned income credit: $2,671 (reported on 37.3% of returns)
Here:
$2,671
State:
$2,304
(% of AGI for various income ranges: 163.8% for AGIs below $25k, 104.1% for AGIs $25k-50k)
Percentage of individuals using paid preparers for their 2020 taxes: 93.9%
Here:
94%
State:
94%
(% for various income ranges: 94.0% for AGIs below $25k, 94.4% for AGIs $25k-50k, 94.0% for AGIs $50k-75k, 90.3% for AGIs $75k-100k, 89.5% for AGIs $100k-200k)
Averages for the 2012 tax year for zip code 43609, filed in 2013:
Average Adjusted Gross Income (AGI) in 2012: $26,532 (Individual Income Tax Returns)
Here:
$26,532
State:
$54,926
Salary/wage: $24,578 (reported on 89.0% of returns)
Here:
$24,578
State:
$45,869
(% of AGI for various income ranges: 81.3% for AGIs below $25k, 86.2% for AGIs $25k-50k, 82.5% for AGIs $50k-75k, 83.6% for AGIs $75k-100k, 66.7% for AGIs $100k-200k)
Taxable interest for individuals: $653 (reported on 11.7% of returns)
This zip code:
$653
Ohio:
$1,297
(% of AGI for various income ranges: 0.3% for AGIs below $25k, 0.2% for AGIs $25k-50k, 0.2% for AGIs $50k-75k, 0.3% for AGIs $75k-100k, 1.0% for AGIs $100k-200k)
Ordinary dividends: $1,445 (reported on 4.9% of returns)
Here:
$1,445
State:
$5,821
(% of AGI for various income ranges: 0.2% for AGIs below $25k, 0.1% for AGIs $25k-50k, 0.4% for AGIs $50k-75k, 0.8% for AGIs $75k-100k, 0.4% for AGIs $100k-200k)
Net capital gain/loss in AGI: +$200 (reported on 2.7% of returns)
Here:
+$200
State:
+$11,232
(% of AGI for various income ranges: 0.4% for AGIs $75k-100k)
Profit/loss from business: +$8,035 (reported on 9.7% of returns)
Here:
+$8,035
State:
+$12,773
(% of AGI for various income ranges: 7.5% for AGIs below $25k, 1.3% for AGIs $25k-50k, 0.9% for AGIs $50k-75k, 1.8% for AGIs $75k-100k)
Taxable individual retirement arrangement distribution: $9,538 (reported on 4.6% of returns)
43609:
$9,538
Ohio:
$14,511
(% of AGI for various income ranges: 1.2% for AGIs below $25k, 1.2% for AGIs $25k-50k, 2.0% for AGIs $50k-75k, 5.2% for AGIs $75k-100k)
Total itemized deductions: $13,559 (24% of AGI, reported on 10.0% of returns)
Here:
$13,559
State:
$21,278
Here:
24.3% of AGI
State:
18.8% of AGI
(% of AGI for various income ranges: 2.5% for AGIs below $25k, 5.2% for AGIs $25k-50k, 6.3% for AGIs $50k-75k, 6.5% for AGIs $75k-100k, 9.7% for AGIs $100k-200k)
Charity contributions: $2,509 (reported on 6.8% of returns)
Here:
$2,509
State:
$3,943
(% of AGI for various income ranges: 0.7% for AGIs $25k-50k, 0.9% for AGIs $50k-75k, 0.9% for AGIs $75k-100k, 1.6% for AGIs $100k-200k)
Taxes paid: $4,451 (reported on 10.0% of returns)
43609:
$4,451
State:
$9,568
(% of AGI for various income ranges: 0.5% for AGIs below $25k, 1.4% for AGIs $25k-50k, 2.2% for AGIs $50k-75k, 2.7% for AGIs $75k-100k, 4.6% for AGIs $100k-200k)
Earned income credit: $2,630 (reported on 40.4% of returns)
Here:
$2,630
State:
$2,285
(% of AGI for various income ranges: 12.3% for AGIs below $25k, 1.6% for AGIs $25k-50k)
Percentage of individuals using paid preparers for their 2012 taxes: 41.8%
Here:
42%
State:
51%
(% for various income ranges: 40.4% for AGIs below $25k, 41.7% for AGIs $25k-50k, 47.9% for AGIs $50k-75k, 50.0% for AGIs $75k-100k, 50.0% for AGIs $100k-200k)
Averages for the 2004 tax year for zip code 43609, filed in 2005:
Average Adjusted Gross Income (AGI) in 2004: $25,503 (Individual Income Tax Returns)
Here:
$25,503
State:
$44,480
Salary/wage: $24,624 (reported on 91.7% of returns)
Here:
$24,624
State:
$39,198
(% of AGI for various income ranges: 95.0% for AGIs below $10k, 85.8% for AGIs $10k-25k, 90.0% for AGIs $25k-50k, 90.6% for AGIs $50k-75k, 91.6% for AGIs $75k-100k, 64.8% for AGIs over 100k)
Taxable interest for individuals: $880 (reported on 19.8% of returns)
This zip code:
$880
Ohio:
$1,532
(% of AGI for various income ranges: 1.3% for AGIs below $10k, 0.8% for AGIs $10k-25k, 0.6% for AGIs $25k-50k, 0.8% for AGIs $50k-75k, 0.2% for AGIs $75k-100k, 1.0% for AGIs over 100k)
Taxable dividends: $795 (reported on 7.6% of returns)
Here:
$795
State:
$3,496
(% of AGI for various income ranges: 0.4% for AGIs below $10k, 0.3% for AGIs $10k-25k, 0.1% for AGIs $25k-50k, 0.2% for AGIs $50k-75k, 0.1% for AGIs $75k-100k, 0.9% for AGIs over 100k)
Net capital gain/loss: +$2,188 (reported on 4.6% of returns)
Here:
+$2,188
State:
+$8,582
(% of AGI for various income ranges: -0.3% for AGIs below $10k, 0.0% for AGIs $10k-25k, 0.1% for AGIs $25k-50k, -0.1% for AGIs $50k-75k, 0.2% for AGIs $75k-100k, 8.6% for AGIs over 100k)
Profit/loss from business: +$5,492 (reported on 7.1% of returns)
Here:
+$5,492
State:
+$10,813
(% of AGI for various income ranges: 4.9% for AGIs below $10k, 2.2% for AGIs $10k-25k, 1.1% for AGIs $25k-50k, 1.2% for AGIs $50k-75k, 1.7% for AGIs $75k-100k, 0.1% for AGIs over 100k)
IRA payment deduction: $1,312 (reported on 1.2% of returns)
43609:
$1,312
Ohio:
$2,794
Total itemized deductions: $11,101 (23% of AGI, reported on 17.2% of returns)
Here:
$11,101
State:
$17,503
Here:
22.7% of AGI
State:
20.8% of AGI
(% of AGI for various income ranges: 1.9% for AGIs below $10k, 3.6% for AGIs $10k-25k, 7.5% for AGIs $25k-50k, 10.5% for AGIs $50k-75k, 11.6% for AGIs $75k-100k, 11.0% for AGIs over 100k)
Charity contributions deductions: $1,837 (4% of AGI, reported on 13.2% of returns)
Here:
$1,837
State:
$3,087
Here:
3.6% of AGI
State:
3.4% of AGI
(% of AGI for various income ranges: 0.1% for AGIs below $10k, 0.4% for AGIs $10k-25k, 0.9% for AGIs $25k-50k, 1.3% for AGIs $50k-75k, 1.7% for AGIs $75k-100k, 2.3% for AGIs over 100k)
Total tax: $2,832 (reported on 61.8% of returns)
43609:
$2,832
State:
$6,781
(% of AGI for various income ranges: 1.5% for AGIs below $10k, 3.3% for AGIs $10k-25k, 6.5% for AGIs $25k-50k, 8.7% for AGIs $50k-75k, 11.0% for AGIs $75k-100k, 17.2% for AGIs over 100k)
Earned income credit: $1,891 (reported on 31.4% of returns)
Here:
$1,891
State:
$1,696
Percentage of individuals using paid preparers for their 2004 taxes: 52.5%
Here:
53%
State:
55%
(% for various income ranges: 47.7% for AGIs below $10k, 55.5% for AGIs $10k-25k, 53.4% for AGIs $25k-50k, 50.6% for AGIs $50k-75k, 56.1% for AGIs $75k-100k, 69.4% for AGIs over 100k)
Likely homosexual households (counted as self-reported same-sex unmarried-partner households)
Lesbian couples: 0.1% of all households
Gay men: 0.4% of all households
Household received Food Stamps/SNAP in the past 12 months: 2,407 Household did not receive Food Stamps/SNAP in the past 12 months: 6,516
Women who had a birth in the past 12 months: 177 (104 now married, 72 unmarried) Women who did not have a birth in the past 12 months: 4,937 (1,312 now married, 3,627 unmarried)
Housing units in zip code 43609 with a mortgage: 1,758 (135 second mortgage, 119 both second mortgage and home equity loan) Houses without a mortgage: 84
Median monthly owner costs for units with a mortgage: $813 Median monthly owner costs for units without a mortgage: $388
Residents with income below the poverty level in 2022:
This zip code:
27.4%
Whole state:
13.4%
Residents with income below 50% of the poverty level in 2022:
This zip code:
16.8%
Whole state:
7.0%
Median number of rooms in houses and condos:
Here:
6.1
State:
6.7
Median number of rooms in apartments:
Here:
5.2
State:
4.4
Notable locations in this zip code not listed on our city pages
Notable locations in zip code 43609: Cloverleaf Yard (A), Toledo Fire and Rescue Department Station 9 (B), Toledo Heights Branch Library (C), South Branch Library (D). Display/hide their locations on the map
Churches in zip code 43609 include: Church of the Living God (A), Toledo Apostolic Lighthouse Church (B), Saints Peter and Paul Church (C), Immaculate Conception Catholic Church (D), Maplewood United Methodist Church (E), Somerset United Methodist Church (F), Faith Evangelical Lutheran Church (G), Kingdom Hall of Jehovahs Witnesses (H), Toledo Foursquare Chapel (I). Display/hide their locations on the map
Parks in zip code 43609 include: Ashley Field (1), Saint Peter and Saint Paul Historic District (2), Walbridge Park (3), Sterling Field (4), Highland Park (5). Display/hide their locations on the map
In group quarters: 49 (-1 institutionalized population)
Size of family households: 2,062 2-persons, 1,273 3-persons, 908 4-persons, 276 5-persons, 115 6-persons, 66 7-or-more-persons
Size of nonfamily households: 3,242 1-person, 796 2-persons, 160 3-persons
1,296 married couples with children.
2,671 single-parent households (621 men, 2,050 women).
91.5% of residents of 43609 zip code speak English at home.
5.6% of residents speak Spanish at home (80% very well, 13% well, 6% not well, 1% not at all).
1.1% of residents speak other Indo-European language at home (86% very well, 14% well).
0.5% of residents speak Asian or Pacific Island language at home (67% very well, 19% well, 14% not well).
1.1% of residents speak other language at home (90% very well, 10% well).
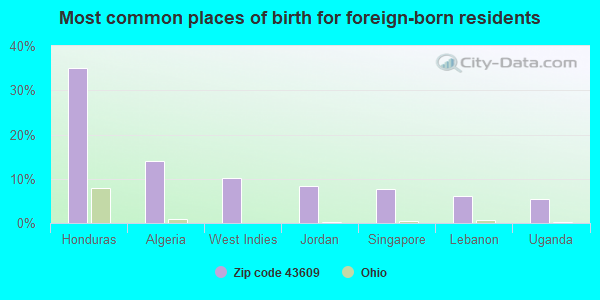
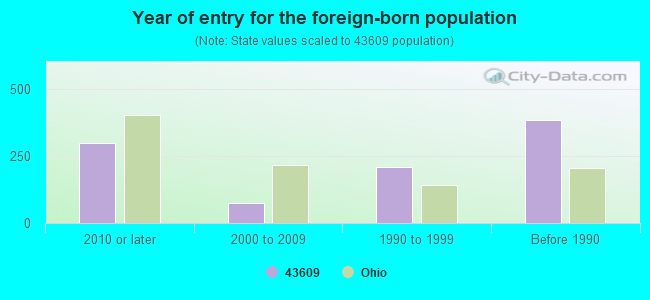
Foreign born population: 648 (3.3%) (48.3% of them are naturalized citizens)
Major facilities with environmental interests located in this zip code:
ANDERSONS RIVER ELEVATOR THE * (440 KUHLMAN DRIVE in TOLEDO, OH)
AIR MAJOR (AIRS/AFS) CRITERIA AND HAZARDOUS AIR POLLUTANT INVENTORY (Inventory of air pollution sources) STATE MASTER (Ohio general info) - AIR MAJOR STATE MASTER (Ohio general info) - RCRA-OHD987050440, HAZARDOUS WASTE PROGRAM, AIR MAJOR, EPCRA Large Quantity Generators, more that 1000 kg of hazardous waste/month (Resource Conservation and Recovery Act (tracking hazardous waste)) - notification Business SIC classification: GRAIN AND FIELD BEANS Organizations: ANDERSONS THE (CONTACT/OWNER)
, THE ANDERSONS (CONTACT/OWNER)
Alternative names: ANDERSONS GRAIN DIV TOLEDO *
ARBOR BIODIESEL CO LLC (100 EDWIN DRIVE in TOLEDO, OH)
AIR MINOR (AIRS/AFS) CRITERIA AND HAZARDOUS AIR POLLUTANT INVENTORY (Inventory of air pollution sources) STATE MASTER (Ohio general info) - EPCRA, TRIS-43609TGCHM100ED, TRI REPORTER, RCRA-OHD980569875, HAZARDOUS WASTE PROGRAM, AIR MAJOR HAZARDOUS WASTE BIENNIAL REPORTER (Resource Conservation and Recovery Act (tracking hazardous waste)) Large Quantity Generators, more that 1000 kg of hazardous waste/month (Resource Conservation and Recovery Act (tracking hazardous waste)) TSD (Resource Conservation and Recovery Act (tracking hazardous waste)) TRI REPORTER (Tracking of toxic chemicals releasing facilities) Business SIC classification: CHEMICALS AND CHEMICAL PREPARATIONS; CHEMICALS AND ALLIED PRODUCTS; NONCLASSIFIABLE ESTABLISHMENTS Alternative names: TAG CHEMICAL, TAG CHEMICALS INC
ARLINGTON ELEMENTARY SCHOOL (700 TORONTO AVE in TOLEDO, OH)
(Geographic Names Information System) (National Center for Education Statistics) - STATE ID-000968 STATE MASTER (Ohio general info) - AIR MAJOR Organizations: TOLEDO CITY SD (SCHOOL DISTRICT)
7 ELEVEN (1101 WESTERN AVE in TOLEDO, OH)
STATE MASTER (Ohio general info) - RCRA-OHD987009511, HAZARDOUS WASTE PROGRAM, EPCRA, AIR MAJOR Small Quantity Generators, between 100 kg and 1000 kg of hazardous waste/month (Resource Conservation and Recovery Act (tracking hazardous waste)) - notification Business SIC classification: GASOLINE SERVICE STATIONS Organizations: SOUTHLAND CORPORATION (CONTACT/OWNER)
Alternative names: 7 ELEVEN 21420
ART IRON INC (860 CURTIS in TOLEDO, OH)
STATE MASTER (Ohio general info) - RCRA-OHD005052022, HAZARDOUS WASTE PROGRAM Small Quantity Generators, between 100 kg and 1000 kg of hazardous waste/month (Resource Conservation and Recovery Act (tracking hazardous waste)) - notification
BATHCREST OF TOLEDO (3659 MARINE RD NO 3 in TOLEDO, OH)
STATE MASTER (Ohio general info) - RCRA-OH0000038232, HAZARDOUS WASTE PROGRAM Conditionally Exempt Small Quantity Generators, less than 100 kg/month of hazardous waste (Resource Conservation and Recovery Act (tracking hazardous waste)) - notification Organizations: MORRIN J A (CONTACT/OWNER)
BLACK EQUIPMENT INC (515 SUMNER ST in TOLEDO, OH)
STATE MASTER (Ohio general info) - RCRA-OHR000016915, HAZARDOUS WASTE PROGRAM Small Quantity Generators, between 100 kg and 1000 kg of hazardous waste/month (Resource Conservation and Recovery Act (tracking hazardous waste)) - notification Organizations: MICK BLACK (CONTACT/OWNER)
BP OIL CO (324 S DETROIT AVE in TOLEDO, OH)
STATE MASTER (Ohio general info) - RCRA-OHD987020369, HAZARDOUS WASTE PROGRAM, -48-5541-905-14, EPCRA Conditionally Exempt Small Quantity Generators, less than 100 kg/month of hazardous waste (Resource Conservation and Recovery Act (tracking hazardous waste)) - notification Business SIC classification: GASOLINE SERVICE STATIONS Organizations: BP OIL COMPANY (CONTACT/OWNER)
Alternative names: BP OIL SITE 06834
CHAMPION CLEANERS (1542 S AVE in TOLEDO, OH)
STATE MASTER (Ohio general info) - AIR MAJOR, RCRA-OHR000020537, HAZARDOUS WASTE PROGRAM Small Quantity Generators, between 100 kg and 1000 kg of hazardous waste/month (Resource Conservation and Recovery Act (tracking hazardous waste)) - notification Organizations: LYNN KAHLE (CONTACT/OWNER)
CHARLES F MANN PAINTING CO (3638 MARINE RD in TOLEDO, OH)
STATE MASTER (Ohio general info) - RCRA-OHD018370049, HAZARDOUS WASTE PROGRAM Small Quantity Generators, between 100 kg and 1000 kg of hazardous waste/month (Resource Conservation and Recovery Act (tracking hazardous waste)) - notification Organizations: MANN CHARLES F SR CHR (CONTACT/OWNER)
Alternative names: MANN CHARLES F PAINTING CO
BP AMOCO OIL CORP BULK PLANT TOLEDO EXPRESS AIRPOR (10971 EAST AIRPORT SERVICE ROAD in TOLEDO, OH)
STATE MASTER (Ohio general info) - PCS-OH0122165, National Pollutant Discharge Elimination System Permit, RCRA-OHD000817775, HAZARDOUS WASTE PROGRAM, AIR MAJOR, EPCRA Conditionally Exempt Small Quantity Generators, less than 100 kg/month of hazardous waste (Resource Conservation and Recovery Act (tracking hazardous waste)) Organizations: AIR BP A DIVISION OF BP NORTH (CONTACT/OWNER)
Alternative names: AIR BP TOLEDO EXPRESS BULK, BP AMOCO OIL CORPORATION BULK PLANT, BP AMOCO OIL CORP BULK PLANT TOLEDO EXPRESS AIRPORT
Housing units lacking complete plumbing facilities: 6.2% Housing units lacking complete kitchen facilities: 5.9%
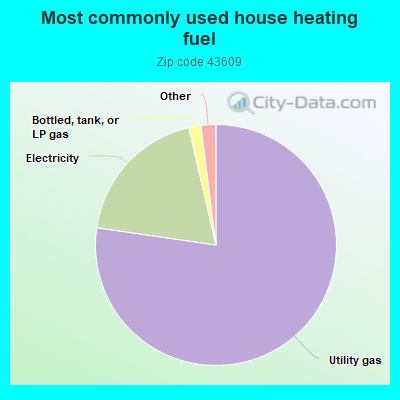
77.3%Utility gas
19.1%Electricity
1.6%Bottled, tank, or LP gas
0.6%Fuel oil, kerosene, etc.
0.5%Wood
Population in 1990: 29,228.
Place of birth for U.S.-born residents:
This state: 14,428
Northeast: 741
Midwest: 1,429
South: 1,926
West: 304
52% of the 43609 zip code residents lived in the same house 5 years ago. Out of people who lived in different houses, 76% lived in this county. Out of people who lived in different counties, 50% lived in Ohio.
86% of the 43609 zip code residents lived in the same house 1 year ago. Out of people who lived in different houses, 63% moved from this county. Out of people who lived in different houses, 6% moved from different county within same state. Out of people who lived in different houses, 23% moved from different state. Out of people who lived in different houses, 4% moved from abroad.
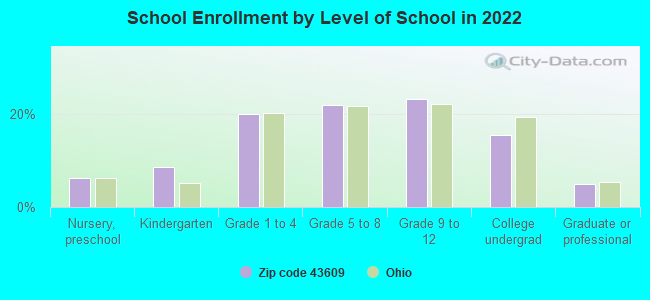
Private vs. public school enrollment:
Students in private schools in grades 1 to 8 (elementary and middle school): 223
Here:
11.9%
Ohio:
16.0%
Students in private schools in grades 9 to 12 (high school): 240
Here:
23.0%
Ohio:
13.1%
Students in private undergraduate colleges: 21
Here:
3.1%
Ohio:
22.3%
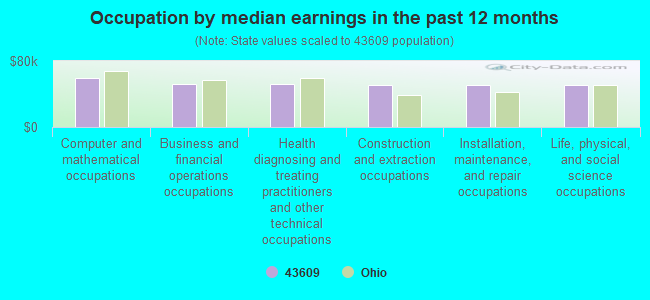
Occupation by median earnings in the past 12 months ($)
59,792Computer and mathematical occupations
52,539Business and financial operations occupations
51,661Health diagnosing and treating practitioners and other technical occupations
51,332Construction and extraction occupations
50,776Installation, maintenance, and repair occupations
50,617Life, physical, and social science occupations
Companies with federal contracts located in this zip code:
PREFERRED POWER INC (3623 MARINE ROAD in TOLEDO, OH; small business)
$73,110 with Army for Miscellaneous Electrical and Electronic Components. Signed on 2004-08-30. Completion date: 2004-10-04.
CUTHBERT, F N INC (3151 SOUTH AVE in TOLEDO, OH; small business) : $20,079 in 3 contractsfrom 2004 to 2005
$12,677 with NASA for . Signed on 2004-01-22. Completion date: 2004-02-26.
$5,303 with NASA for Liquid and Gas Flow, Liquid Level, and Mechanical Motion Measuring Instruments. Signed on 2005-08-18. Completion date: 2005-09-28.
$2,099 with Army for Space and Water Heating Equipment. Signed on 2005-12-08. Completion date: 2005-12-19.
CHAS F MANN PAINTING CO (3638 MARINE RD in TOLEDO, OH; small business) : $17,758 in 2 contractsfrom 2004 to 2006
$13,380 with Army for Modification of Equipment -- Miscellaneous. Signed on 2004-05-05. Completion date: 2004-06-18.
$4,378 with Army for Other Professional Services. Signed on 2006-07-07. Completion date: 2006-09-30.
Top industries in this zip code by the number of employees in 2005:
Construction: Oil and Gas Pipeline and Related Structures Construction (500-999 employees: 1 establishment)
Construction: Industrial Building Construction (500-999: 1)
Arts, Entertainment, and Recreation: Zoos and Botanical Gardens (250-499: 1)
2003 - 2018 National Fire Incident Reporting System (NFIRS) incidents
Based on the data from the years 2003 - 2018 the average number of fires per year is 168. The highest number of fire incidents - 296 took place in 2010, and the least - 96 in 2018. The data has a declining trend.
When looking into fire subcategories, the most reports belonged to: Structure Fires (40.8%), and Outside Fires (28.3%).
Fire incident types reported to NFIRS in Zip Code 43609
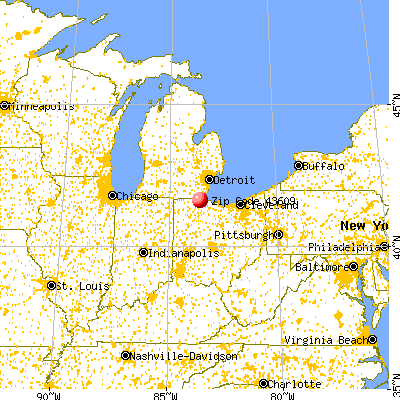


 Nearest zip codes: 43460, 43607, 43620, 43604, 43614, 43610.
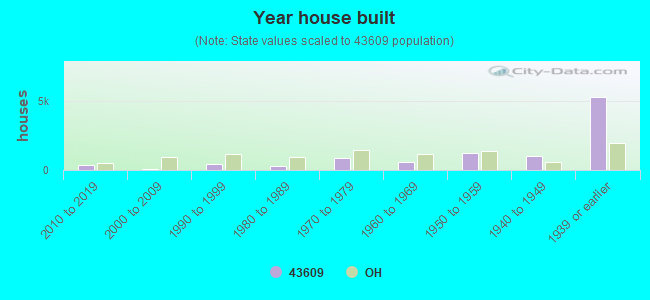


 Based on the data from the years 2003 - 2018 the average number of fires per year is 168. The highest number of fire incidents - 296 took place in 2010, and the least - 96 in 2018. The data has a declining trend.
 When looking into fire subcategories, the most reports belonged to: Structure Fires (40.8%), and Outside Fires (28.3%).