Estimated zip code population in 2022: 28,839 Zip code population in 2010: 29,290 Zip code population in 2000: 30,181
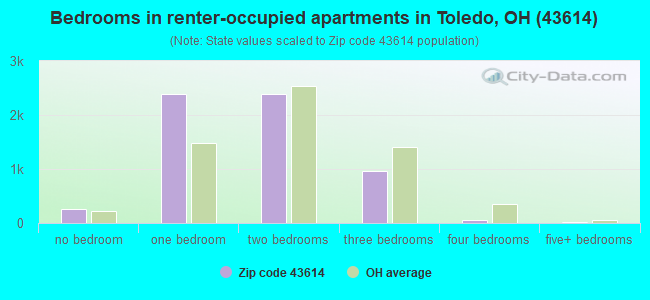
Houses and condos: 14,693 Renter-occupied apartments: 6,012
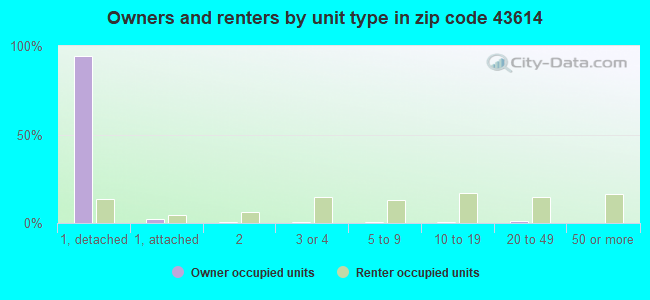
% of renters here:
43%
State:
33%
March 2022 cost of living index in zip code 43614: 92.6 (less than average, U.S. average is 100)
Land area: 9.0 sq. mi. Water area: 0.4 sq. mi.
Population density: 3,194 people per square mile
(average).
OSM Map
General Map
Google Map
MSN Map
OSM Map
General Map
Google Map
MSN Map
OSM Map
General Map
Google Map
MSN Map
OSM Map
General Map
Google Map
MSN Map
Please wait while loading the map...
Real estate property taxes paid for housing units in 2022:
This zip code:
1.6% ($2,652)
Ohio:
1.3% ($2,639)
Median real estate property taxes paid for housing units with mortgages in 2022: $2,671 (1.5%) Median real estate property taxes paid for housing units with no mortgage in 2022: $2,623 (1.7%)
Business Search- 14 Million verified businesses
Males: 14,177
(49.2%)
Females: 14,661
(50.8%)
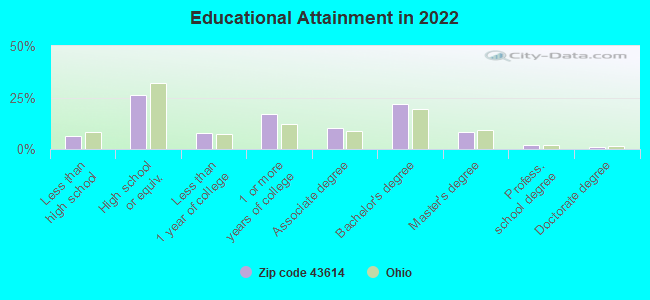
For population 25 years and over in 43614:
High school or higher: 93.6%
Bachelor's degree or higher: 32.5%
Graduate or professional degree: 10.7%
Unemployed: 4.4%
Mean travel time to work (commute): 21.0 minutes
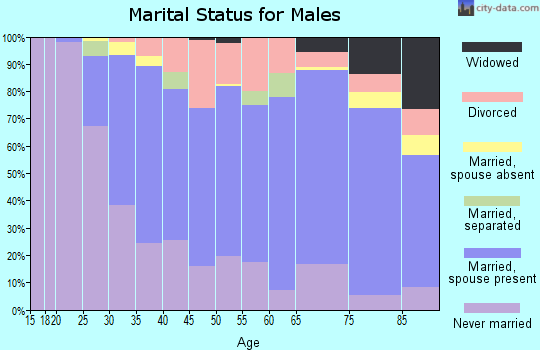
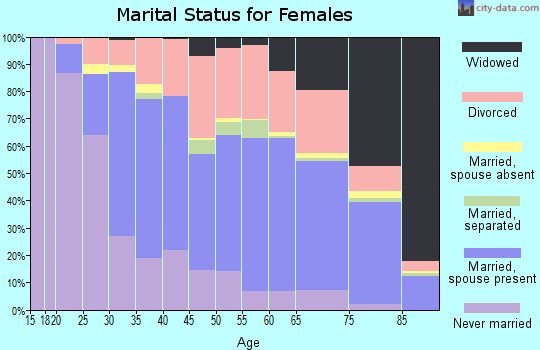
For population 15 years and over in 43614:
Never married: 37.0%
Now married: 40.0%
Separated: 2.0%
Widowed: 7.4%
Divorced: 13.6%
Zip code 43614 compared to state average:
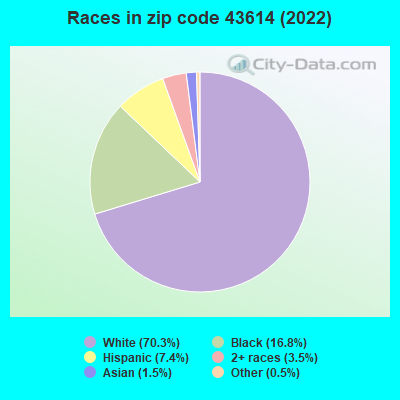
Hispanic race population percentage above state average.
Foreign-born population percentage below state average.
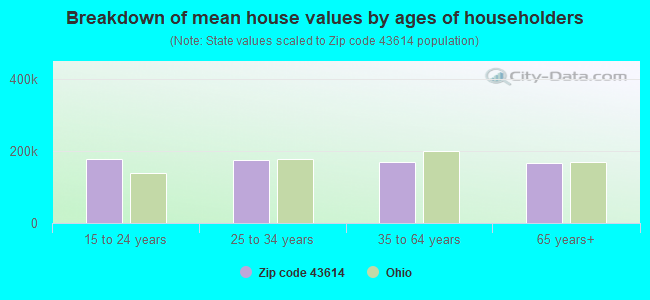
Estimated median house/condo value in 2022: $169,026
43614:
$169,026
Ohio:
$204,100
According to our research of Ohio and other state lists, there were 34 registered sex offenders living in 43614 zip code as of April 27, 2024. The ratio of all residents to sex offenders in zip code 43614 is 923 to 1. The ratio of registered sex offenders to all residents in this zip code is lower than the state average.
Median resident age:
This zip code:
38.5 years
Ohio median age:
39.9 years
Average household size:
This zip code:
2.0 people
Ohio:
2.4 people
Averages for the 2020 tax year for zip code 43614, filed in 2021:
Average Adjusted Gross Income (AGI) in 2020: $51,402 (Individual Income Tax Returns)
Here:
$51,402
State:
$67,288
Salary/wage: $44,272 (reported on 81.7% of returns)
Here:
$44,272
State:
$55,628
(% of AGI for various income ranges: 1179.8% for AGIs below $25k, 3606.8% for AGIs $25k-50k, 6151.6% for AGIs $50k-75k, 9240.3% for AGIs $75k-100k, 15392.0% for AGIs $100k-200k, 66298.0% for AGIs over 200k)
Taxable interest for individuals: $1,019 (reported on 22.5% of returns)
This zip code:
$1,019
Ohio:
$1,518
(% of AGI for various income ranges: 9.2% for AGIs below $25k, 18.9% for AGIs $25k-50k, 32.3% for AGIs $50k-75k, 49.5% for AGIs $75k-100k, 108.5% for AGIs $100k-200k, 844.0% for AGIs over 200k)
Ordinary dividends: $4,662 (reported on 16.1% of returns)
Here:
$4,662
State:
$7,167
(% of AGI for various income ranges: 17.6% for AGIs below $25k, 32.3% for AGIs $25k-50k, 79.8% for AGIs $50k-75k, 137.4% for AGIs $75k-100k, 385.3% for AGIs $100k-200k, 6812.0% for AGIs over 200k)
Net capital gain/loss in AGI: +$5,996 (reported on 13.8% of returns)
Here:
+$5,996
State:
+$18,919
(% of AGI for various income ranges: 6.9% for AGIs below $25k, 21.4% for AGIs $25k-50k, 57.3% for AGIs $50k-75k, 177.9% for AGIs $75k-100k, 421.0% for AGIs $100k-200k, 10202.0% for AGIs over 200k)
Profit/loss from business: +$8,705 (reported on 12.0% of returns)
Here:
+$8,705
State:
+$13,744
(% of AGI for various income ranges: 45.7% for AGIs below $25k, 49.5% for AGIs $25k-50k, 126.3% for AGIs $50k-75k, 240.9% for AGIs $75k-100k, 434.6% for AGIs $100k-200k, 7724.0% for AGIs over 200k)
Taxable individual retirement arrangement distribution: $16,886 (reported on 10.0% of returns)
43614:
$16,886
Ohio:
$18,876
(% of AGI for various income ranges: 64.0% for AGIs below $25k, 100.3% for AGIs $25k-50k, 208.8% for AGIs $50k-75k, 461.8% for AGIs $75k-100k, 815.4% for AGIs $100k-200k, 8026.0% for AGIs over 200k)
Self-employed (Keogh) retirement plans: $17,333 (reported on 0.2% of returns)
43614:
$17,333
Ohio:
$24,898
(% of AGI for various income ranges: 59.8% for AGIs $100k-200k)
Total itemized deductions: $28,787 (reported on 4.1% of returns)
Here:
$28,787
State:
$33,869
(% of AGI for various income ranges: 28.2% for AGIs below $25k, 67.6% for AGIs $25k-50k, 170.8% for AGIs $50k-75k, 272.7% for AGIs $75k-100k, 595.4% for AGIs $100k-200k, 6624.0% for AGIs over 200k)
Charity contributions: $8,880 (reported on 3.2% of returns)
Here:
$8,880
State:
$14,577
(% of AGI for various income ranges: 2.9% for AGIs below $25k, 10.9% for AGIs $25k-50k, 38.9% for AGIs $50k-75k, 58.3% for AGIs $75k-100k, 160.7% for AGIs $100k-200k, 2182.0% for AGIs over 200k)
Taxes paid: $6,227 (reported on 4.0% of returns)
43614:
$6,227
State:
$7,681
(% of AGI for various income ranges: 4.3% for AGIs below $25k, 9.1% for AGIs $25k-50k, 38.3% for AGIs $50k-75k, 76.0% for AGIs $75k-100k, 156.7% for AGIs $100k-200k, 946.0% for AGIs over 200k)
Earned income credit: $2,170 (reported on 15.6% of returns)
Here:
$2,170
State:
$2,304
(% of AGI for various income ranges: 91.4% for AGIs below $25k, 48.9% for AGIs $25k-50k, 0.7% for AGIs $50k-75k)
Percentage of individuals using paid preparers for their 2020 taxes: 92.3%
Here:
92%
State:
94%
(% for various income ranges: 91.8% for AGIs below $25k, 93.1% for AGIs $25k-50k, 92.4% for AGIs $50k-75k, 91.8% for AGIs $75k-100k, 92.5% for AGIs $100k-200k, 90.5% for AGIs over 200k)
Averages for the 2012 tax year for zip code 43614, filed in 2013:
Average Adjusted Gross Income (AGI) in 2012: $45,048 (Individual Income Tax Returns)
Here:
$45,048
State:
$54,926
Salary/wage: $38,724 (reported on 83.2% of returns)
Here:
$38,724
State:
$45,869
(% of AGI for various income ranges: 75.3% for AGIs below $25k, 76.1% for AGIs $25k-50k, 74.5% for AGIs $50k-75k, 72.6% for AGIs $75k-100k, 69.8% for AGIs $100k-200k, 45.5% for AGIs over 200k)
Taxable interest for individuals: $1,022 (reported on 29.8% of returns)
This zip code:
$1,022
Ohio:
$1,297
(% of AGI for various income ranges: 1.0% for AGIs below $25k, 0.6% for AGIs $25k-50k, 0.5% for AGIs $50k-75k, 0.7% for AGIs $75k-100k, 0.7% for AGIs $100k-200k, 0.6% for AGIs over 200k)
Ordinary dividends: $3,569 (reported on 20.1% of returns)
Here:
$3,569
State:
$5,821
(% of AGI for various income ranges: 1.5% for AGIs below $25k, 1.0% for AGIs $25k-50k, 1.3% for AGIs $50k-75k, 1.1% for AGIs $75k-100k, 1.8% for AGIs $100k-200k, 4.9% for AGIs over 200k)
Net capital gain/loss in AGI: +$2,698 (reported on 14.2% of returns)
Here:
+$2,698
State:
+$11,232
(% of AGI for various income ranges: 0.1% for AGIs $25k-50k, 0.4% for AGIs $50k-75k, 0.5% for AGIs $75k-100k, 1.4% for AGIs $100k-200k, 5.3% for AGIs over 200k)
Profit/loss from business: +$10,443 (reported on 11.0% of returns)
Here:
+$10,443
State:
+$12,773
(% of AGI for various income ranges: 4.7% for AGIs below $25k, 1.7% for AGIs $25k-50k, 1.9% for AGIs $50k-75k, 2.3% for AGIs $75k-100k, 2.4% for AGIs $100k-200k, 4.8% for AGIs over 200k)
Taxable individual retirement arrangement distribution: $13,190 (reported on 12.5% of returns)
43614:
$13,190
Ohio:
$14,511
(% of AGI for various income ranges: 3.9% for AGIs below $25k, 2.7% for AGIs $25k-50k, 3.1% for AGIs $50k-75k, 3.6% for AGIs $75k-100k, 4.5% for AGIs $100k-200k, 5.9% for AGIs over 200k)
Self-employment retirement plans: $14,617 (reported on 0.4% of returns)
43614:
$14,617
Ohio:
$20,257
(% of AGI for various income ranges: 0.1% for AGIs $25k-50k, 0.5% for AGIs $100k-200k)
Total itemized deductions: $16,448 (21% of AGI, reported on 30.4% of returns)
Here:
$16,448
State:
$21,278
Here:
20.9% of AGI
State:
18.8% of AGI
(% of AGI for various income ranges: 6.8% for AGIs below $25k, 8.8% for AGIs $25k-50k, 11.7% for AGIs $50k-75k, 12.5% for AGIs $75k-100k, 14.0% for AGIs $100k-200k, 11.8% for AGIs over 200k)
Charity contributions: $3,089 (reported on 24.5% of returns)
Here:
$3,089
State:
$3,943
(% of AGI for various income ranges: 0.7% for AGIs below $25k, 1.0% for AGIs $25k-50k, 1.7% for AGIs $50k-75k, 1.8% for AGIs $75k-100k, 2.4% for AGIs $100k-200k, 2.5% for AGIs over 200k)
Taxes paid: $6,623 (reported on 30.4% of returns)
43614:
$6,623
State:
$9,568
(% of AGI for various income ranges: 1.4% for AGIs below $25k, 2.7% for AGIs $25k-50k, 4.4% for AGIs $50k-75k, 5.2% for AGIs $75k-100k, 6.5% for AGIs $100k-200k, 7.0% for AGIs over 200k)
Earned income credit: $2,088 (reported on 16.7% of returns)
Here:
$2,088
State:
$2,285
(% of AGI for various income ranges: 5.6% for AGIs below $25k, 0.7% for AGIs $25k-50k)
Percentage of individuals using paid preparers for their 2012 taxes: 46.2%
Here:
46%
State:
51%
(% for various income ranges: 39.8% for AGIs below $25k, 45.7% for AGIs $25k-50k, 52.2% for AGIs $50k-75k, 52.8% for AGIs $75k-100k, 55.9% for AGIs $100k-200k, 85.7% for AGIs over 200k)
Averages for the 2004 tax year for zip code 43614, filed in 2005:
Average Adjusted Gross Income (AGI) in 2004: $40,716 (Individual Income Tax Returns)
Here:
$40,716
State:
$44,480
Salary/wage: $37,481 (reported on 82.7% of returns)
Here:
$37,481
State:
$39,198
(% of AGI for various income ranges: 117.4% for AGIs below $10k, 72.2% for AGIs $10k-25k, 78.0% for AGIs $25k-50k, 78.2% for AGIs $50k-75k, 80.7% for AGIs $75k-100k, 66.6% for AGIs over 100k)
Taxable interest for individuals: $1,571 (reported on 47.6% of returns)
This zip code:
$1,571
Ohio:
$1,532
(% of AGI for various income ranges: 7.8% for AGIs below $10k, 2.9% for AGIs $10k-25k, 1.7% for AGIs $25k-50k, 1.6% for AGIs $50k-75k, 1.1% for AGIs $75k-100k, 2.0% for AGIs over 100k)
Taxable dividends: $2,611 (reported on 27.5% of returns)
Here:
$2,611
State:
$3,496
(% of AGI for various income ranges: 5.7% for AGIs below $10k, 1.9% for AGIs $10k-25k, 1.2% for AGIs $25k-50k, 1.4% for AGIs $50k-75k, 1.4% for AGIs $75k-100k, 2.9% for AGIs over 100k)
Net capital gain/loss: +$4,073 (reported on 19.7% of returns)
Here:
+$4,073
State:
+$8,582
(% of AGI for various income ranges: -1.0% for AGIs below $10k, 0.7% for AGIs $10k-25k, 0.5% for AGIs $25k-50k, 0.6% for AGIs $50k-75k, 1.4% for AGIs $75k-100k, 6.6% for AGIs over 100k)
Profit/loss from business: +$11,294 (reported on 10.9% of returns)
Here:
+$11,294
State:
+$10,813
(% of AGI for various income ranges: 4.2% for AGIs below $10k, 2.8% for AGIs $10k-25k, 2.1% for AGIs $25k-50k, 2.5% for AGIs $50k-75k, 2.5% for AGIs $75k-100k, 5.3% for AGIs over 100k)
IRA payment deduction: $2,617 (reported on 2.0% of returns)
43614:
$2,617
Ohio:
$2,794
(% of AGI for various income ranges: 0.3% for AGIs below $10k, 0.2% for AGIs $10k-25k, 0.2% for AGIs $25k-50k, 0.1% for AGIs $50k-75k, 0.1% for AGIs $75k-100k, 0.1% for AGIs over 100k)
Self-employed pension: $12,807 (reported on 0.7% of returns)
Here:
$12,807
Ohio:
$13,981
(% of AGI for various income ranges: 0.1% for AGIs $25k-50k, 0.1% for AGIs $50k-75k, 0.1% for AGIs $75k-100k, 0.8% for AGIs over 100k)
Total itemized deductions: $15,320 (23% of AGI, reported on 40.0% of returns)
Here:
$15,320
State:
$17,503
Here:
23.1% of AGI
State:
20.8% of AGI
(% of AGI for various income ranges: 14.0% for AGIs below $10k, 8.4% for AGIs $10k-25k, 12.5% for AGIs $25k-50k, 16.2% for AGIs $50k-75k, 17.0% for AGIs $75k-100k, 18.4% for AGIs over 100k)
Charity contributions deductions: $2,609 (4% of AGI, reported on 34.3% of returns)
Here:
$2,609
State:
$3,087
Here:
3.8% of AGI
State:
3.4% of AGI
(% of AGI for various income ranges: 0.8% for AGIs below $10k, 0.9% for AGIs $10k-25k, 1.5% for AGIs $25k-50k, 2.2% for AGIs $50k-75k, 2.3% for AGIs $75k-100k, 3.7% for AGIs over 100k)
Total tax: $5,272 (reported on 79.2% of returns)
43614:
$5,272
State:
$6,781
(% of AGI for various income ranges: 2.6% for AGIs below $10k, 4.4% for AGIs $10k-25k, 7.9% for AGIs $25k-50k, 9.8% for AGIs $50k-75k, 10.4% for AGIs $75k-100k, 16.8% for AGIs over 100k)
Earned income credit: $1,497 (reported on 10.6% of returns)
Here:
$1,497
State:
$1,696
Percentage of individuals using paid preparers for their 2004 taxes: 50.6%
Here:
51%
State:
55%
(% for various income ranges: 40.9% for AGIs below $10k, 49.2% for AGIs $10k-25k, 52.1% for AGIs $25k-50k, 56.3% for AGIs $50k-75k, 52.9% for AGIs $75k-100k, 59.2% for AGIs over 100k)
Likely homosexual households (counted as self-reported same-sex unmarried-partner households)
Lesbian couples: 0.2% of all households
Gay men: 0.1% of all households
Household received Food Stamps/SNAP in the past 12 months: 1,879 Household did not receive Food Stamps/SNAP in the past 12 months: 12,246
Women who had a birth in the past 12 months: 288 (128 now married, 156 unmarried) Women who did not have a birth in the past 12 months: 5,644 (2,105 now married, 3,539 unmarried)
Housing units in zip code 43614 with a mortgage: 5,490 (421 second mortgage, 6 home equity loan, 377 both second mortgage and home equity loan) Houses without a mortgage: 314
Median monthly owner costs for units with a mortgage: $1,239 Median monthly owner costs for units without a mortgage: $537
Residents with income below the poverty level in 2022:
This zip code:
16.6%
Whole state:
13.4%
Residents with income below 50% of the poverty level in 2022:
This zip code:
6.5%
Whole state:
7.0%
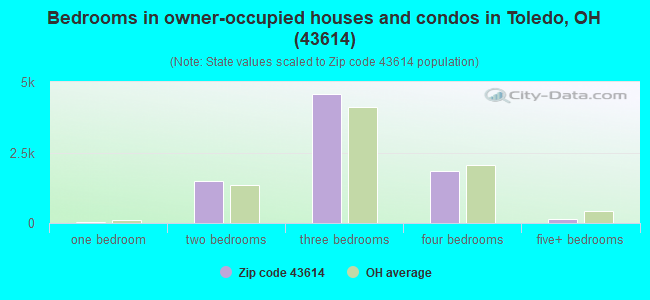
Median number of rooms in houses and condos:
Here:
6.8
State:
6.7
Median number of rooms in apartments:
Here:
4.0
State:
4.4
Notable locations in this zip code not listed on our city pages
Notable locations in zip code 43614: Glenbyrne Center (A), Gould Yard (B), Charles W Matthews Stadium (C), Heather Downs Country Club (D), Toledo Country Club (E), Brookside Ambulance Service Rumpf Ambulance (F), Medcorp Emergency Medical Services (G), Toledo Fire and Rescue Department Station 21 (H). Display/hide their locations on the map
Shopping Centers: Southland Shopping Center (1), Heatherdowns Shopping Center (2), Heatherdowns Village Shopping Center (3), Colonial Village Shopping Center (4), Glendale Gardens Shopping Center (5), Pillars Shopping Center (6), Dimensions Plaza Shopping Center (7), Brownstone Plaza Shopping Center (8), Glendale Marketplace Shopping Center (9). Display/hide their locations on the map
Churches in zip code 43614 include: The Church of Jesus Christ of Latter Day Saints (A), Our Lady of Perpetual Help Catholic Church (B), Concordia Lutheran Church (C), Detroit Avenue Wesleyan Church (D), Saint Joan of Arc Catholic Church (E), All Saints Lutheran Church (F), Calvary Assembly of God Church (G), Church of the Cross United Methodist Church (H), Heatherdowns Church of the Brethren (I). Display/hide their locations on the map
Parks in zip code 43614 include: Toledo Zoological Gardens (1), Laurel Hill Swim and Tennis Club (2), Copeland Park (3), Swan Creek Preserve Metropark (4). Display/hide their locations on the map
2,901 married couples with children.
2,060 single-parent households (472 men, 1,588 women).
95.1% of residents of 43614 zip code speak English at home.
1.7% of residents speak Spanish at home (81% very well, 9% well, 7% not well, 3% not at all).
1.7% of residents speak other Indo-European language at home (67% very well, 33% well).
0.6% of residents speak Asian or Pacific Island language at home (55% very well, 42% well, 1% not well, 2% not at all).
0.9% of residents speak other language at home (78% very well, 6% well, 2% not well, 14% not at all).
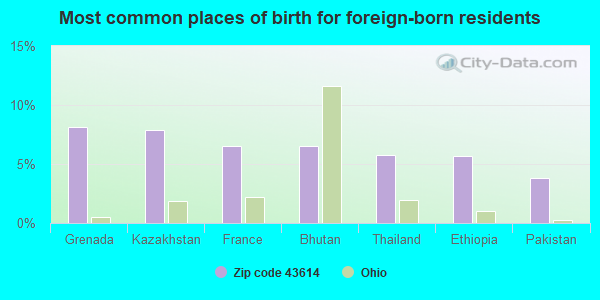
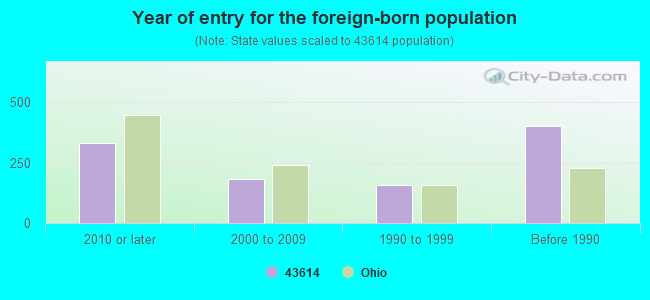
Foreign born population: 920 (3.2%) (68.5% of them are naturalized citizens)
Facilities with environmental interests located in this zip code:
BOWSHER HIGH SCHOOL (3548 S DETROIT AVE in TOLEDO, OH)
(Geographic Names Information System) (National Center for Education Statistics) - STATE ID-003301 STATE MASTER (Ohio general info) - AIR MAJOR Conditionally Exempt Small Quantity Generators, less than 100 kg/month of hazardous waste (Resource Conservation and Recovery Act (tracking hazardous waste)) Organizations: TOLEDO PUBLIC SCHOOLS (CONTACT/OPERATOR)
, TOLEDO CITY SD (SCHOOL DISTRICT)
BEVERLY ELEMENTARY SCHOOL (4022 RUGBY DR in TOLEDO, OH)
(Geographic Names Information System) (National Center for Education Statistics) - STATE ID-002642 STATE MASTER (Ohio general info) - AIR MAJOR Organizations: TOLEDO CITY SD (SCHOOL DISTRICT)
AL JAN SALES INC (5321 SOUTHWYCK BLVD in TOLEDO, OH)
STATE MASTER (Ohio general info) - RCRA-OHD097228613, HAZARDOUS WASTE PROGRAM TRANSPORTER (Resource Conservation and Recovery Act (tracking hazardous waste)) Organizations: LOWERY JACK (CONTACT/OWNER)
Alternative names: JAN AL SALES INC
BEVERLY AUTOMOTIVE (3734 S DETROIT AVE in TOLEDO, OH)
STATE MASTER (Ohio general info) - RCRA-OHD000806695, HAZARDOUS WASTE PROGRAM Small Quantity Generators, between 100 kg and 1000 kg of hazardous waste/month (Resource Conservation and Recovery Act (tracking hazardous waste)) - notification Organizations: ST AUBIN FORREST (CONTACT/OWNER)
BOBB S CLEANERS (4338 S DETROIT in TOLEDO, OH)
STATE MASTER (Ohio general info) - AIR MAJOR Small Quantity Generators, between 100 kg and 1000 kg of hazardous waste/month (Resource Conservation and Recovery Act (tracking hazardous waste)) - notification Organizations: ZDAWCZYK EUGENE (CONTACT/OWNER)
Alternative names: BOBB'S CLEANERS
BP OIL COMPANY #06617 (2441 S. REYNOLDS in TOLEDO, OH)
AIR MINOR (AIRS/AFS) Business SIC classification: GASOLINE SERVICE STATIONS
Housing units lacking complete plumbing facilities: 1.3% Housing units lacking complete kitchen facilities: 2.4%
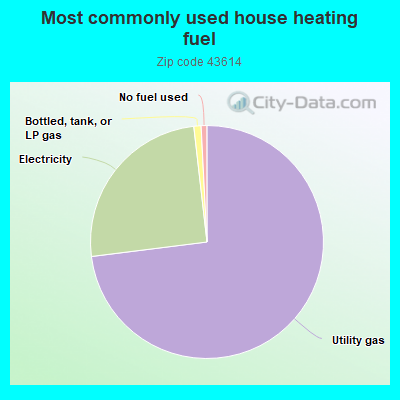
72.8%Utility gas
25.1%Electricity
1.0%Bottled, tank, or LP gas
0.8%No fuel used
Population in 1990: 31,020.
Place of birth for U.S.-born residents:
This state: 21,692
Northeast: 561
Midwest: 2,838
South: 1,912
West: 697
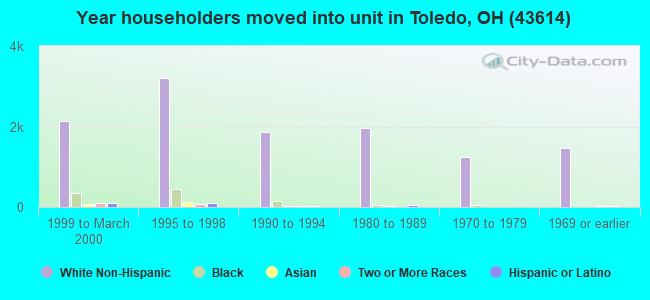
55% of the 43614 zip code residents lived in the same house 5 years ago. Out of people who lived in different houses, 72% lived in this county. Out of people who lived in different counties, 50% lived in Ohio.
88% of the 43614 zip code residents lived in the same house 1 year ago. Out of people who lived in different houses, 63% moved from this county. Out of people who lived in different houses, 13% moved from different county within same state. Out of people who lived in different houses, 20% moved from different state. Out of people who lived in different houses, 1% moved from abroad.
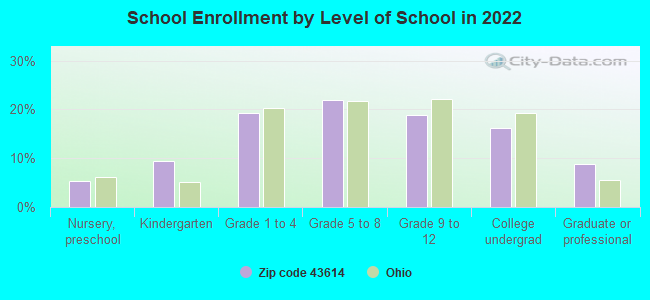
Private vs. public school enrollment:
Students in private schools in grades 1 to 8 (elementary and middle school): 445
Here:
18.3%
Ohio:
16.0%
Students in private schools in grades 9 to 12 (high school): 287
Here:
25.9%
Ohio:
13.1%
Students in private undergraduate colleges: 43
Here:
4.5%
Ohio:
22.3%
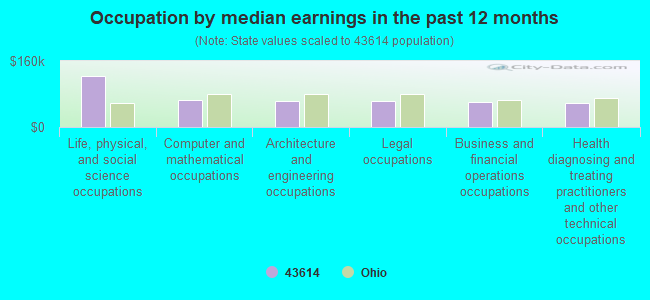
Occupation by median earnings in the past 12 months ($)
123,493Life, physical, and social science occupations
66,639Computer and mathematical occupations
63,578Architecture and engineering occupations
62,830Legal occupations
61,208Business and financial operations occupations
57,145Health diagnosing and treating practitioners and other technical occupations
Companies with federal contracts located in this zip code:
MEDICAL COLLEGE OF OHIO (3000 ARLINGTON AVE in TOLEDO, OH) : $16,106,487 in 105 contractsfrom 1999 to 2006
Contracts for Biomedical -- Applied Research and Exploratory Development (R&D), Biomedical -- Basic Research (R&D), Lease or Rental of Facilities -- Laboratories and Clinics, Physical Sciences -- Management and Support (R&D), and moreby National Institutes of Health, Department of Veterans Affairs, Army, Bureau of Land Management, and others Signed by year:2000: $2,420,906; 2001: $2,859,488; 2002: $3,060,084; 2003: $1,635,446; 2004: $1,637,381; 2005: $2,117,506; 2006: $905,000.
Biggest contracts:
$984,000 with National Institutes of Health for Biomedical -- Applied Research and Exploratory Development (R&D). Signed on 1999-10-15. Completion date: 2002-09-15.
$966,000, same as above.Signed on 2001-09-15. Completion date: 2002-09-15.
$939,000, same as above.Signed on 2000-09-15. Completion date: 2002-09-15.
$929,040 with National Institutes of Health for Biomedical -- Basic Research (R&D). Signed on 2005-05-23. Effective on 2005-05-16. Completion date: 2009-04-29.
AMETEK/PRESTOLITE POWER & SWIT (2166 LAUREL VALLEY DR in TOLEDO, OH) : $2,093,971 in 40 contractsfrom 2001 to 2006
Contracts for Electrical Control Equipment, Relays and Solenoids, Switches, Engine Electrical System Components, Nonaircraft by Army, Defense Logistics Agency, Navy Signed by year:2000: $0; 2001: $129,152; 2002: $99,316; 2003: $768,474; 2004: $700,001; 2005: $235,994; 2006: $161,034.
Biggest contracts:
$231,329 with Army for Electrical Control Equipment. Signed on 2004-04-16. Completion date: 2004-08-30.
$231,329, same as above.Signed on 2003-10-23. Completion date: 2004-01-10.
$208,275 with Defense Logistics Agency for Relays and Solenoids. Signed on 2003-10-23. Completion date: 2004-04-27.
$125,895, same as above.Signed on 2004-01-28. Completion date: 2004-06-05.
Top industries in this zip code by the number of employees in 2005:
2003 - 2018 National Fire Incident Reporting System (NFIRS) incidents
Based on the data from the years 2003 - 2018 the average number of fires per year is 92. The highest number of reported fire incidents - 131 took place in 2010, and the least - 45 in 2017. The data has a decreasing trend.
When looking into fire subcategories, the most incidents belonged to: Structure Fires (36.2%), and Outside Fires (29.5%).
Fire incident types reported to NFIRS in Zip Code 43614

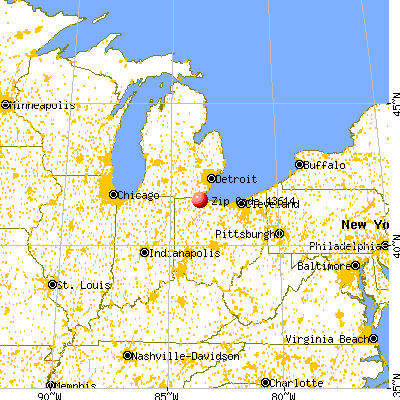


 Nearest zip codes: 43607, 43609, 43615, 43537, 43460, 43606.


 Based on the data from the years 2003 - 2018 the average number of fires per year is 92. The highest number of reported fire incidents - 131 took place in 2010, and the least - 45 in 2017. The data has a decreasing trend.
 When looking into fire subcategories, the most incidents belonged to: Structure Fires (36.2%), and Outside Fires (29.5%).