Estimated zip code population in 2022: 39,342 Zip code population in 2010: 39,441 Zip code population in 2000: 39,376
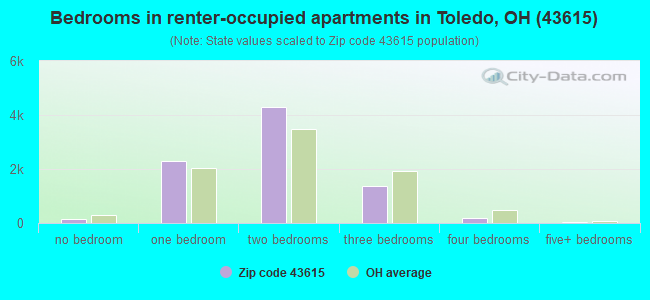
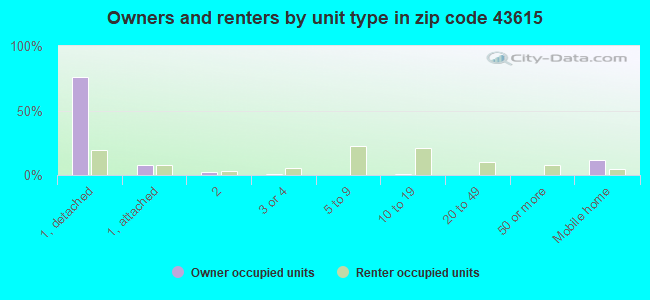
Houses and condos: 19,640 Renter-occupied apartments: 8,264
% of renters here:
44%
State:
33%
March 2022 cost of living index in zip code 43615: 92.2 (less than average, U.S. average is 100)
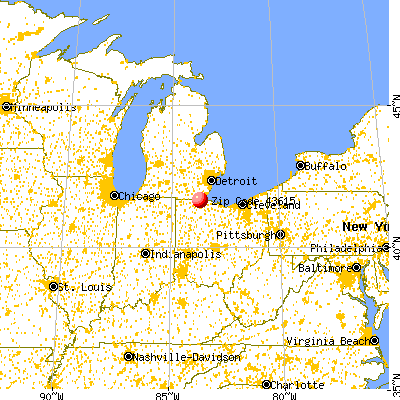
Land area: 16.2 sq. mi. Water area: 0.0 sq. mi.
Population density: 2,425 people per square mile
(low).
OSM Map
General Map
Google Map
MSN Map
OSM Map
General Map
Google Map
MSN Map
OSM Map
General Map
Google Map
MSN Map
OSM Map
General Map
Google Map
MSN Map
Please wait while loading the map...
Real estate property taxes paid for housing units in 2022:
This zip code:
1.8% ($2,385)
Ohio:
1.3% ($2,639)
Median real estate property taxes paid for housing units with mortgages in 2022: $2,607 (1.9%) Median real estate property taxes paid for housing units with no mortgage in 2022: $1,833 (1.7%)
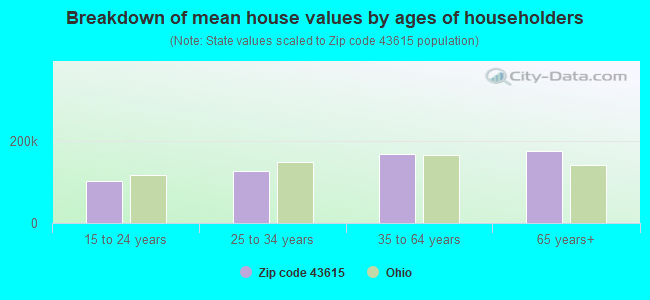
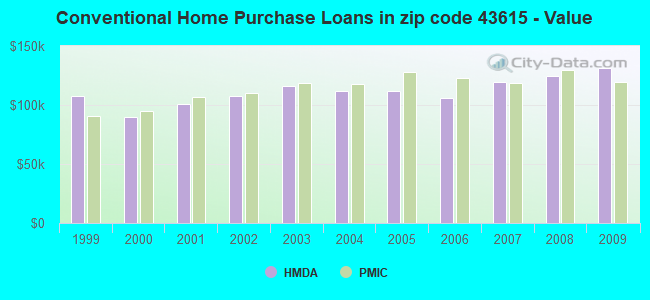
Estimated median house/condo value in 2022: $131,167
43615:
$131,167
Ohio:
$204,100
According to our research of Ohio and other state lists, there were 54 registered sex offenders living in 43615 zip code as of April 27, 2024. The ratio of all residents to sex offenders in zip code 43615 is 747 to 1. The ratio of registered sex offenders to all residents in this zip code is lower than the state average.
Median resident age:
This zip code:
39.1 years
Ohio median age:
39.9 years
Average household size:
This zip code:
2.1 people
Ohio:
2.4 people
Averages for the 2020 tax year for zip code 43615, filed in 2021:
Average Adjusted Gross Income (AGI) in 2020: $56,404 (Individual Income Tax Returns)
Here:
$56,404
State:
$67,288
Salary/wage: $46,031 (reported on 82.4% of returns)
Here:
$46,031
State:
$55,628
(% of AGI for various income ranges: 1153.8% for AGIs below $25k, 3544.1% for AGIs $25k-50k, 6273.6% for AGIs $50k-75k, 9297.1% for AGIs $75k-100k, 16184.1% for AGIs $100k-200k, 123744.2% for AGIs over 200k)
Taxable interest for individuals: $1,348 (reported on 18.8% of returns)
This zip code:
$1,348
Ohio:
$1,518
(% of AGI for various income ranges: 6.6% for AGIs below $25k, 10.5% for AGIs $25k-50k, 28.6% for AGIs $50k-75k, 43.6% for AGIs $75k-100k, 132.1% for AGIs $100k-200k, 1669.2% for AGIs over 200k)
Ordinary dividends: $8,497 (reported on 13.2% of returns)
Here:
$8,497
State:
$7,167
(% of AGI for various income ranges: 14.3% for AGIs below $25k, 19.7% for AGIs $25k-50k, 47.2% for AGIs $50k-75k, 90.9% for AGIs $75k-100k, 412.0% for AGIs $100k-200k, 12656.7% for AGIs over 200k)
Net capital gain/loss in AGI: +$20,215 (reported on 12.2% of returns)
Here:
+$20,215
State:
+$18,919
(% of AGI for various income ranges: 5.5% for AGIs below $25k, 15.1% for AGIs $25k-50k, 62.3% for AGIs $50k-75k, 101.5% for AGIs $75k-100k, 667.4% for AGIs $100k-200k, 33621.7% for AGIs over 200k)
Profit/loss from business: +$10,659 (reported on 13.4% of returns)
Here:
+$10,659
State:
+$13,744
(% of AGI for various income ranges: 55.6% for AGIs below $25k, 56.1% for AGIs $25k-50k, 140.8% for AGIs $50k-75k, 208.0% for AGIs $75k-100k, 657.3% for AGIs $100k-200k, 9862.5% for AGIs over 200k)
Taxable individual retirement arrangement distribution: $16,866 (reported on 8.5% of returns)
43615:
$16,866
Ohio:
$18,876
(% of AGI for various income ranges: 49.6% for AGIs below $25k, 73.8% for AGIs $25k-50k, 185.7% for AGIs $50k-75k, 363.9% for AGIs $75k-100k, 933.8% for AGIs $100k-200k, 5401.7% for AGIs over 200k)
Self-employed (Keogh) retirement plans: $32,971 (reported on 0.4% of returns)
43615:
$32,971
Ohio:
$24,898
(% of AGI for various income ranges: 38.2% for AGIs $75k-100k, 1598.3% for AGIs over 200k)
Total itemized deductions: $33,618 (reported on 4.8% of returns)
Here:
$33,618
State:
$33,869
(% of AGI for various income ranges: 24.1% for AGIs below $25k, 57.0% for AGIs $25k-50k, 182.2% for AGIs $50k-75k, 310.2% for AGIs $75k-100k, 752.0% for AGIs $100k-200k, 11916.7% for AGIs over 200k)
Charity contributions: $15,666 (reported on 4.0% of returns)
Here:
$15,666
State:
$14,577
(% of AGI for various income ranges: 2.2% for AGIs below $25k, 11.6% for AGIs $25k-50k, 42.5% for AGIs $50k-75k, 72.6% for AGIs $75k-100k, 244.9% for AGIs $100k-200k, 6766.7% for AGIs over 200k)
Taxes paid: $7,347 (reported on 4.7% of returns)
43615:
$7,347
State:
$7,681
(% of AGI for various income ranges: 3.6% for AGIs below $25k, 10.0% for AGIs $25k-50k, 44.5% for AGIs $50k-75k, 84.0% for AGIs $75k-100k, 232.6% for AGIs $100k-200k, 1968.3% for AGIs over 200k)
Earned income credit: $2,280 (reported on 19.1% of returns)
Here:
$2,280
State:
$2,304
(% of AGI for various income ranges: 100.4% for AGIs below $25k, 61.0% for AGIs $25k-50k, 1.0% for AGIs $50k-75k)
Percentage of individuals using paid preparers for their 2020 taxes: 93.4%
Here:
93%
State:
94%
(% for various income ranges: 93.3% for AGIs below $25k, 94.0% for AGIs $25k-50k, 93.2% for AGIs $50k-75k, 91.9% for AGIs $75k-100k, 93.2% for AGIs $100k-200k, 94.1% for AGIs over 200k)
Averages for the 2012 tax year for zip code 43615, filed in 2013:
Average Adjusted Gross Income (AGI) in 2012: $51,077 (Individual Income Tax Returns)
Here:
$51,077
State:
$54,926
Salary/wage: $42,151 (reported on 84.6% of returns)
Here:
$42,151
State:
$45,869
(% of AGI for various income ranges: 75.9% for AGIs below $25k, 78.2% for AGIs $25k-50k, 76.8% for AGIs $50k-75k, 76.4% for AGIs $75k-100k, 68.2% for AGIs $100k-200k, 56.0% for AGIs over 200k)
Taxable interest for individuals: $1,716 (reported on 24.4% of returns)
This zip code:
$1,716
Ohio:
$1,297
(% of AGI for various income ranges: 0.6% for AGIs below $25k, 0.4% for AGIs $25k-50k, 0.4% for AGIs $50k-75k, 0.5% for AGIs $75k-100k, 0.9% for AGIs $100k-200k, 1.5% for AGIs over 200k)
Ordinary dividends: $8,830 (reported on 15.4% of returns)
Here:
$8,830
State:
$5,821
(% of AGI for various income ranges: 1.0% for AGIs below $25k, 0.6% for AGIs $25k-50k, 1.0% for AGIs $50k-75k, 0.9% for AGIs $75k-100k, 2.4% for AGIs $100k-200k, 6.4% for AGIs over 200k)
Net capital gain/loss in AGI: +$8,577 (reported on 11.5% of returns)
Here:
+$8,577
State:
+$11,232
(% of AGI for various income ranges: 0.2% for AGIs $25k-50k, 0.3% for AGIs $50k-75k, 0.6% for AGIs $75k-100k, 1.9% for AGIs $100k-200k, 5.4% for AGIs over 200k)
Profit/loss from business: +$13,032 (reported on 11.7% of returns)
Here:
+$13,032
State:
+$12,773
(% of AGI for various income ranges: 5.9% for AGIs below $25k, 1.8% for AGIs $25k-50k, 1.8% for AGIs $50k-75k, 1.5% for AGIs $75k-100k, 2.9% for AGIs $100k-200k, 4.0% for AGIs over 200k)
Taxable individual retirement arrangement distribution: $16,469 (reported on 9.9% of returns)
43615:
$16,469
Ohio:
$14,511
(% of AGI for various income ranges: 2.7% for AGIs below $25k, 2.4% for AGIs $25k-50k, 2.7% for AGIs $50k-75k, 3.0% for AGIs $75k-100k, 5.5% for AGIs $100k-200k, 3.1% for AGIs over 200k)
Self-employment retirement plans: $22,122 (reported on 0.5% of returns)
43615:
$22,122
Ohio:
$20,257
(% of AGI for various income ranges: 0.2% for AGIs $100k-200k, 0.6% for AGIs over 200k)
Total itemized deductions: $23,242 (20% of AGI, reported on 26.9% of returns)
Here:
$23,242
State:
$21,278
Here:
20.2% of AGI
State:
18.8% of AGI
(% of AGI for various income ranges: 6.5% for AGIs below $25k, 8.9% for AGIs $25k-50k, 11.7% for AGIs $50k-75k, 13.3% for AGIs $75k-100k, 15.9% for AGIs $100k-200k, 14.9% for AGIs over 200k)
Charity contributions: $4,421 (reported on 21.2% of returns)
Here:
$4,421
State:
$3,943
(% of AGI for various income ranges: 0.6% for AGIs below $25k, 1.2% for AGIs $25k-50k, 1.8% for AGIs $50k-75k, 2.1% for AGIs $75k-100k, 2.6% for AGIs $100k-200k, 2.3% for AGIs over 200k)
Taxes paid: $11,347 (reported on 26.8% of returns)
43615:
$11,347
State:
$9,568
(% of AGI for various income ranges: 1.4% for AGIs below $25k, 2.8% for AGIs $25k-50k, 4.3% for AGIs $50k-75k, 5.5% for AGIs $75k-100k, 7.5% for AGIs $100k-200k, 10.3% for AGIs over 200k)
Earned income credit: $2,256 (reported on 22.3% of returns)
Here:
$2,256
State:
$2,285
(% of AGI for various income ranges: 7.4% for AGIs below $25k, 1.0% for AGIs $25k-50k)
Percentage of individuals using paid preparers for their 2012 taxes: 47.4%
Here:
47%
State:
51%
(% for various income ranges: 41.3% for AGIs below $25k, 47.2% for AGIs $25k-50k, 53.3% for AGIs $50k-75k, 57.1% for AGIs $75k-100k, 58.7% for AGIs $100k-200k, 82.5% for AGIs over 200k)
Averages for the 2004 tax year for zip code 43615, filed in 2005:
Average Adjusted Gross Income (AGI) in 2004: $49,192 (Individual Income Tax Returns)
Here:
$49,192
State:
$44,480
Salary/wage: $40,015 (reported on 86.2% of returns)
Here:
$40,015
State:
$39,198
(% of AGI for various income ranges: 97.1% for AGIs below $10k, 77.9% for AGIs $10k-25k, 82.6% for AGIs $25k-50k, 83.1% for AGIs $50k-75k, 80.3% for AGIs $75k-100k, 52.3% for AGIs over 100k)
Taxable interest for individuals: $1,959 (reported on 37.9% of returns)
This zip code:
$1,959
Ohio:
$1,532
(% of AGI for various income ranges: 3.7% for AGIs below $10k, 1.7% for AGIs $10k-25k, 1.0% for AGIs $25k-50k, 1.0% for AGIs $50k-75k, 0.9% for AGIs $75k-100k, 2.0% for AGIs over 100k)
Taxable dividends: $4,990 (reported on 20.5% of returns)
Here:
$4,990
State:
$3,496
(% of AGI for various income ranges: 5.1% for AGIs below $10k, 1.3% for AGIs $10k-25k, 1.0% for AGIs $25k-50k, 0.9% for AGIs $50k-75k, 1.6% for AGIs $75k-100k, 3.3% for AGIs over 100k)
Net capital gain/loss: +$12,740 (reported on 16.2% of returns)
Here:
+$12,740
State:
+$8,582
(% of AGI for various income ranges: -2.3% for AGIs below $10k, 0.2% for AGIs $10k-25k, 0.2% for AGIs $25k-50k, 0.7% for AGIs $50k-75k, 1.2% for AGIs $75k-100k, 9.8% for AGIs over 100k)
Profit/loss from business: +$12,564 (reported on 10.9% of returns)
Here:
+$12,564
State:
+$10,813
(% of AGI for various income ranges: 6.1% for AGIs below $10k, 3.0% for AGIs $10k-25k, 1.7% for AGIs $25k-50k, 2.4% for AGIs $50k-75k, 3.2% for AGIs $75k-100k, 3.2% for AGIs over 100k)
IRA payment deduction: $2,476 (reported on 1.7% of returns)
43615:
$2,476
Ohio:
$2,794
(% of AGI for various income ranges: 0.2% for AGIs below $10k, 0.1% for AGIs $10k-25k, 0.1% for AGIs $25k-50k, 0.1% for AGIs $50k-75k, 0.1% for AGIs $75k-100k, 0.0% for AGIs over 100k)
Self-employed pension: $15,347 (reported on 0.8% of returns)
Here:
$15,347
Ohio:
$13,981
(% of AGI for various income ranges: 0.0% for AGIs $10k-25k, 0.0% for AGIs $25k-50k, 0.1% for AGIs $50k-75k, 0.2% for AGIs $75k-100k, 0.5% for AGIs over 100k)
Total itemized deductions: $19,232 (20% of AGI, reported on 35.0% of returns)
Here:
$19,232
State:
$17,503
Here:
19.8% of AGI
State:
20.8% of AGI
(% of AGI for various income ranges: 9.2% for AGIs below $10k, 7.2% for AGIs $10k-25k, 12.9% for AGIs $25k-50k, 15.3% for AGIs $50k-75k, 16.9% for AGIs $75k-100k, 14.2% for AGIs over 100k)
Charity contributions deductions: $3,513 (3% of AGI, reported on 29.6% of returns)
Here:
$3,513
State:
$3,087
Here:
3.3% of AGI
State:
3.4% of AGI
(% of AGI for various income ranges: 0.6% for AGIs below $10k, 0.7% for AGIs $10k-25k, 1.6% for AGIs $25k-50k, 2.2% for AGIs $50k-75k, 2.5% for AGIs $75k-100k, 2.6% for AGIs over 100k)
Total tax: $8,979 (reported on 75.1% of returns)
43615:
$8,979
State:
$6,781
(% of AGI for various income ranges: 2.2% for AGIs below $10k, 4.1% for AGIs $10k-25k, 7.5% for AGIs $25k-50k, 9.9% for AGIs $50k-75k, 11.3% for AGIs $75k-100k, 21.9% for AGIs over 100k)
Earned income credit: $1,686 (reported on 15.5% of returns)
Here:
$1,686
State:
$1,696
Percentage of individuals using paid preparers for their 2004 taxes: 52.9%
Here:
53%
State:
55%
(% for various income ranges: 45.6% for AGIs below $10k, 51.1% for AGIs $10k-25k, 53.1% for AGIs $25k-50k, 56.4% for AGIs $50k-75k, 58.8% for AGIs $75k-100k, 68.8% for AGIs over 100k)
Likely homosexual households (counted as self-reported same-sex unmarried-partner households)
Lesbian couples: 0.7% of all households
Gay men: 0.2% of all households
Household received Food Stamps/SNAP in the past 12 months: 3,188 Household did not receive Food Stamps/SNAP in the past 12 months: 15,747
Women who had a birth in the past 12 months: 805 (395 now married, 402 unmarried) Women who did not have a birth in the past 12 months: 8,328 (2,705 now married, 5,625 unmarried)
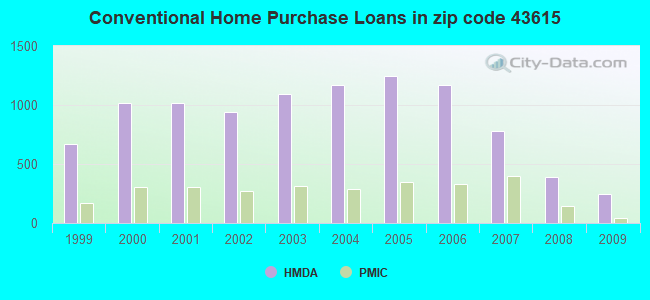
Housing units in zip code 43615 with a mortgage: 6,190 (815 second mortgage, 33 home equity loan, 597 both second mortgage and home equity loan) Houses without a mortgage: 168
Median monthly owner costs for units with a mortgage: $1,201 Median monthly owner costs for units without a mortgage: $594
Residents with income below the poverty level in 2022:
This zip code:
15.1%
Whole state:
13.4%
Residents with income below 50% of the poverty level in 2022:
This zip code:
7.3%
Whole state:
7.0%
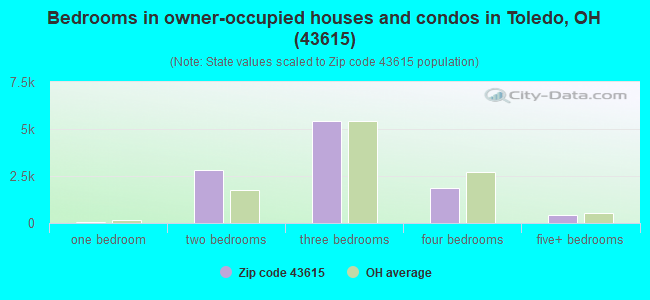
Median number of rooms in houses and condos:
Here:
6.4
State:
6.7
Median number of rooms in apartments:
Here:
4.2
State:
4.4
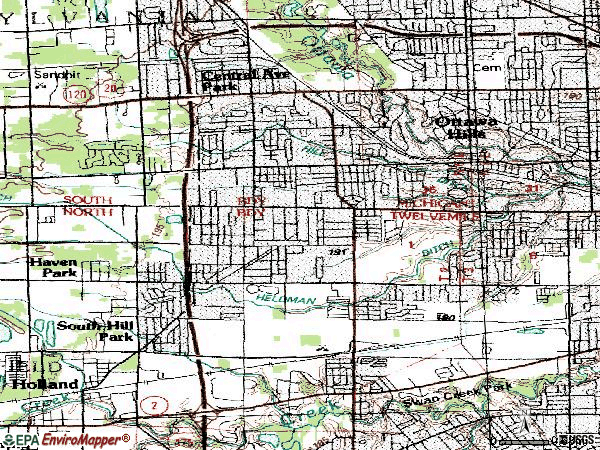
Notable locations in this zip code not listed on our city pages
Notable locations in zip code 43615: Inverness Golf Club (A), Medcorp Emergency Medical Services (B), Toledo Fire and Rescue Department Station 14 (C), Ottawa Hills Fire and Rescue Department (D), Toledo Fire and Rescue Department Station 11 (E), Reynolds Corners Branch Library (F). Display/hide their locations on the map
Shopping Centers: Reynolds Corners Shopping Center (1), Dorr-Suburban Plaza Shopping Center (2), Greenridge Plaza Shopping Center (3), Swan Creek Plaza Shopping Center (4), Fourty four Plaza Shopping Center (5), Crosstrails Shopping Center (6), South Village Square Shopping Center (7), Bancroft Shopping Center (8), Meadowbrook Plaza Shopping Center (9). Display/hide their locations on the map
Churches in zip code 43615 include: Westside Community Church (A), New Horizon United Methodist Church (B), Jesus Is Lord Fellowship Church (C), Epiphany Lutheran Church (D), Saint Michaels in the Hills Episcopal Church (E), Grace Baptist Church (F), Bancroft Mennonite Church (G), Asbury United Methodist Church (H), Dorr Street Church of God (I). Display/hide their locations on the map
3,348 married couples with children.
3,045 single-parent households (719 men, 2,326 women).
92.5% of residents of 43615 zip code speak English at home.
1.3% of residents speak Spanish at home (90% very well, 3% well, 6% not well).
1.5% of residents speak other Indo-European language at home (72% very well, 28% well).
2.0% of residents speak Asian or Pacific Island language at home (58% very well, 22% well, 19% not well, 1% not at all).
2.7% of residents speak other language at home (81% very well, 13% well, 5% not well).
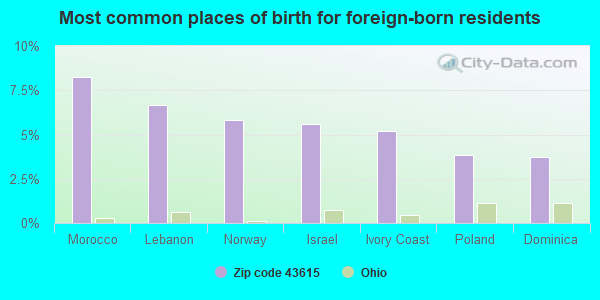
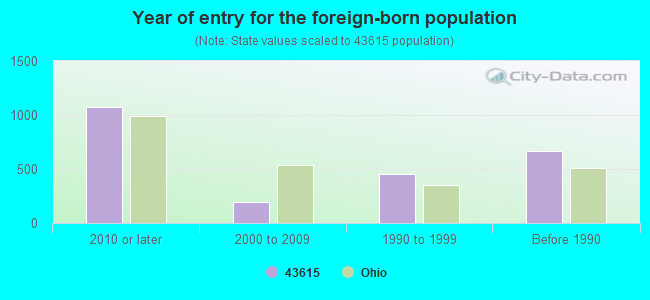
Foreign born population: 2,142 (5.4%) (58.7% of them are naturalized citizens)
Facilities with environmental interests located in this zip code:
BATTERY RECYCLERS OF DETROIT * (5715 ANGOLA ROAD in TOLEDO, OH)
SUPERFUND (Superfund database) (Integrated Compliance Information System) - ICIS-05-1997-0161, FORMAL ENFORCEMENT ACTION, ICIS-05-2000-0545, STATE MASTER (Ohio general info) - RCRA-OHD980613566, HAZARDOUS WASTE PROGRAM HAZARDOUS WASTE BIENNIAL REPORTER (Resource Conservation and Recovery Act (tracking hazardous waste)) (Resource Conservation and Recovery Act (tracking hazardous waste)) Business SIC classification: PRIMARY SMELTING AND REFINING OF NONFERROUS METALS, EXCEPT COPPER AND ALUMINUM; PRIMARY BATTERIES, DRY AND WET Alternative names: LEAD BATTERY RECYCLERS
CHEMCENTRAL TOLEDO CORP (4051 SOUTH AVENUE in TOLEDO, OH)
AIR MINOR (AIRS/AFS) CRITERIA AND HAZARDOUS AIR POLLUTANT INVENTORY (Inventory of air pollution sources) STATE MASTER (Ohio general info) - RCRA-OHD018384164, HAZARDOUS WASTE PROGRAM, AIR MAJOR, EPCRA, TRIS-43615CHMCN4051S, TRI REPORTER HAZARDOUS WASTE BIENNIAL REPORTER (Resource Conservation and Recovery Act (tracking hazardous waste)) Small Quantity Generators, between 100 kg and 1000 kg of hazardous waste/month (Resource Conservation and Recovery Act (tracking hazardous waste)) TRI REPORTER (Tracking of toxic chemicals releasing facilities) Business SIC classification: CHEMICALS AND ALLIED PRODUCTS; NONCLASSIFIABLE ESTABLISHMENTS Organizations: CHEMCENTRAL/TOLEDO (CONTACT/OPERATOR)
, CHEMCENTRAL CORPORATION (CONTACT/OWNER)
Alternative names: CHEMCENTRAL CORP TOLEDO
CHARLES F MANN PAINTING CO (3901 SOUTH STREET in TOLEDO, OH)
STATE MASTER (Ohio general info) - RCRA-OHR000103275, HAZARDOUS WASTE PROGRAM HAZARDOUS WASTE BIENNIAL REPORTER (Resource Conservation and Recovery Act (tracking hazardous waste)) Large Quantity Generators, more that 1000 kg of hazardous waste/month (Resource Conservation and Recovery Act (tracking hazardous waste)) - notification Organizations: CHAS. F. MANN PAINTING CO (CONTACT/OPERATOR)
Alternative names: CHAS F MANN PAINTING CO
7 ELEVEN (2201 N REYNOLDS in TOLEDO, OH)
STATE MASTER (Ohio general info) - RCRA-OHD987009537, HAZARDOUS WASTE PROGRAM, AIR MAJOR, -48-5541-979-2, EPCRA Small Quantity Generators, between 100 kg and 1000 kg of hazardous waste/month (Resource Conservation and Recovery Act (tracking hazardous waste)) - notification Organizations: SOUTHLAND CORPORATION (CONTACT/OWNER)
Alternative names: 7 ELEVEN 26370
A B DICK CO (5950 AIRPORT HWY in TOLEDO, OH)
STATE MASTER (Ohio general info) - RCRA-OHD987049582, HAZARDOUS WASTE PROGRAM Conditionally Exempt Small Quantity Generators, less than 100 kg/month of hazardous waste (Resource Conservation and Recovery Act (tracking hazardous waste)) - notification
ABE S QUICK SHOPPE (5409 DORR STREET in TOLEDO, OH)
SUPERFUND (Superfund database) STATE MASTER (Ohio general info) - AIR MAJOR Small Quantity Generators, between 100 kg and 1000 kg of hazardous waste/month (Resource Conservation and Recovery Act (tracking hazardous waste)) - notification Organizations: MANIRA SALLOCK (CONTACT/OWNER)
Alternative names: ABE'S QUICK SHOPPE, NABIL'S QUICK STOP
AMOCO SERVICE CTR INC (1025 S REYNOLDS RD in TOLEDO, OH)
STATE MASTER (Ohio general info) - RCRA-OHD987021144, HAZARDOUS WASTE PROGRAM Small Quantity Generators, between 100 kg and 1000 kg of hazardous waste/month (Resource Conservation and Recovery Act (tracking hazardous waste)) - notification Organizations: JACKSON CECIL (CONTACT/OWNER)
AMERICAN INTERIORS INC (302 S BRYNE in TOLEDO, OH)
STATE MASTER (Ohio general info) - AIR MAJOR Conditionally Exempt Small Quantity Generators, less than 100 kg/month of hazardous waste (Resource Conservation and Recovery Act (tracking hazardous waste))
ADARIS TESTING LABORATORY (4756 W BANCROFT in TOLEDO, OH)
Conditionally Exempt Small Quantity Generators, less than 100 kg/month of hazardous waste (Resource Conservation and Recovery Act (tracking hazardous waste))
BALLAS BUICK GEORGE (5715 W CENTRAL in TOLEDO, OH)
Small Quantity Generators, between 100 kg and 1000 kg of hazardous waste/month (Resource Conservation and Recovery Act (tracking hazardous waste)) - notification Organizations: BALLAS GEORGE P (CONTACT/OWNER)
CENTRAL COLLISION (6048 W CENTRAL AVE in TOLEDO, OH)
Small Quantity Generators, between 100 kg and 1000 kg of hazardous waste/month (Resource Conservation and Recovery Act (tracking hazardous waste)) - notification Organizations: T AND M PARTNERSHIP (CONTACT/OWNER)
Housing units lacking complete plumbing facilities: 1.1% Housing units lacking complete kitchen facilities: 1.2%
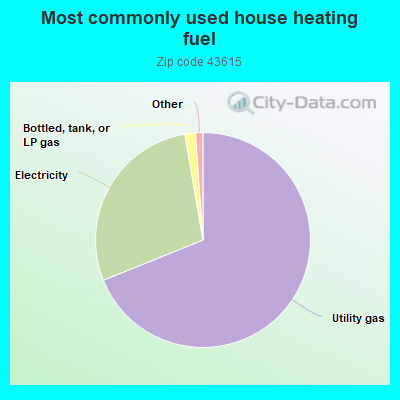
68.9%Utility gas
28.4%Electricity
1.6%Bottled, tank, or LP gas
Population in 1990: 38,173. Population change in the 1990s: +1,203 (+3.2%).
Place of birth for U.S.-born residents:
This state: 28,363
Northeast: 760
Midwest: 4,282
South: 2,978
West: 530
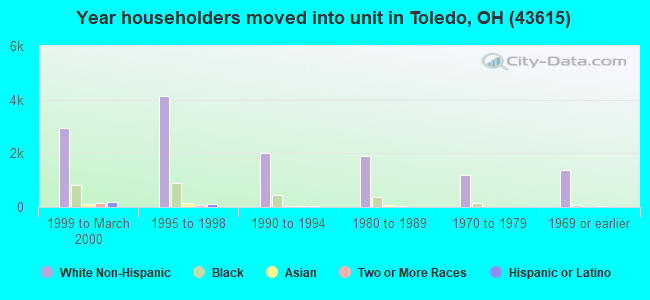
53% of the 43615 zip code residents lived in the same house 5 years ago. Out of people who lived in different houses, 71% lived in this county. Out of people who lived in different counties, 50% lived in Ohio.
89% of the 43615 zip code residents lived in the same house 1 year ago. Out of people who lived in different houses, 64% moved from this county. Out of people who lived in different houses, 14% moved from different county within same state. Out of people who lived in different houses, 15% moved from different state. Out of people who lived in different houses, 4% moved from abroad.
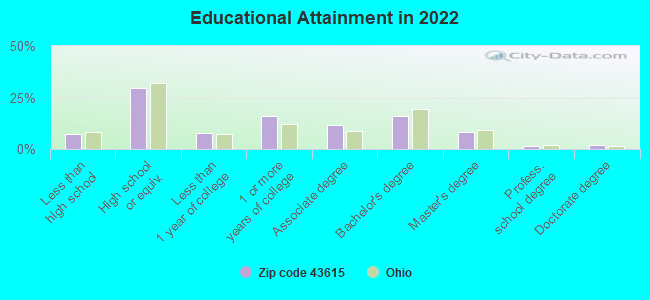
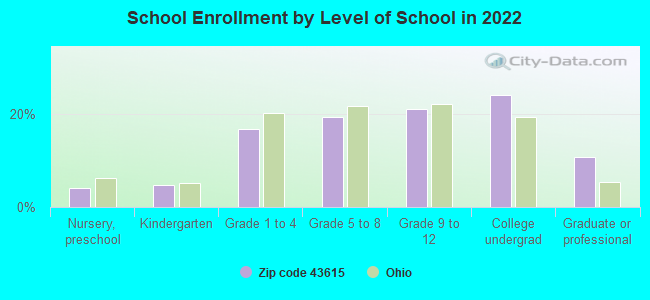
Private vs. public school enrollment:
Students in private schools in grades 1 to 8 (elementary and middle school): 633
Here:
21.9%
Ohio:
16.0%
Students in private schools in grades 9 to 12 (high school): 158
Here:
9.4%
Ohio:
13.1%
Students in private undergraduate colleges: 253
Here:
13.2%
Ohio:
22.3%
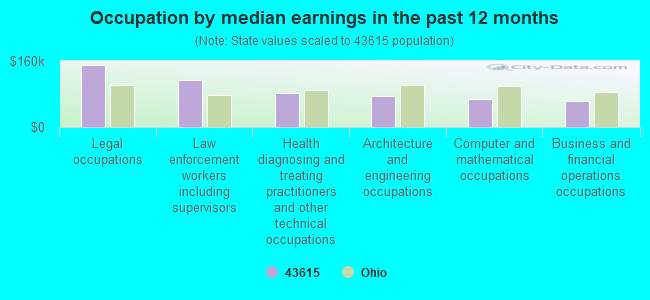
Occupation by median earnings in the past 12 months ($)
150,428Legal occupations
114,906Law enforcement workers including supervisors
82,423Health diagnosing and treating practitioners and other technical occupations
75,124Architecture and engineering occupations
68,595Computer and mathematical occupations
62,250Business and financial operations occupations
Companies with federal contracts located in this zip code (TOLEDO, OH):
MIDWEST ENVIRONMENTAL CONTROL (4708 ANGOLA RD; small business) : $11,474,216 in 73 contractsfrom 1999 to 2004
Contracts for Maintenance, Repair or Alteration of Real Property -- Restoration of real property, Construction of Structures and Facilities -- Restoration of real property, Maintenance, Repair or Alteration of Real Property -- Miscellaneous Buildings, Maintenance, Repair or Alteration of Real Property -- Testing and Measurement Buildings, and moreby Army, National Park Service, Air Force Signed by year:2000: $3,043,528; 2001: $3,157,900; 2002: $1,958,971; 2003: $3,130,280; 2004: $6,410; 2005: $0; 2006: $0.
Biggest contracts:
$858,278 with Army for Maintenance, Repair or Alteration of Real Property -- Restoration of real property. Taking place in CA. Signed on 2003-05-30. Completion date: 2003-12-31.
$721,356, same as above.Signed on 2002-07-02. Completion date: 2002-07-03.
$575,100 with Army for Construction of Structures and Facilities -- Restoration of real property. Taking place in CA. Signed on 2001-06-25. Completion date: 2001-07-09.
$496,665 with Army for Maintenance, Repair or Alteration of Real Property -- Restoration of real property. Taking place in CA. Signed on 2003-03-20. Completion date: 2003-12-31.
KWIK-LOC CORP (7340 DORR ST; small business) : $126,170 in 7 contractsfrom 2002 to 2004
Contracts for Trailers, Miscellaneous Materials Handling Equipment, Miscellaneous Vehicular Components by Army, Navy, U.S. Army Corps of Engineers - civil program financing only Signed by year:2000: $0; 2001: $0; 2002: $47,400; 2003: $0; 2004: $78,770; 2005: $0; 2006: $0.
Biggest contracts:
$51,000 with Army for Trailers. Signed on 2004-09-30. Completion date: 2004-10-28.
$23,770 with Navy for Miscellaneous Materials Handling Equipment. Signed on 2004-03-30. Completion date: 2004-05-03.
$22,800 with U.S. Army Corps of Engineers - civil program financing only for Miscellaneous Vehicular Components. Signed on 2002-07-15. Completion date: 2002-08-23.
$22,800 with Army for Miscellaneous Vehicular Components. Signed on 2002-09-28. Completion date: 2002-10-28.
IMAGING SYSTEMS TECHNOLOGY INC (4750 W BANCROFT ST; small business) : $40,000 in 2 contractsfrom 2001 to 2005
$30,000 with Air Force for Other Administrative Support Services. Signed on 2001-06-21. Completion date: 2001-06-19.
$10,000 with Air Force for Defense Electronics and Communication Equipment -- Applied Research and Exploratory Development (R&D). Signed on 2005-04-21. Completion date: 2005-06-30.
MIDWEST LASER SALES & SERVICE (2525 N REYNOLDS RD; small business)
$34,029 with Army for Electrical and Ultrasonic Erosion Machines. Taking place in IN. Signed on 2005-03-13. Completion date: 2005-04-15.
AAA STANDARD SERVICES INC (4117 SOUTH AVE; small business)
$7,500 with Army for Other Housekeeping Services. Signed on 2005-03-09. Completion date: 2005-05-30.
MANKOWSKI SERVICES (2354 WILFORD RD; small business) : -$1,300 in 3 contractsfrom 2002 to 2003
$0 with U.S. Army Corps of Engineers - civil program financing only for Custodial Janitorial Services. Signed on 2002-10-29. Completion date: 2004-01-30.
-$400, same as above.Signed on 2003-06-11. Completion date: 2004-01-30.
-$900, same as above.Signed on 2002-10-29. Completion date: 2004-01-30.
Top industries in this zip code by the number of employees in 2005:
Health Care and Social Assistance: Offices of Physicians (except Mental Health Specialists) (100-249: 1, 50-99: 2, 20-49: 4, 10-19: 6, 5-9: 6, 1-4: 11)
2002 - 2018 National Fire Incident Reporting System (NFIRS) incidents
Based on the data from the years 2002 - 2018 the average number of fires per year is 126. The highest number of fire incidents - 168 took place in 2009, and the least - 37 in 2002. The data has a rising trend.
When looking into fire subcategories, the most reports belonged to: Structure Fires (39.2%), and Outside Fires (31.7%).
Fire incident types reported to NFIRS in Zip Code 43615


 Nearest zip codes: 43617, 43623, 43614, 43606, 43607, 43537.


 Based on the data from the years 2002 - 2018 the average number of fires per year is 126. The highest number of fire incidents - 168 took place in 2009, and the least - 37 in 2002. The data has a rising trend.
 When looking into fire subcategories, the most reports belonged to: Structure Fires (39.2%), and Outside Fires (31.7%).