Estimated zip code population in 2022: 24,497 Zip code population in 2010: 26,429 Zip code population in 2000: 28,417
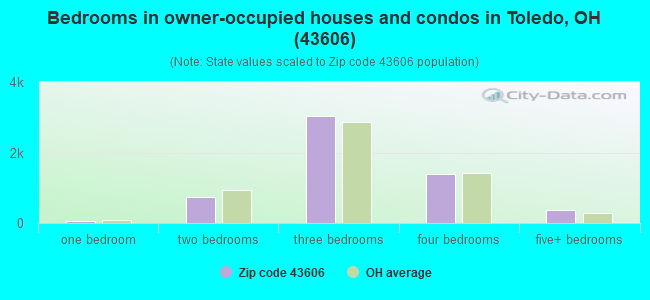
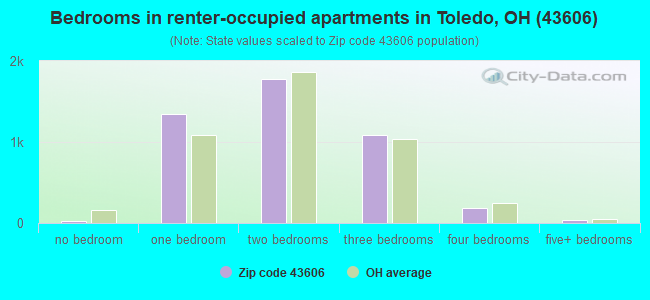
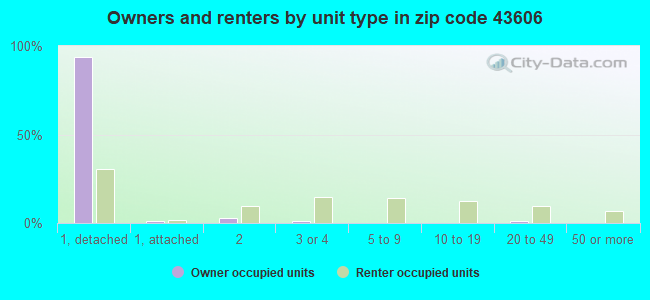
Houses and condos: 11,624 Renter-occupied apartments: 4,441
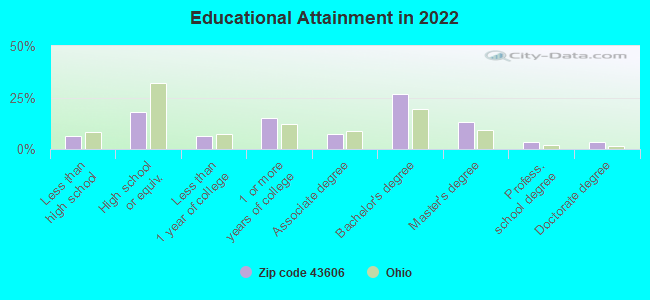
% of renters here:
44%
State:
33%
March 2022 cost of living index in zip code 43606: 92.6 (less than average, U.S. average is 100)
Land area: 6.5 sq. mi. Water area: 0.0 sq. mi.
Population density: 3,756 people per square mile
(average).
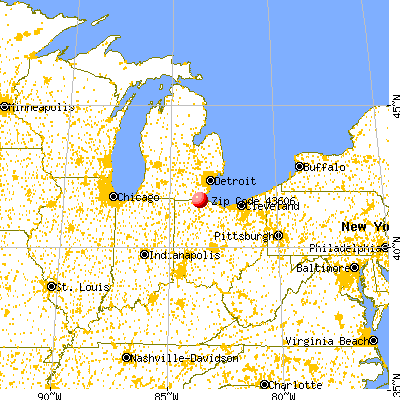
OSM Map
General Map
Google Map
MSN Map
OSM Map
General Map
Google Map
MSN Map
OSM Map
General Map
Google Map
MSN Map
OSM Map
General Map
Google Map
MSN Map
Please wait while loading the map...
Real estate property taxes paid for housing units in 2022:
This zip code:
1.7% ($2,736)
Ohio:
1.3% ($2,639)
Median real estate property taxes paid for housing units with mortgages in 2022: $2,783 (1.6%) Median real estate property taxes paid for housing units with no mortgage in 2022: $2,659 (1.9%)
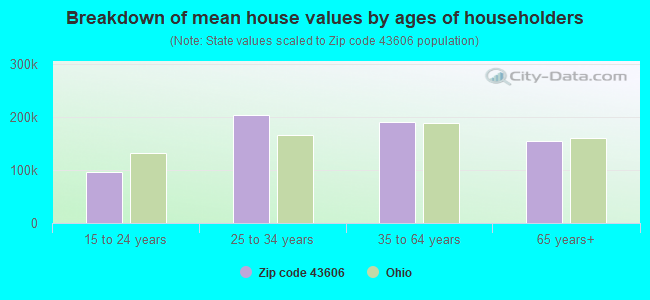
Estimated median house/condo value in 2022: $165,128
43606:
$165,128
Ohio:
$204,100
According to our research of Ohio and other state lists, there were 33 registered sex offenders living in 43606 zip code as of April 26, 2024. The ratio of all residents to sex offenders in zip code 43606 is 779 to 1. The ratio of registered sex offenders to all residents in this zip code is lower than the state average.
Median resident age:
This zip code:
33.9 years
Ohio median age:
39.9 years
Average household size:
This zip code:
2.1 people
Ohio:
2.4 people
Averages for the 2020 tax year for zip code 43606, filed in 2021:
Average Adjusted Gross Income (AGI) in 2020: $66,473 (Individual Income Tax Returns)
Here:
$66,473
State:
$67,288
Salary/wage: $51,866 (reported on 81.9% of returns)
Here:
$51,866
State:
$55,628
(% of AGI for various income ranges: 1156.7% for AGIs below $25k, 3564.8% for AGIs $25k-50k, 6521.4% for AGIs $50k-75k, 9839.3% for AGIs $75k-100k, 18569.1% for AGIs $100k-200k, 79336.9% for AGIs over 200k)
Taxable interest for individuals: $1,367 (reported on 24.0% of returns)
This zip code:
$1,367
Ohio:
$1,518
(% of AGI for various income ranges: 9.1% for AGIs below $25k, 14.4% for AGIs $25k-50k, 30.8% for AGIs $50k-75k, 62.7% for AGIs $75k-100k, 118.4% for AGIs $100k-200k, 1173.1% for AGIs over 200k)
Ordinary dividends: $7,578 (reported on 19.2% of returns)
Here:
$7,578
State:
$7,167
(% of AGI for various income ranges: 23.2% for AGIs below $25k, 34.0% for AGIs $25k-50k, 89.3% for AGIs $50k-75k, 248.7% for AGIs $75k-100k, 537.0% for AGIs $100k-200k, 6566.9% for AGIs over 200k)
Net capital gain/loss in AGI: +$20,845 (reported on 17.4% of returns)
Here:
+$20,845
State:
+$18,919
(% of AGI for various income ranges: 7.3% for AGIs below $25k, 24.5% for AGIs $25k-50k, 66.8% for AGIs $50k-75k, 149.8% for AGIs $75k-100k, 600.2% for AGIs $100k-200k, 25567.7% for AGIs over 200k)
Profit/loss from business: +$15,301 (reported on 14.7% of returns)
Here:
+$15,301
State:
+$13,744
(% of AGI for various income ranges: 40.7% for AGIs below $25k, 80.0% for AGIs $25k-50k, 186.4% for AGIs $50k-75k, 243.8% for AGIs $75k-100k, 904.4% for AGIs $100k-200k, 9480.8% for AGIs over 200k)
Taxable individual retirement arrangement distribution: $18,815 (reported on 8.8% of returns)
43606:
$18,815
Ohio:
$18,876
(% of AGI for various income ranges: 42.1% for AGIs below $25k, 90.7% for AGIs $25k-50k, 161.4% for AGIs $50k-75k, 557.6% for AGIs $75k-100k, 874.5% for AGIs $100k-200k, 3360.8% for AGIs over 200k)
Self-employed (Keogh) retirement plans: $25,075 (reported on 0.7% of returns)
43606:
$25,075
Ohio:
$24,898
(% of AGI for various income ranges: 81.4% for AGIs $100k-200k, 1142.3% for AGIs over 200k)
Total itemized deductions: $32,195 (reported on 5.9% of returns)
Here:
$32,195
State:
$33,869
(% of AGI for various income ranges: 31.0% for AGIs below $25k, 74.1% for AGIs $25k-50k, 199.5% for AGIs $50k-75k, 476.5% for AGIs $75k-100k, 791.9% for AGIs $100k-200k, 6277.7% for AGIs over 200k)
Charity contributions: $14,229 (reported on 4.7% of returns)
Here:
$14,229
State:
$14,577
(% of AGI for various income ranges: 11.0% for AGIs $25k-50k, 35.6% for AGIs $50k-75k, 103.6% for AGIs $75k-100k, 229.2% for AGIs $100k-200k, 3525.4% for AGIs over 200k)
Taxes paid: $7,448 (reported on 5.9% of returns)
43606:
$7,448
State:
$7,681
(% of AGI for various income ranges: 2.1% for AGIs below $25k, 12.2% for AGIs $25k-50k, 50.5% for AGIs $50k-75k, 146.2% for AGIs $75k-100k, 240.5% for AGIs $100k-200k, 1180.8% for AGIs over 200k)
Earned income credit: $2,331 (reported on 17.9% of returns)
Here:
$2,331
State:
$2,304
(% of AGI for various income ranges: 104.5% for AGIs below $25k, 64.8% for AGIs $25k-50k)
Percentage of individuals using paid preparers for their 2020 taxes: 92.6%
Here:
93%
State:
94%
(% for various income ranges: 93.2% for AGIs below $25k, 92.7% for AGIs $25k-50k, 92.3% for AGIs $50k-75k, 90.0% for AGIs $75k-100k, 92.7% for AGIs $100k-200k, 93.3% for AGIs over 200k)
Averages for the 2012 tax year for zip code 43606, filed in 2013:
Average Adjusted Gross Income (AGI) in 2012: $54,949 (Individual Income Tax Returns)
Here:
$54,949
State:
$54,926
Salary/wage: $44,075 (reported on 82.5% of returns)
Here:
$44,075
State:
$45,869
(% of AGI for various income ranges: 73.1% for AGIs below $25k, 76.4% for AGIs $25k-50k, 73.1% for AGIs $50k-75k, 72.7% for AGIs $75k-100k, 71.2% for AGIs $100k-200k, 46.3% for AGIs over 200k)
Taxable interest for individuals: $1,359 (reported on 29.9% of returns)
This zip code:
$1,359
Ohio:
$1,297
(% of AGI for various income ranges: 1.0% for AGIs below $25k, 0.5% for AGIs $25k-50k, 0.8% for AGIs $50k-75k, 0.6% for AGIs $75k-100k, 0.8% for AGIs $100k-200k, 0.7% for AGIs over 200k)
Ordinary dividends: $6,177 (reported on 22.0% of returns)
Here:
$6,177
State:
$5,821
(% of AGI for various income ranges: 1.8% for AGIs below $25k, 1.3% for AGIs $25k-50k, 1.7% for AGIs $50k-75k, 2.2% for AGIs $75k-100k, 2.5% for AGIs $100k-200k, 4.0% for AGIs over 200k)
Net capital gain/loss in AGI: +$8,084 (reported on 17.1% of returns)
Here:
+$8,084
State:
+$11,232
(% of AGI for various income ranges: 0.2% for AGIs $25k-50k, 0.5% for AGIs $50k-75k, 0.9% for AGIs $75k-100k, 1.8% for AGIs $100k-200k, 7.3% for AGIs over 200k)
Profit/loss from business: +$16,246 (reported on 14.6% of returns)
Here:
+$16,246
State:
+$12,773
(% of AGI for various income ranges: 8.6% for AGIs below $25k, 2.6% for AGIs $25k-50k, 2.5% for AGIs $50k-75k, 2.5% for AGIs $75k-100k, 4.3% for AGIs $100k-200k, 5.6% for AGIs over 200k)
Taxable individual retirement arrangement distribution: $15,386 (reported on 11.0% of returns)
43606:
$15,386
Ohio:
$14,511
(% of AGI for various income ranges: 2.9% for AGIs below $25k, 2.6% for AGIs $25k-50k, 3.1% for AGIs $50k-75k, 3.7% for AGIs $75k-100k, 3.9% for AGIs $100k-200k, 2.3% for AGIs over 200k)
Self-employment retirement plans: $25,427 (reported on 1.0% of returns)
43606:
$25,427
Ohio:
$20,257
(% of AGI for various income ranges: 0.4% for AGIs $50k-75k, 0.6% for AGIs $100k-200k, 1.1% for AGIs over 200k)
Total itemized deductions: $22,353 (19% of AGI, reported on 32.2% of returns)
Here:
$22,353
State:
$21,278
Here:
19.5% of AGI
State:
18.8% of AGI
(% of AGI for various income ranges: 7.2% for AGIs below $25k, 9.0% for AGIs $25k-50k, 12.8% for AGIs $50k-75k, 14.5% for AGIs $75k-100k, 15.2% for AGIs $100k-200k, 15.3% for AGIs over 200k)
Charity contributions: $4,255 (reported on 26.9% of returns)
Here:
$4,255
State:
$3,943
(% of AGI for various income ranges: 0.7% for AGIs below $25k, 1.4% for AGIs $25k-50k, 2.0% for AGIs $50k-75k, 2.2% for AGIs $75k-100k, 2.4% for AGIs $100k-200k, 2.7% for AGIs over 200k)
Taxes paid: $11,044 (reported on 32.0% of returns)
43606:
$11,044
State:
$9,568
(% of AGI for various income ranges: 1.8% for AGIs below $25k, 2.8% for AGIs $25k-50k, 5.1% for AGIs $50k-75k, 6.3% for AGIs $75k-100k, 7.9% for AGIs $100k-200k, 9.7% for AGIs over 200k)
Earned income credit: $2,355 (reported on 20.7% of returns)
Here:
$2,355
State:
$2,285
(% of AGI for various income ranges: 7.8% for AGIs below $25k, 0.9% for AGIs $25k-50k)
Percentage of individuals using paid preparers for their 2012 taxes: 47.4%
Here:
47%
State:
51%
(% for various income ranges: 40.4% for AGIs below $25k, 45.5% for AGIs $25k-50k, 53.6% for AGIs $50k-75k, 56.8% for AGIs $75k-100k, 58.8% for AGIs $100k-200k, 78.1% for AGIs over 200k)
Averages for the 2004 tax year for zip code 43606, filed in 2005:
Average Adjusted Gross Income (AGI) in 2004: $47,664 (Individual Income Tax Returns)
Here:
$47,664
State:
$44,480
Salary/wage: $41,762 (reported on 83.1% of returns)
Here:
$41,762
State:
$39,198
(% of AGI for various income ranges: 119.2% for AGIs below $10k, 73.1% for AGIs $10k-25k, 77.9% for AGIs $25k-50k, 78.7% for AGIs $50k-75k, 79.2% for AGIs $75k-100k, 64.0% for AGIs over 100k)
Taxable interest for individuals: $1,844 (reported on 43.7% of returns)
This zip code:
$1,844
Ohio:
$1,532
(% of AGI for various income ranges: 7.7% for AGIs below $10k, 2.8% for AGIs $10k-25k, 1.7% for AGIs $25k-50k, 1.5% for AGIs $50k-75k, 1.1% for AGIs $75k-100k, 1.5% for AGIs over 100k)
Taxable dividends: $4,761 (reported on 28.3% of returns)
Here:
$4,761
State:
$3,496
(% of AGI for various income ranges: 6.2% for AGIs below $10k, 2.4% for AGIs $10k-25k, 1.7% for AGIs $25k-50k, 1.9% for AGIs $50k-75k, 2.2% for AGIs $75k-100k, 3.9% for AGIs over 100k)
Net capital gain/loss: +$5,768 (reported on 23.0% of returns)
Here:
+$5,768
State:
+$8,582
(% of AGI for various income ranges: -0.4% for AGIs below $10k, 0.4% for AGIs $10k-25k, 0.5% for AGIs $25k-50k, 0.6% for AGIs $50k-75k, 1.0% for AGIs $75k-100k, 6.0% for AGIs over 100k)
Profit/loss from business: +$17,014 (reported on 12.7% of returns)
Here:
+$17,014
State:
+$10,813
(% of AGI for various income ranges: 4.9% for AGIs below $10k, 3.6% for AGIs $10k-25k, 2.6% for AGIs $25k-50k, 2.6% for AGIs $50k-75k, 4.0% for AGIs $75k-100k, 6.5% for AGIs over 100k)
IRA payment deduction: $2,851 (reported on 2.1% of returns)
43606:
$2,851
Ohio:
$2,794
(% of AGI for various income ranges: 0.3% for AGIs below $10k, 0.3% for AGIs $10k-25k, 0.2% for AGIs $25k-50k, 0.1% for AGIs $50k-75k, 0.1% for AGIs $75k-100k, 0.0% for AGIs over 100k)
Self-employed pension: $17,472 (reported on 1.6% of returns)
Here:
$17,472
Ohio:
$13,981
(% of AGI for various income ranges: 0.1% for AGIs $25k-50k, 0.2% for AGIs $50k-75k, 0.3% for AGIs $75k-100k, 1.2% for AGIs over 100k)
Total itemized deductions: $18,351 (21% of AGI, reported on 39.9% of returns)
Here:
$18,351
State:
$17,503
Here:
20.9% of AGI
State:
20.8% of AGI
(% of AGI for various income ranges: 16.6% for AGIs below $10k, 9.3% for AGIs $10k-25k, 12.1% for AGIs $25k-50k, 16.7% for AGIs $50k-75k, 18.7% for AGIs $75k-100k, 16.2% for AGIs over 100k)
Charity contributions deductions: $3,554 (4% of AGI, reported on 34.3% of returns)
Here:
$3,554
State:
$3,087
Here:
3.7% of AGI
State:
3.4% of AGI
(% of AGI for various income ranges: 0.6% for AGIs below $10k, 1.2% for AGIs $10k-25k, 1.8% for AGIs $25k-50k, 2.5% for AGIs $50k-75k, 2.7% for AGIs $75k-100k, 3.2% for AGIs over 100k)
Total tax: $8,533 (reported on 73.9% of returns)
43606:
$8,533
State:
$6,781
(% of AGI for various income ranges: 2.2% for AGIs below $10k, 4.0% for AGIs $10k-25k, 7.9% for AGIs $25k-50k, 10.3% for AGIs $50k-75k, 11.1% for AGIs $75k-100k, 19.9% for AGIs over 100k)
Earned income credit: $1,802 (reported on 15.8% of returns)
Here:
$1,802
State:
$1,696
Percentage of individuals using paid preparers for their 2004 taxes: 53.6%
Here:
54%
State:
55%
(% for various income ranges: 45.4% for AGIs below $10k, 53.0% for AGIs $10k-25k, 54.6% for AGIs $25k-50k, 58.6% for AGIs $50k-75k, 58.1% for AGIs $75k-100k, 61.5% for AGIs over 100k)
Likely homosexual households (counted as self-reported same-sex unmarried-partner households)
Lesbian couples: 0.4% of all households
Gay men: 0.1% of all households
Household received Food Stamps/SNAP in the past 12 months: 1,345 Household did not receive Food Stamps/SNAP in the past 12 months: 8,719
Women who had a birth in the past 12 months: 258 (177 now married, 81 unmarried) Women who did not have a birth in the past 12 months: 6,573 (1,752 now married, 4,825 unmarried)
Housing units in zip code 43606 with a mortgage: 3,525 (365 second mortgage, 3 home equity loan, 302 both second mortgage and home equity loan) Houses without a mortgage: 126
Median monthly owner costs for units with a mortgage: $1,347 Median monthly owner costs for units without a mortgage: $583
Residents with income below the poverty level in 2022:
This zip code:
16.7%
Whole state:
13.4%
Residents with income below 50% of the poverty level in 2022:
This zip code:
7.8%
Whole state:
7.0%
Median number of rooms in houses and condos:
Here:
7.1
State:
6.7
Median number of rooms in apartments:
Here:
4.5
State:
4.4
Notable locations in this zip code not listed on our city pages
Notable locations in zip code 43606: Glass Bowl Stadium (A), Brookside Ambulance Service Rumpf Ambulance (B), Lucas County Emergency Medical Services Lifesquad 5 (C), Toledo Fire and Rescue Department Station 25 (D), Michael Lichtenstein Memorial Library (E), University Hall (F), Tucker Hall (G), Stranahan Hall (H), Snyder Memorial Building (I), Scott Hall (J), Savage Hall (K), Ritter Astrophysical Research Center (L), Peterson House (M), Parks Tower (N), McMaster Hall (O), MacKinnon Hall (P), Libbey Hall (Q), Larimer Athletic Complex (R), Goddard House (S), Gillham Hall (T). Display/hide their locations on the map
Shopping Centers: Westgate Shopping Center (1), Cricket West Shopping Center (2), Kenwood Plaza Shopping Center (3), Franklin Park Plaza Shopping Center (4), Colonial Plaza Shopping Center (5), Executive Shoppes at Secor Shopping Center (6), Executive Marketplace Shopping Center (7), Dorr-Secor Shopping Center (8), Kenwood Shopping Center (9). Display/hide their locations on the map
Churches in zip code 43606 include: Covenant Presbyterian Church (A), Unity First Church (B), Saint George Antiochian Orthodox Cathedral (C), Reorganized Church of Jesus Christ of Latter Day Saints (D), North Cove Boulevard Church of God (E), New Covenant Church of the Living God (F), Church of the Living God (G), Temple B'nai Israel (H), Interfaith Center (I). Display/hide their locations on the map
Parks in zip code 43606 include: Beatty Park (1), Ottawa Park (2), Marvin Playground (3), Jermain Park (4), Centennial Mall (5). Display/hide their locations on the map
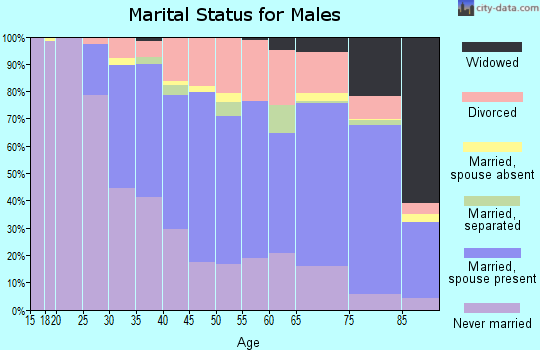
2,360 married couples with children.
1,887 single-parent households (537 men, 1,350 women).
90.1% of residents of 43606 zip code speak English at home.
1.8% of residents speak Spanish at home (76% very well, 9% well, 9% not well, 5% not at all).
3.5% of residents speak other Indo-European language at home (67% very well, 20% well, 13% not well).
1.9% of residents speak Asian or Pacific Island language at home (56% very well, 19% well, 22% not well, 2% not at all).
2.4% of residents speak other language at home (92% very well, 5% well, 3% not at all).
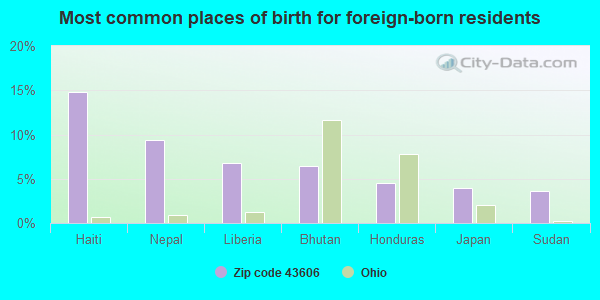
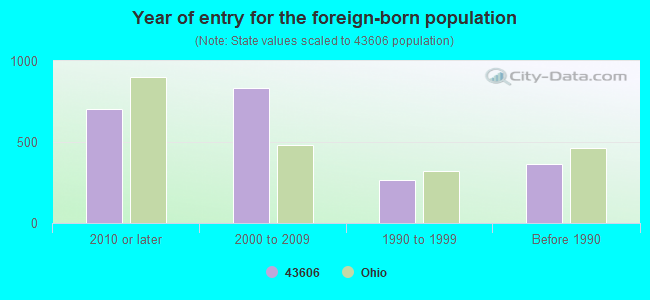
Foreign born population: 1,981 (8.1%) (58.4% of them are naturalized citizens)
Facilities with environmental interests located in this zip code:
ACME SPECIALTY MFG CO (2298 SMEAD AVE in TOLEDO, OH)
STATE MASTER (Ohio general info) - AIR MAJOR Small Quantity Generators, between 100 kg and 1000 kg of hazardous waste/month (Resource Conservation and Recovery Act (tracking hazardous waste)) - notification Organizations: CHANTILLY DEVELOPMENT CORP (CONTACT/OWNER)
BP OIL CO SITE 06833 (2305 COUNCIL AND DETROIT in TOLEDO, OH)
STATE MASTER (Ohio general info) - RCRA-OHD987020252, HAZARDOUS WASTE PROGRAM Conditionally Exempt Small Quantity Generators, less than 100 kg/month of hazardous waste (Resource Conservation and Recovery Act (tracking hazardous waste)) - notification Organizations: BP OIL COMPANY (CONTACT/OWNER)
CENTRAL COOP AMOCO (1853 CENTRAL AVE in TOLEDO, OH)
STATE MASTER (Ohio general info) - AIR MAJOR, -48-5541-943-10, EPCRA, RCRA-OHD987034121, HAZARDOUS WASTE PROGRAM Conditionally Exempt Small Quantity Generators, less than 100 kg/month of hazardous waste (Resource Conservation and Recovery Act (tracking hazardous waste)) - notification Organizations: THE LYDEN CO (CONTACT/OWNER)
, LYDEN COMPANY (CONTACT/OWNER)
Alternative names: CENTRAL AMOCO
AUTISTIC CHOICE FOR EDUCATION (2436 BEXFORD PL in TOLEDO, OH)
(National Center for Education Statistics) - STATE ID-143321
BANCROFT LAUNDRY (1605 W BANCROFT in TOLEDO, OH)
(Resource Conservation and Recovery Act (tracking hazardous waste)) Organizations: DENTON CHARLES (CONTACT/OWNER)
BARON JERRY (3450 W CENTRAL AVE in TOLEDO, OH)
Small Quantity Generators, between 100 kg and 1000 kg of hazardous waste/month (Resource Conservation and Recovery Act (tracking hazardous waste)) - notification
BP AMOCO #06833 (2315 NORTH DETROIT AVENUE in TOLEDO, OH)
AIR MINOR (AIRS/AFS) Business SIC classification: GASOLINE SERVICE STATIONS
BEIRUT BAKERY (4040 MONROE STREET in TOLEDO, OH)
ENFORCEMENT/COMPLIANCE ACTIVITY (Integrated Compliance Information System) Business SIC classification: BREAD AND OTHER BAKERY PRODUCTS, EXCEPT COOKIES AND CRACKERS
Housing units lacking complete plumbing facilities: 4.2% Housing units lacking complete kitchen facilities: 3.3%
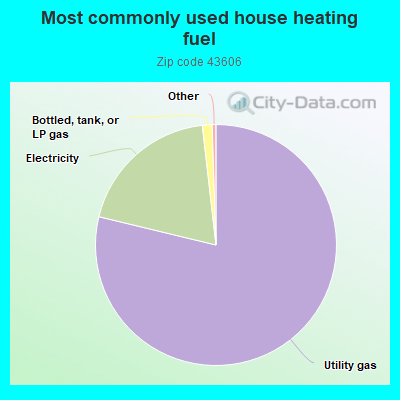
78.7%Utility gas
19.4%Electricity
1.3%Bottled, tank, or LP gas
Population in 1990: 29,111.
Place of birth for U.S.-born residents:
This state: 16,224
Northeast: 965
Midwest: 2,519
South: 2,089
West: 511
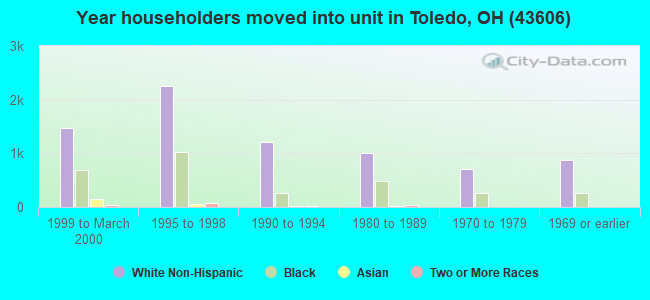
52% of the 43606 zip code residents lived in the same house 5 years ago. Out of people who lived in different houses, 64% lived in this county. Out of people who lived in different counties, 50% lived in Ohio.
89% of the 43606 zip code residents lived in the same house 1 year ago. Out of people who lived in different houses, 61% moved from this county. Out of people who lived in different houses, 18% moved from different county within same state. Out of people who lived in different houses, 16% moved from different state. Out of people who lived in different houses, 3% moved from abroad.
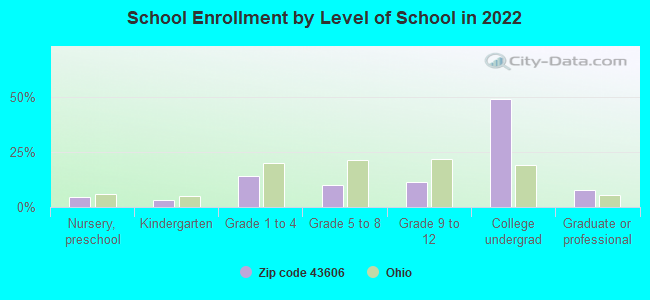
Private vs. public school enrollment:
Students in private schools in grades 1 to 8 (elementary and middle school): 372
Here:
19.0%
Ohio:
16.0%
Students in private schools in grades 9 to 12 (high school): 271
Here:
29.4%
Ohio:
13.1%
Students in private undergraduate colleges: 242
Here:
6.0%
Ohio:
22.3%
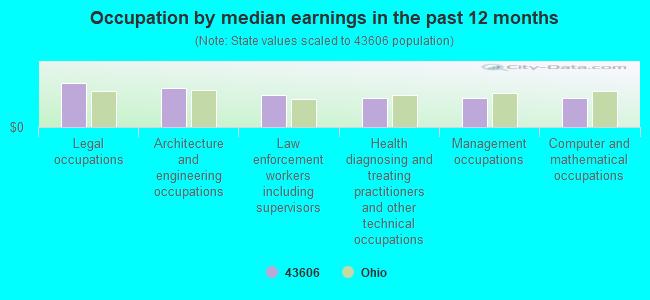
Occupation by median earnings in the past 12 months ($)
102,936Legal occupations
91,443Architecture and engineering occupations
75,463Law enforcement workers including supervisors
68,483Health diagnosing and treating practitioners and other technical occupations
67,904Management occupations
66,687Computer and mathematical occupations
Companies with federal contracts located in this zip code (TOLEDO, OH):
CHANTILLY DEVELOPMENT CORPORAT (3101 MONROE STREET; small business) : $846,555 in 32 contractsfrom 2001 to 2006
Contracts for Vehicular Furniture and Accessories, Studs, Trucks and Truck Tractors, Wheeled, Hazardous Material Spill Containment and Clean-up Equipment and Material by Defense Logistics Agency, Army Signed by year:2000: $0; 2001: $41,926; 2002: $120,630; 2003: $87,918; 2004: $271,324; 2005: $286,359; 2006: $38,398.
Biggest contracts:
$118,830 with Defense Logistics Agency for Vehicular Furniture and Accessories. Signed on 2004-03-08. Completion date: 2004-05-17.
$70,824, same as above.Signed on 2004-11-04. Completion date: 2005-01-04.
$66,000, same as above.Signed on 2002-05-29. Completion date: 2002-08-27.
$62,748, same as above.Signed on 2003-12-15. Completion date: 2004-02-13.
ELECTRONIC CONCEPTS ENGINEERIN (3788 HILLANDALE RD; small business)
$307,442 with Army for Other Defense -- Applied Research and Exploratory Development (R&D). Signed on 2000-01-12. Completion date: 2001-04-15.
NORTH STAR FOOD EQUIPMENT LLC (3472 BROOKSIDE RD; small business) : $95,869 in 2 contractsin 2004
$50,155 with Air Force for Hazardous Material Spill Containment and Clean-up Equipment and Material. Signed on 2004-11-17. Completion date: 2005-02-18.
$45,714 with Air Force for Miscellaneous Service and Trade Equipment. Signed on 2004-06-14. Completion date: 2004-07-14.
THE NATIONAL EXCHANGE CLUB FOU (3050 CENTRAL AVE; small business) : $66,000 in 3 contractsfrom 1999 to 2000
$33,000 with Army for Other Professional Services. Taking place in GA. Signed on 2000-11-01. Completion date: 2001-09-30.
$33,000 with Army for Other Administrative Support Services. Signed on 1999-11-19. Completion date: 2000-09-30.
$0, same as above.Signed on 1999-11-19. Completion date: 2000-09-30.
Top industries in this zip code by the number of employees in 2005:
Health Care and Social Assistance: General Medical and Surgical Hospitals (over 1000 employees: 1 establishment)
Health Care and Social Assistance: Offices of Physicians (except Mental Health Specialists) (100-249: 1, 50-99: 1, 20-49: 8, 10-19: 16, 5-9: 11, 1-4: 29)
2002 - 2018 National Fire Incident Reporting System (NFIRS) incidents
Based on the data from the years 2002 - 2018 the average number of fires per year is 121. The highest number of fire incidents - 181 took place in 2003, and the least - 45 in 2002. The data has a rising trend.
When looking into fire subcategories, the most reports belonged to: Structure Fires (44.3%), and Outside Fires (21.1%).
Fire incident types reported to NFIRS in Zip Code 43606


 Nearest zip codes: 43607, 43613, 43623, 43610, 43609, 43620.


 Based on the data from the years 2002 - 2018 the average number of fires per year is 121. The highest number of fire incidents - 181 took place in 2003, and the least - 45 in 2002. The data has a rising trend.
 When looking into fire subcategories, the most reports belonged to: Structure Fires (44.3%), and Outside Fires (21.1%).