Appling: Fire Incidents, Georgia (GA)
Where are fire incidents reported in Appling, GA
Something went wrong! Please refresh the page.
|
| |||||||||||||||||||||||||||||||||||||||||||||||||||||||||||||||||||||||||||||||||||||||||||||||||||||||||||||
2003 - 2018 National Fire Incident Reporting System (NFIRS) incidents
- Incident types reported to NFIRS in Appling, GA
- 63235.2%Rescue & EMS
- 55831.1%Fire
- 1739.6%Hazardous Condition
- 1689.4%Good Intent Call
- 1126.2%Service Call
- 1065.9%False Alarm
- 392.2%Severe Weather
- 50.3%Special Incident
- 30.2%Overpressure Rupture
- Fire incident types reported to NFIRS in Appling, GA
- 32758.6%Outside Fires
- 12322.0%Mobile Property/Vehicle Fires
- 9617.2%Structure Fires
- 122.2%Other
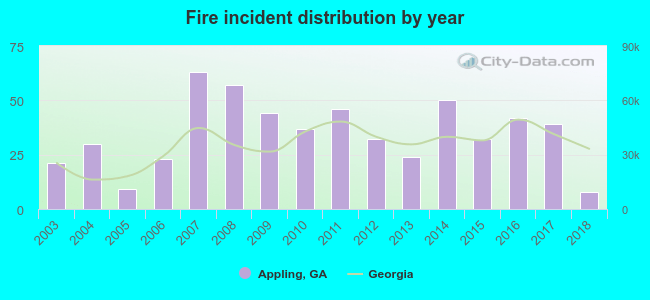 Based on the data from the years 2003 - 2018 the average number of fire incidents per year is 35. The highest number of reported fire incidents - 63 took place in 2007, and the least - 8 in 2018. The data has a decreasing trend.
The average number of yearly fire incidents per 10k residents in Appling, GA compared to nearest cities:
(Note: Based on data for the last 3 years, including only cities with population 5,000 and above)
| Appling: | 36.4 |
| Evans: | 11.3 |
| Grovetown: | 63.3 |
| Martinez: | 32.6 |
| Thomson: | 221.6 |
| Fort Gordon: | 1.3 |
| Augusta: | 58.5 |
| Waynesboro: | 184.2 |
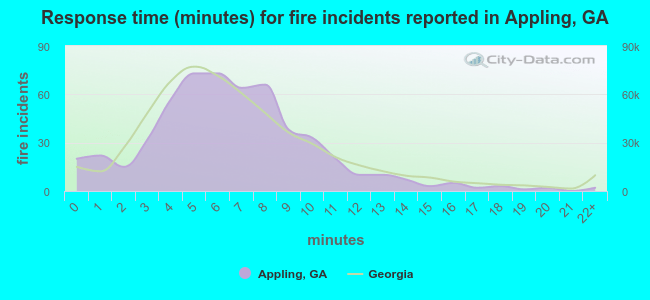 The median response time based on all reported fire incidents is 6 minutes. This is close to the state median value.
The median response time in Appling, GA compared to nearest cities:
(Note: Based on data for all years, including only cities with at least 500 fire incidents)
| Appling: | 6 minutes |
| Evans: | 5 minutes |
| Grovetown: | 5 minutes |
| Martinez: | 5 minutes |
| Thomson: | 6 minutes |
| Augusta: | 5 minutes |
| Hephzibah: | 6 minutes |
| Warrenton: | 12 minutes |
| Washington: | 7 minutes |
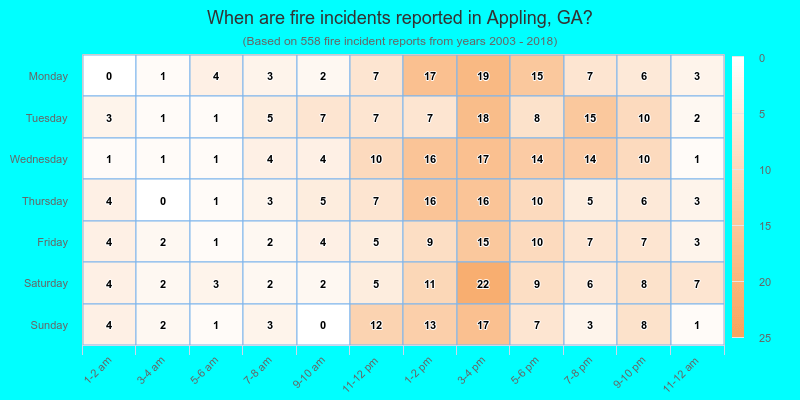
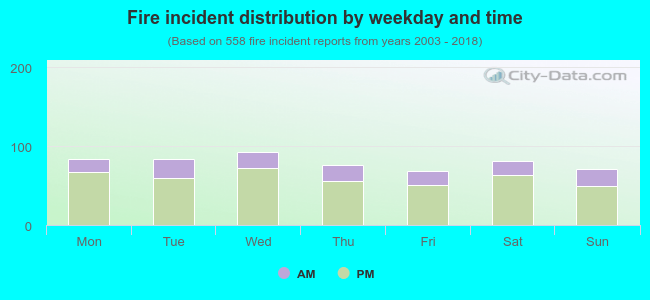 25.1% incidents where reported in the morning and 74.9% in the evening. The most fires (16.7%) took place on Wednesday, and the least (12.4%) on Friday.
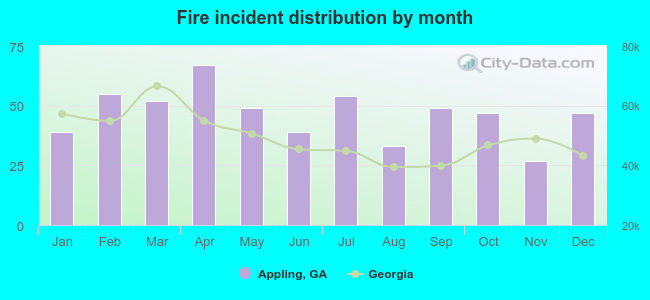 Based on the 558 reports from years 2003 - 2018 most fires (12.0%) took place during April, and the least (4.8%) in November.
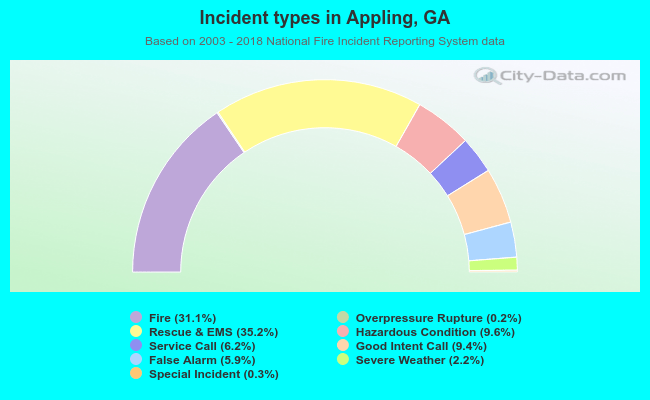 Out of all 1,796 cases reported during the years 2003 - 2018, the most belonged to the categories: Rescue & EMS (35.2%), Fire (31.1%), and Hazardous Condition (9.6%).
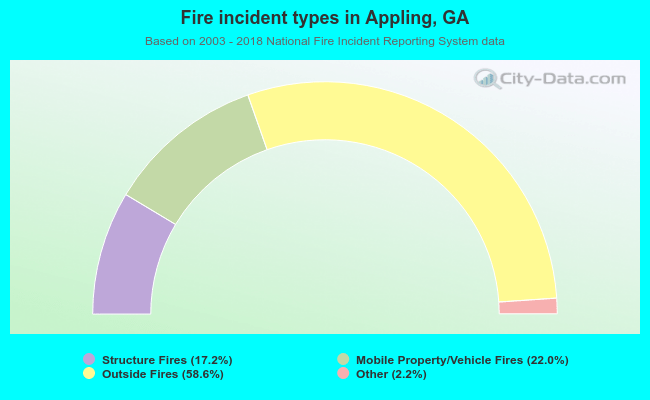 When looking into fire subcategories, the most incidents belonged to: Outside Fires (58.6%), and Mobile Property/Vehicle Fires (22.0%).