Atherton: Fire Incidents, California (CA)
Where are fire incidents reported in Atherton, CA
Something went wrong! Please refresh the page.
|
| |||||||||||||||||||||||||||||||||||||||||||||||||||||||||||||||||||||||||||||||||||||||||||||||||||||||||||||
2005 - 2018 National Fire Incident Reporting System (NFIRS) incidents
- Incident types reported to NFIRS in Atherton, CA
- 1,06542.3%Rescue & EMS
- 44717.8%False Alarm
- 41616.5%Service Call
- 27611.0%Good Intent Call
- 1887.5%Hazardous Condition
- 1194.7%Fire
- 30.1%Special Incident
- Fire incident types reported to NFIRS in Atherton, CA
- 5243.7%Structure Fires
- 4638.7%Outside Fires
- 1411.8%Mobile Property/Vehicle Fires
- 75.9%Other
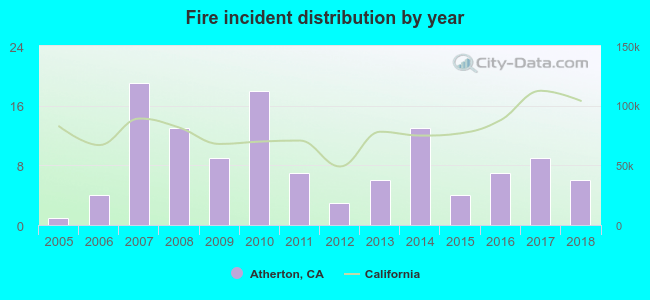 According to the data from the years 2005 - 2018 the average number of fires per year is 9. The highest number of reported fire incidents - 19 took place in 2007, and the least - 1 in 2005. The data has a rising trend.
The average number of yearly fire incidents per 10k residents in Atherton, CA compared to nearest cities:
(Note: Based on data for the last 3 years, including only cities with population 5,000 and above)
| Atherton: | 10.3 |
| Menlo Park: | 21.6 |
| Redwood City: | 23.3 |
| Stanford: | 21.7 |
| East Palo Alto: | 20.3 |
| Palo Alto: | 18.5 |
| Woodside: | 83.2 |
| San Carlos: | 15.2 |
| Belmont: | 17.4 |
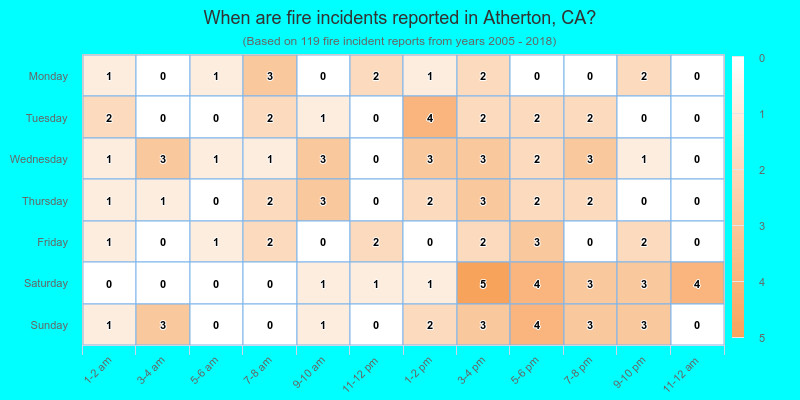
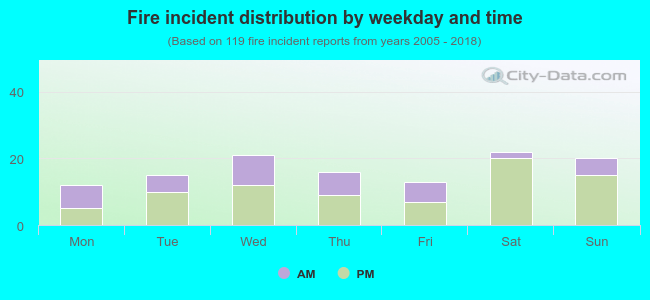 34.5% incidents where reported in the morning and 65.5% in the evening. The most fires (18.5%) took place on Saturday, and the least (10.1%) on Monday.
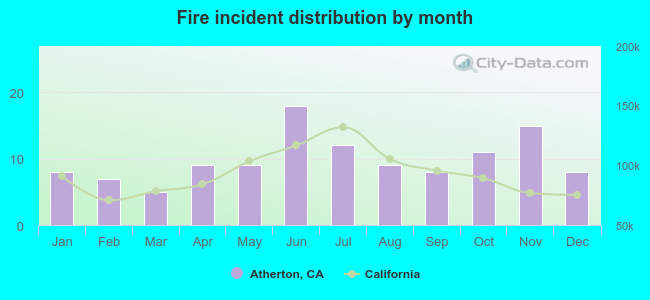 Based on the 119 fire incidents from years 2005 - 2018 most fires (15.1%) took place during June, and the least (4.2%) in March.
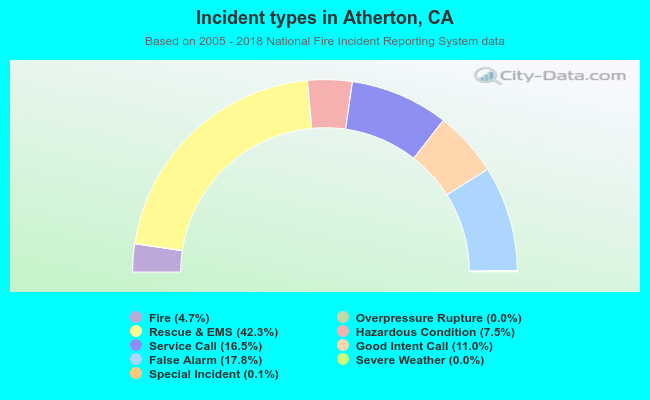 Out of all 2,516 cases reported during the years 2005 - 2018, the most belonged to the categories: Rescue & EMS (42.3%), False Alarm (17.8%), and Service Call (16.5%).
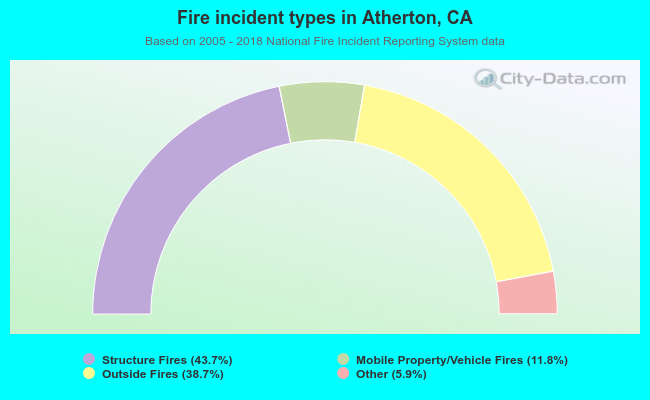 When looking into fire subcategories, the most reports belonged to: Structure Fires (43.7%), and Outside Fires (38.7%).