Menlo Park: Fire Incidents, California (CA)
Where are fire incidents reported in Menlo Park, CA
Something went wrong! Please refresh the page.
|
| |||||||||||||||||||||||||||||||||||||||||||||||||||||||||||||||||||||||||||||||||||||||||||||||||||||||||||||
| Other | 25 | |||||||||||||||||||||||||||||||||||||||||||||||||||||||||||||||||||||||||||||||||||||||||||||||||||||||||||||
2005 - 2018 National Fire Incident Reporting System (NFIRS) incidents
- Incident types reported to NFIRS in Menlo Park, CA
- 10,60459.4%Rescue & EMS
- 2,08311.7%Service Call
- 1,7499.8%False Alarm
- 1,5018.4%Good Intent Call
- 1,1076.2%Hazardous Condition
- 7674.3%Fire
- 260.1%Special Incident
- Fire incident types reported to NFIRS in Menlo Park, CA
- 30139.2%Outside Fires
- 29037.8%Structure Fires
- 13417.5%Mobile Property/Vehicle Fires
- 425.5%Other
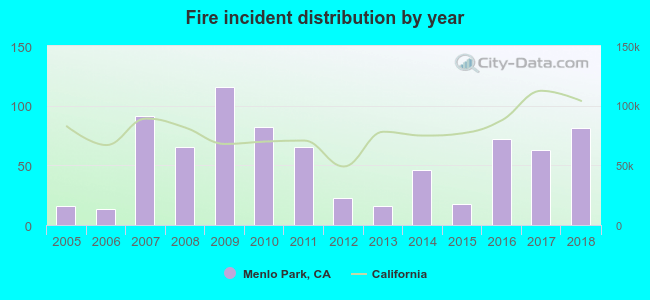 Based on the data from the years 2005 - 2018 the average number of fires per year is 55. The highest number of reported fires - 116 took place in 2009, and the least - 13 in 2006. The data has a rising trend.
The average number of yearly fire incidents per 10k residents in Menlo Park, CA compared to nearest cities:
(Note: Based on data for the last 3 years, including only cities with population 5,000 and above)
| Menlo Park: | 21.6 |
| Atherton: | 10.3 |
| Stanford: | 21.7 |
| East Palo Alto: | 20.3 |
| Palo Alto: | 18.5 |
| Redwood City: | 23.3 |
| Woodside: | 83.2 |
| San Carlos: | 15.2 |
| Los Altos Hills: | 22.2 |
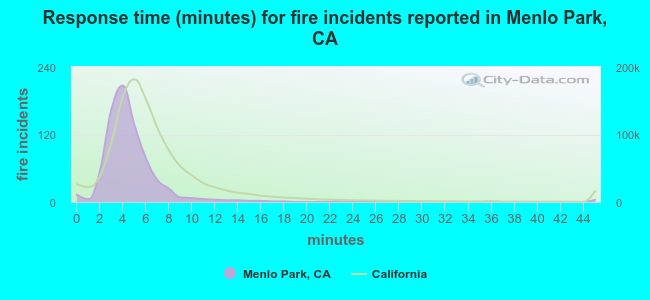 The median response time based on all reported fire incidents is 4 minutes. This is lower than the state median value.
The median response time in Menlo Park, CA compared to nearest cities:
(Note: Based on data for all years, including only cities with at least 500 fire incidents)
| Menlo Park: | 4 minutes |
| East Palo Alto: | 4 minutes |
| Palo Alto: | 6 minutes |
| Redwood City: | 5 minutes |
| San Carlos: | 5 minutes |
| Mountain View: | 5 minutes |
| Belmont: | 5 minutes |
| Foster City: | 4 minutes |
| Newark: | 4 minutes |
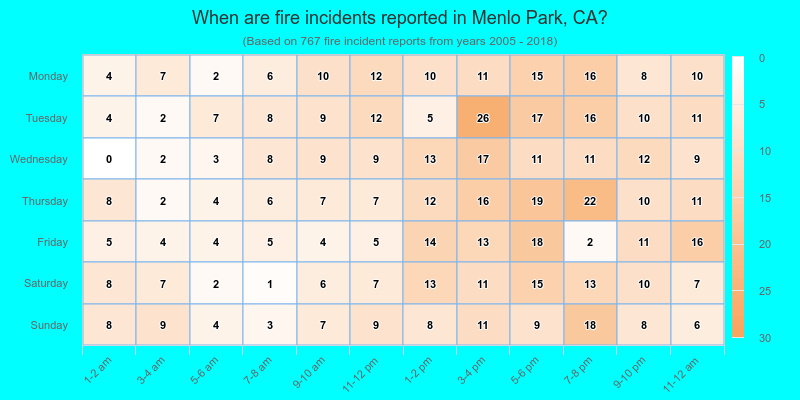
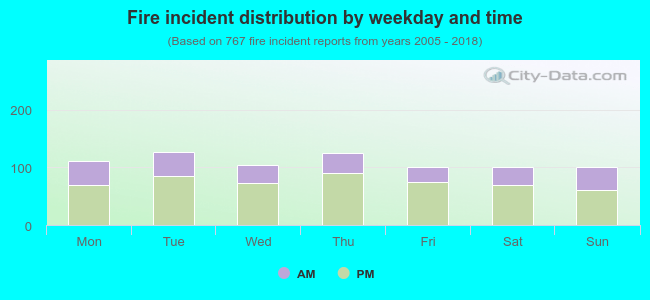 32.1% incidents where reported in the morning and 67.9% in the evening. The most fires (16.6%) took place on Tuesday, and the least (13.0%) on Saturday.
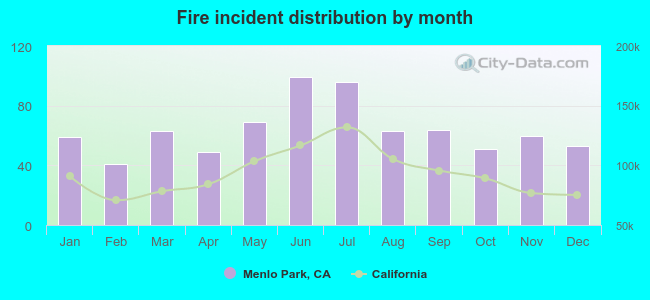 Based on the 767 reports from years 2005 - 2018 most fires (12.9%) took place during June, and the least (5.3%) in February.
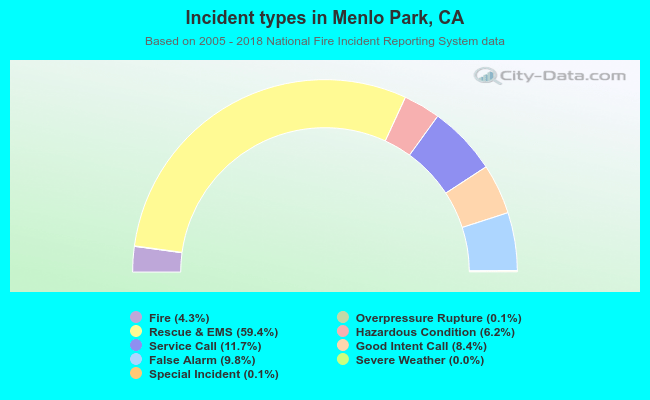 Out of all 17,854 cases reported during the years 2005 - 2018, the most belonged to the categories: Rescue & EMS (59.4%), Service Call (11.7%), and False Alarm (9.8%).
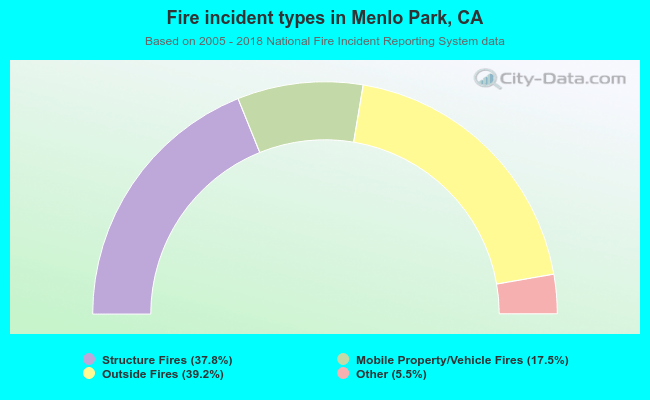 When looking into fire subcategories, the most incidents belonged to: Outside Fires (39.2%), and Structure Fires (37.8%).