Augusta: Fire Incidents, Maine (ME)
Where are fire incidents reported in Augusta, ME
Something went wrong! Please refresh the page.
| Fire incidents reported | |
|---|---|
| Sreet name | Count |
| WESTERN AVE | 156 |
| STATE ST | 146 |
| WATER ST | 106 |
| WESTERN AVENUE | 100 |
| CIVIC CENTER DR | 66 |
| STEPHEN KING DR | 62 |
| NORTHERN AVE | 56 |
| CIVIC CENTER DRIVE | 54 |
| EASTERN AVE | 50 |
| CONY ST | 48 |
| NORTH BELFAST AVE | 48 |
| GREEN ST | 44 |
| WATER STREET | 44 |
| BANGOR STREET | 42 |
| INTERSTATE 95 | 42 |
| SEWALL ST | 40 |
| CAPITOL ST | 38 |
| NORTHERN AVENUE | 38 |
| RIVERSIDE DR | 38 |
| RIVERSIDE DRIVE | 34 |
| SOUTH BELFAST AVE | 34 |
| WEST RIVER RD | 32 |
| WESTERN AVE | 30 |
| STATE STREET | 28 |
| WHITTEN RD | 28 |
| WHITTEN ROAD | 28 |
| I-95 | 26 |
| HATCH HILL RD | 24 |
| MT VERNON AVE | 24 |
| STONE STREET | 24 |
| Other | 239 |
2002 - 2018 National Fire Incident Reporting System (NFIRS) incidents
- Incident types reported to NFIRS in Augusta, ME
- 3,23933.3%Rescue & EMS
- 1,78418.3%False Alarm
- 1,76918.2%Fire
- 1,29213.3%Hazardous Condition
- 8138.4%Good Intent Call
- 6566.7%Service Call
- 981.0%Special Incident
- 530.5%Severe Weather
- 270.3%Overpressure Rupture
- Fire incident types reported to NFIRS in Augusta, ME
- 73141.3%Structure Fires
- 59833.8%Outside Fires
- 26114.8%Mobile Property/Vehicle Fires
- 17910.1%Other
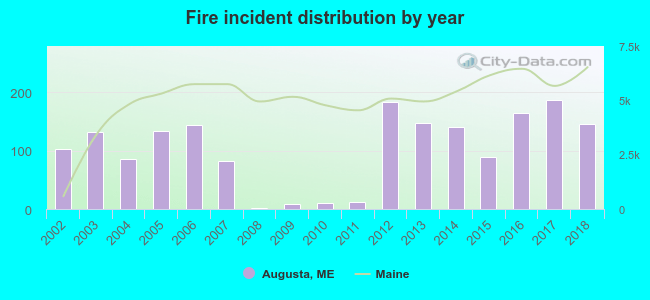 Based on the data from the years 2002 - 2018 the average number of fire incidents per year is 104. The highest number of reported fires - 186 took place in 2017, and the least - 2 in 2008. The data has an increasing trend.
The average number of yearly fire incidents per 10k residents in Augusta, ME compared to nearest cities:
(Note: Based on data for the last 3 years, including only cities with population 5,000 and above)
| Augusta: | 88.2 |
| Gardiner: | 62.8 |
| Waterville: | 71.3 |
| Winslow: | 44.5 |
| Turner: | 50.0 |
| Lisbon: | 33.7 |
| Lewiston: | 43.4 |
| Bath: | 53.3 |
| Auburn: | 50.8 |
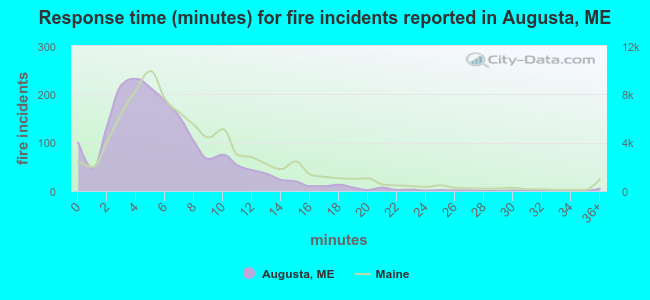 The median response time based on all reported fire incidents is 5 minutes. This is lower than the Maine median value.
The median response time in Augusta, ME compared to nearest cities:
(Note: Based on data for all years, including only cities with at least 500 fire incidents)
| Augusta: | 5 minutes |
| Oakland: | 5 minutes |
| Waterville: | 5 minutes |
| Lewiston: | 5 minutes |
| Auburn: | 7 minutes |
| Topsham: | 6 minutes |
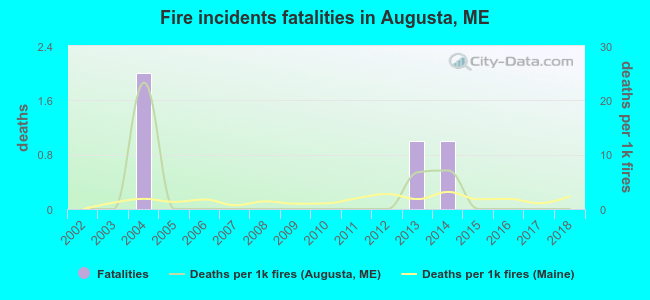 Based on the reports from the years 2002 - 2018 the average number of fire-related fatalities per year is 0. The highest number of reported deaths - 2 took place in 2004, and the lowest - 0 in 2002. The data has a constant trend.
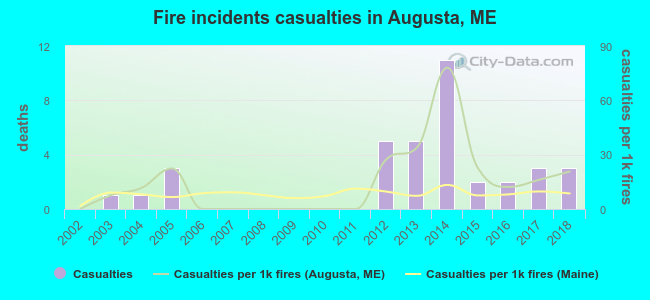 According to the reports from the years 2002 - 2018 the average number of fire-related yearly casualties is 2. The highest number of injuries - 11 took place in 2014, and the lowest - 0 in 2002. The data has a growing trend.
The average number of injuries per 1,000 fire incidents is 15. This indicator was the highest - 78 in 2014, and the lowest 0 in 2002. The trend for injuries per 1,000 fire incidents is increasing. Compared to the Maine value the number of casualties per 1,000 incidents is much higher.
According to the reports from the years 2002 - 2018 the average number of fire-related yearly casualties is 2. The highest number of injuries - 11 took place in 2014, and the lowest - 0 in 2002. The data has a growing trend.
The average number of injuries per 1,000 fire incidents is 15. This indicator was the highest - 78 in 2014, and the lowest 0 in 2002. The trend for injuries per 1,000 fire incidents is increasing. Compared to the Maine value the number of casualties per 1,000 incidents is much higher.Casualties per 1,000 incidents in Augusta, ME compared to nearest cities:
(Note: Based on data for all years, including only cities with at least 500 fire incidents)
| Augusta: | 20.4 |
| Oakland: | 29.5 |
| Waterville: | 24.2 |
| Lewiston: | 14.2 |
| Auburn: | 18.3 |
| Topsham: | 5.4 |
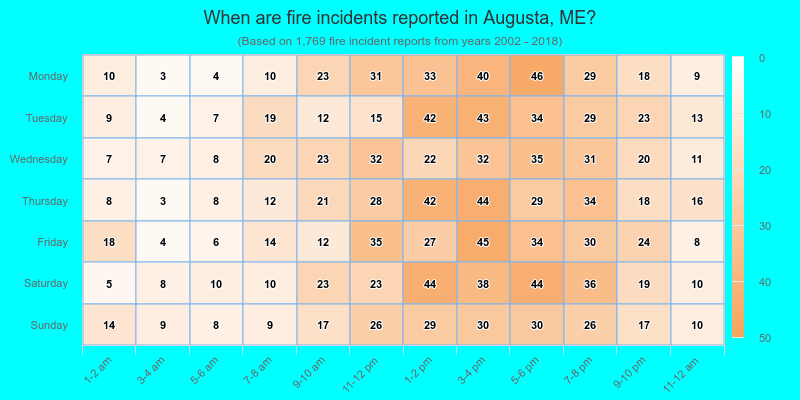
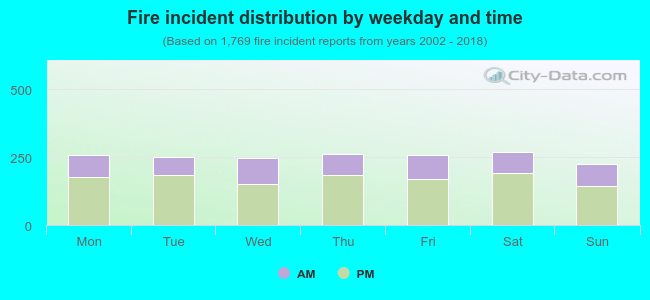 32.5% incidents where reported in the morning and 67.5% in the evening. The most fires (15.3%) took place on Saturday, and the least (12.7%) on Sunday.
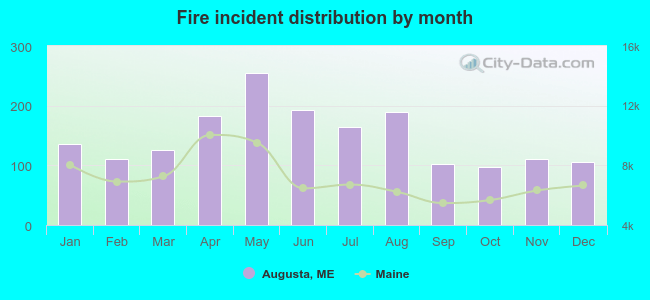 Based on the 1,769 incident reports from years 2002 - 2018 most fires (14.4%) took place during May, and the least (5.5%) in October.
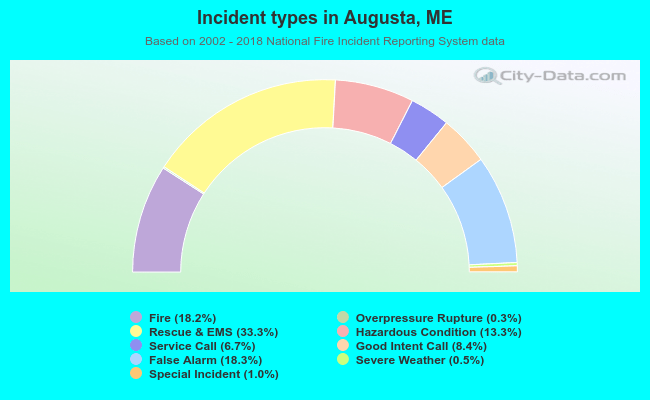 Out of all 9,731 cases reported during the years 2002 - 2018, the most belonged to the categories: Rescue & EMS (33.3%), False Alarm (18.3%), and Fire (18.2%).
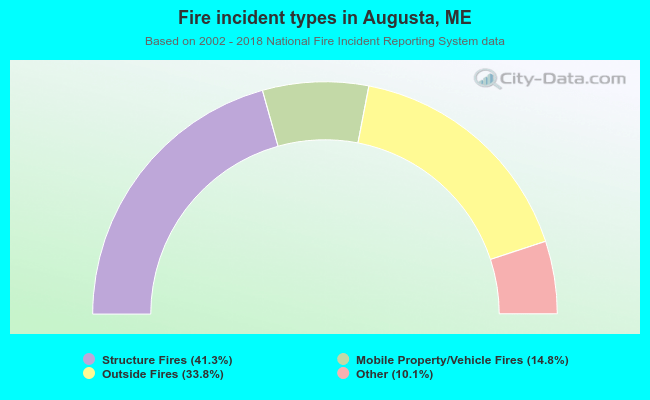 When looking into fire subcategories, the most reports belonged to: Structure Fires (41.3%), and Outside Fires (33.8%).