Barrington: Fire Incidents, New Hampshire (NH)
Where are fire incidents reported in Barrington, NH
Something went wrong! Please refresh the page.
|
| |||||||||||||||||||||||||||||||||||||||||||||||||||||||||||||||||||||||||||||||||||||||||||||||||||||||||||||
2002 - 2018 National Fire Incident Reporting System (NFIRS) incidents
- Incident types reported to NFIRS in Barrington, NH
- 2,26755.8%Rescue & EMS
- 55013.5%Hazardous Condition
- 43910.8%Service Call
- 2756.8%Fire
- 2726.7%False Alarm
- 2626.4%Good Intent Call
- Fire incident types reported to NFIRS in Barrington, NH
- 17362.9%Structure Fires
- 5419.6%Outside Fires
- 3412.4%Mobile Property/Vehicle Fires
- 145.1%Other
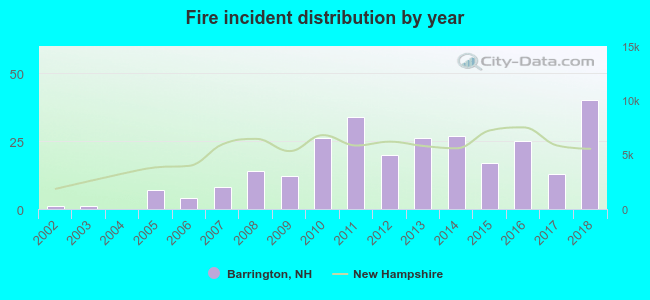 According to the data from the years 2002 - 2018 the average number of fire incidents per year is 16. The highest number of fire incidents - 40 took place in 2018, and the least - 0 in 2004. The data has a rising trend.
The average number of yearly fire incidents per 10k residents in Barrington, NH compared to nearest cities:
(Note: Based on data for the last 3 years, including only cities with population 5,000 and above)
| Barrington: | 30.3 |
| Rochester: | 24.6 |
| Durham: | 42.2 |
| Dover: | 27.6 |
| Somersworth: | 36.5 |
| Newmarket: | 32.1 |
| Stratham: | 53.3 |
| Exeter: | 59.2 |
| Portsmouth: | 34.1 |
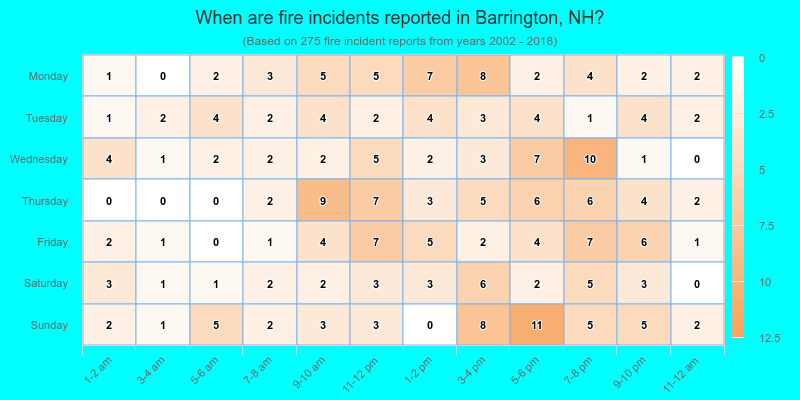
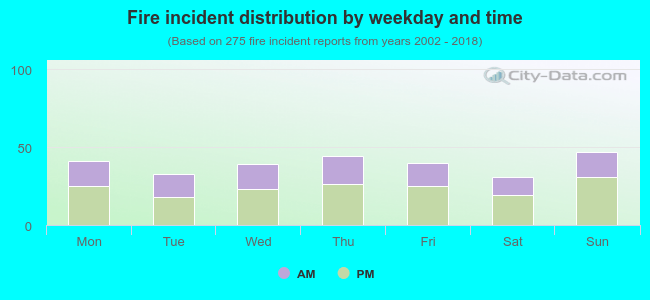 39.3% incidents where reported in the morning and 60.7% in the evening. The most fires (17.1%) took place on Sunday, and the least (11.3%) on Saturday.
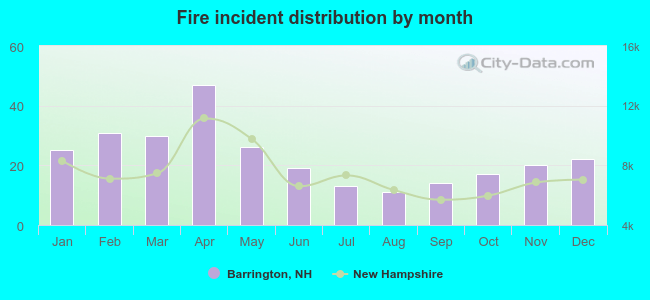 Based on the 275 fire incidents from years 2002 - 2018 most fires (17.1%) took place during April, and the least (4.0%) in August.
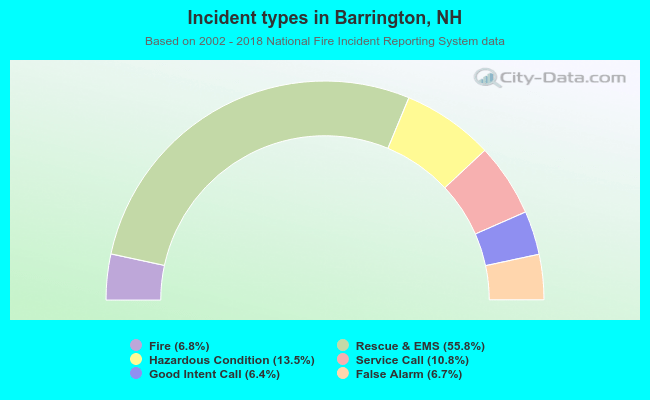 Out of all 4,065 cases reported during the years 2002 - 2018, the most belonged to the categories: Overpressure Rupture (55.8%), Rescue & EMS (13.5%), and Hazardous Condition (10.8%).
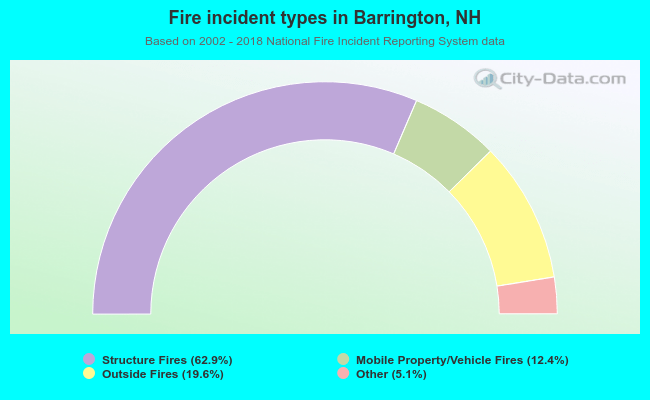 When looking into fire subcategories, the most reports belonged to: Structure Fires (62.9%), and Outside Fires (19.6%).