Basehor: Fire Incidents, Kansas (KS)
Where are fire incidents reported in Basehor, KS
Something went wrong! Please refresh the page.
|
| |||||||||||||||||||||||||||||||||||||||||||||||||||||||||||||||||||||||||||||||||||||||||||||||||||||||||||||
2002 - 2018 National Fire Incident Reporting System (NFIRS) incidents
- Incident types reported to NFIRS in Basehor, KS
- 2,06549.4%Rescue & EMS
- 88521.2%Fire
- 3989.5%Hazardous Condition
- 3568.5%Good Intent Call
- 2215.3%False Alarm
- 1964.7%Service Call
- 491.2%Special Incident
- 100.2%Severe Weather
- Fire incident types reported to NFIRS in Basehor, KS
- 52459.2%Outside Fires
- 22625.5%Structure Fires
- 9911.2%Mobile Property/Vehicle Fires
- 364.1%Other
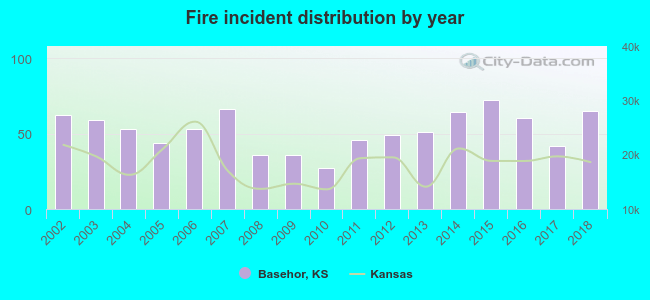 According to the data from the years 2002 - 2018 the average number of fire incidents per year is 52. The highest number of reported fire incidents - 72 took place in 2015, and the least - 27 in 2010. The data has an increasing trend.
The average number of yearly fire incidents per 10k residents in Basehor, KS compared to nearest cities:
(Note: Based on data for the last 3 years, including only cities with population 5,000 and above)
| Basehor: | 108.7 |
| Bonner Springs: | 50.3 |
| Lansing: | 30.2 |
| Tonganoxie: | 213.8 |
| Leavenworth: | 51.2 |
| De Soto: | 36.4 |
| Shawnee: | 23.6 |
| Kansas City: | 42.0 |
| Lenexa: | 30.4 |
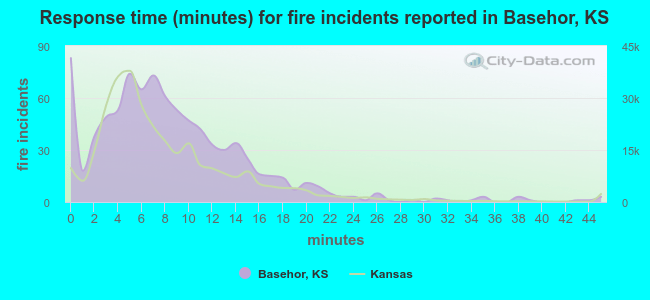 The median response time based on all reported fire incidents is 7 minutes. This is close to the state median value.
The median response time in Basehor, KS compared to nearest cities:
(Note: Based on data for all years, including only cities with at least 500 fire incidents)
| Basehor: | 7 minutes |
| Bonner Springs: | 8 minutes |
| Lansing: | 6 minutes |
| Tonganoxie: | 10 minutes |
| Linwood: | 10 minutes |
| Leavenworth: | 4 minutes |
| Shawnee: | 6 minutes |
| Kansas City: | 5 minutes |
| McLouth: | 12 minutes |
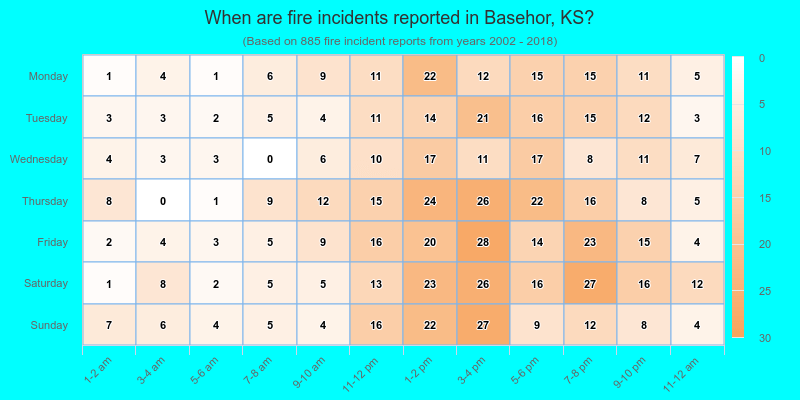
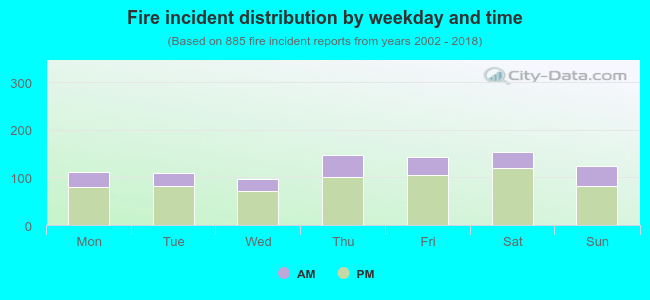 27.8% incidents where reported in the morning and 72.2% in the evening. The most fires (17.4%) took place on Saturday, and the least (11.0%) on Wednesday.
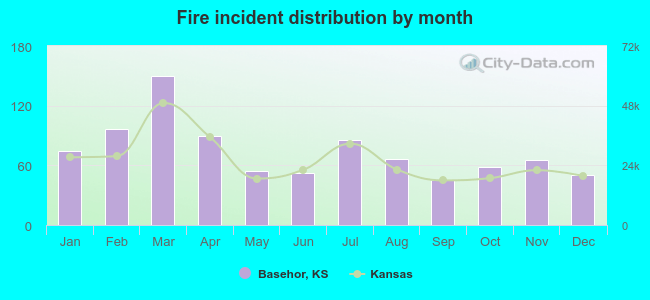 Based on the 885 fire incident reports from years 2002 - 2018 most fires (16.9%) took place during March, and the least (5.1%) in September.
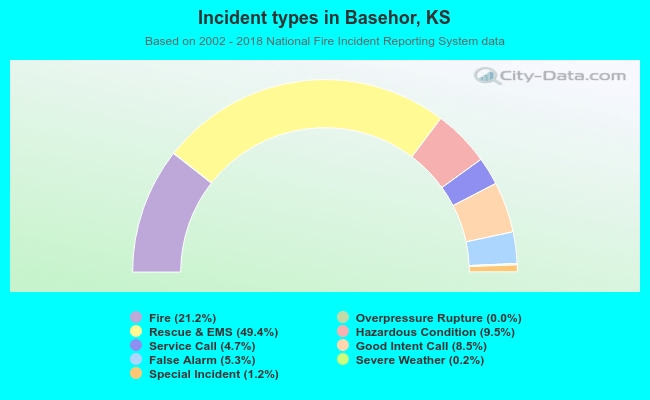 Out of all 4,182 cases reported during the years 2002 - 2018, the most belonged to the categories: Rescue & EMS (49.4%), Fire (21.2%), and Hazardous Condition (9.5%).
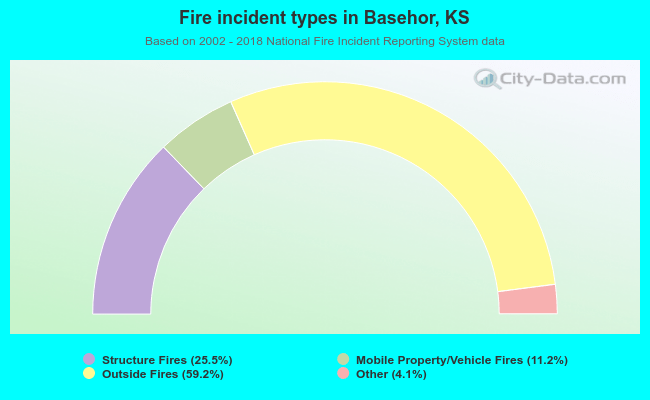 When looking into fire subcategories, the most reports belonged to: Outside Fires (59.2%), and Structure Fires (25.5%).