Tonganoxie: Fire Incidents, Kansas (KS)
Where are fire incidents reported in Tonganoxie, KS
Something went wrong! Please refresh the page.
| Fire incidents reported | |
|---|---|
| Sreet name | Count |
| 219TH ST | 94 |
| MCLOUTH RD | 88 |
| PARALLEL RD | 80 |
| EVANS RD | 78 |
| 198TH | 72 |
| 182ND | 68 |
| KANSAS AVE | 66 |
| 246TH ST | 60 |
| 4TH ST | 58 |
| EVANS | 56 |
| PARALLEL | 50 |
| LEAVENWORTH RD | 48 |
| STATE AVE | 46 |
| GEORGE RD | 44 |
| KTA | 44 |
| CHIEFTAIN RD | 42 |
| STATE AVE | 40 |
| 235TH ST | 36 |
| HATCHELL RD | 36 |
| DEHOFF RD | 34 |
| 187TH ST | 32 |
| TONGANOXIE RD | 32 |
| 174 | 30 |
| 207TH | 30 |
| TONGANOXIE RD | 30 |
| 198TH ST | 28 |
| 1ST ST | 28 |
| 206TH | 28 |
| 206TH ST | 28 |
| 227TH ST | 28 |
| Other | 529 |
2002 - 2018 National Fire Incident Reporting System (NFIRS) incidents
- Incident types reported to NFIRS in Tonganoxie, KS
- 3,38942.8%Rescue & EMS
- 1,96324.8%Fire
- 1,08013.6%Hazardous Condition
- 6708.5%Good Intent Call
- 4575.8%Service Call
- 2022.5%False Alarm
- 1201.5%Special Incident
- 410.5%Severe Weather
- Fire incident types reported to NFIRS in Tonganoxie, KS
- 1,15959.0%Outside Fires
- 61331.2%Structure Fires
- 1758.9%Mobile Property/Vehicle Fires
- 160.8%Other
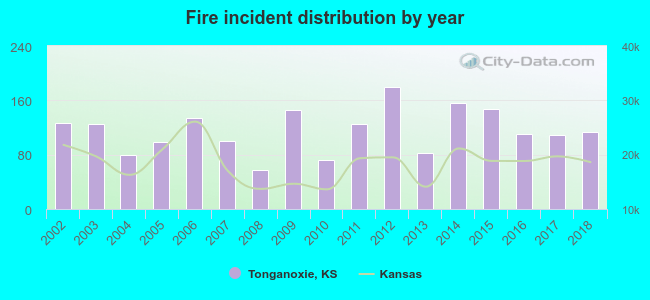 According to the data from the years 2002 - 2018 the average number of fire incidents per year is 115. The highest number of reported fires - 180 took place in 2012, and the least - 58 in 2008. The data has a declining trend.
The average number of yearly fire incidents per 10k residents in Tonganoxie, KS compared to nearest cities:
(Note: Based on data for the last 3 years, including only cities with population 5,000 and above)
| Tonganoxie: | 213.8 |
| Basehor: | 108.7 |
| Bonner Springs: | 50.3 |
| Eudora: | 108.4 |
| De Soto: | 36.4 |
| Lawrence: | 40.1 |
| Lansing: | 30.2 |
| Leavenworth: | 51.2 |
| Shawnee: | 23.6 |
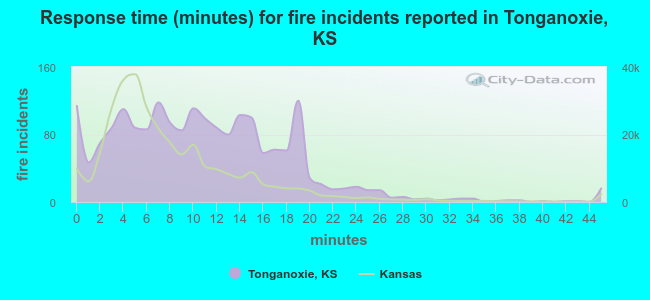 The median response time based on all reported fire incidents is 10 minutes. This is higher than the state median value.
The median response time in Tonganoxie, KS compared to nearest cities:
(Note: Based on data for all years, including only cities with at least 500 fire incidents)
| Tonganoxie: | 10 minutes |
| Linwood: | 10 minutes |
| Basehor: | 7 minutes |
| McLouth: | 12 minutes |
| Bonner Springs: | 8 minutes |
| Eudora: | 8 minutes |
| Lawrence: | 6 minutes |
| Lansing: | 6 minutes |
| Oskaloosa: | 12 minutes |
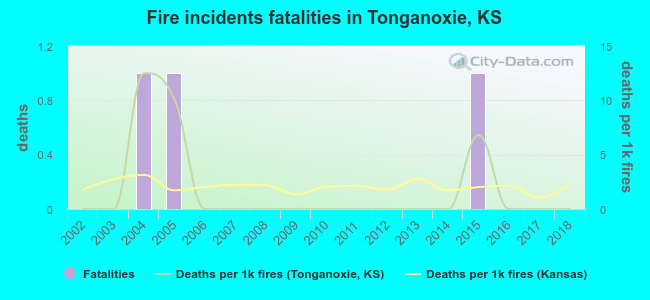 According to the data from the years 2002 - 2018 the average number of fire-related fatalities per year is 0. The highest number of deaths - 1 took place in 2004, and the lowest - 0 in 2002. The data has a constant trend.
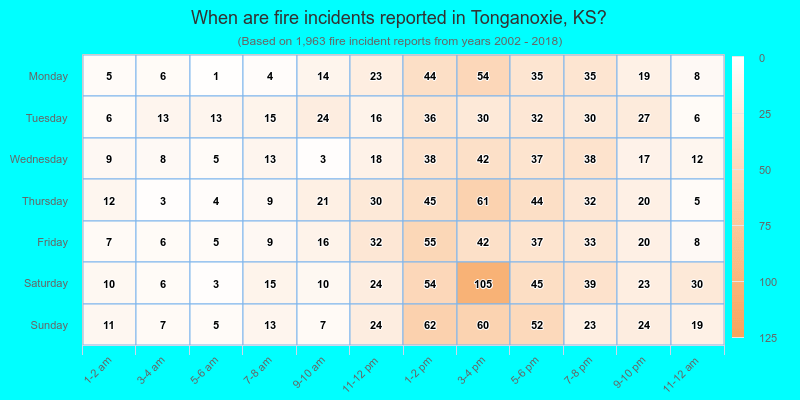
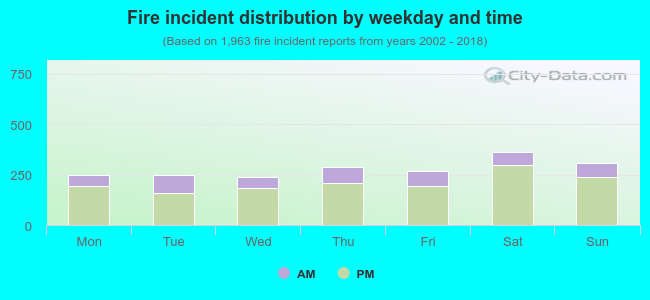 24.7% incidents where reported in the morning and 75.3% in the evening. The most fires (18.5%) took place on Saturday, and the least (12.2%) on Wednesday.
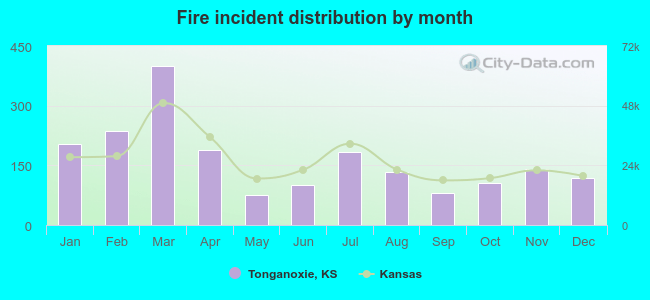 Based on the 1,963 reports from years 2002 - 2018 most fires (20.3%) took place during March, and the least (3.9%) in May.
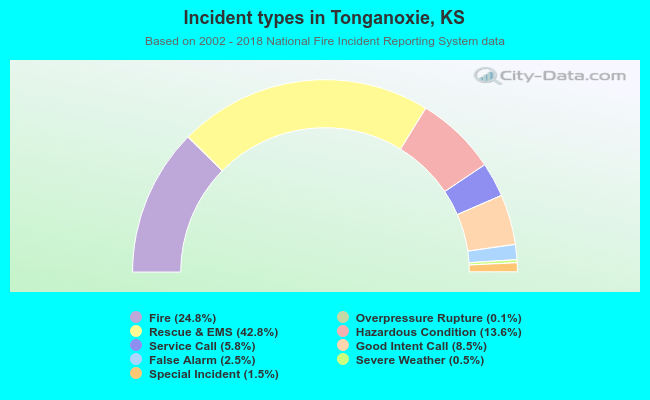 Out of all 7,927 cases reported during the years 2002 - 2018, the most belonged to the categories: Rescue & EMS (42.8%), Fire (24.8%), and Hazardous Condition (13.6%).
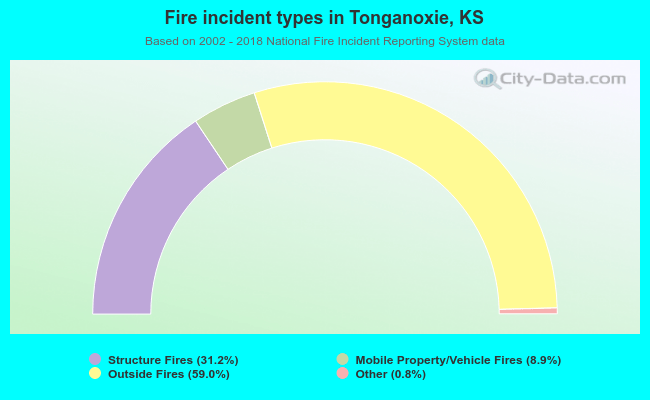 When looking into fire subcategories, the most reports belonged to: Outside Fires (59.0%), and Structure Fires (31.2%).