Bergenfield: Fire Incidents, New Jersey (NJ)
Where are fire incidents reported in Bergenfield, NJ
Something went wrong! Please refresh the page.
| Fire incidents reported | |
|---|---|
| Sreet name | Count |
| WASHINGTON AVE | 392 |
| CHURCH ST | 128 |
| CLINTON AVE | 96 |
| MAIN ST | 88 |
| HOWARD DR | 80 |
| LEGION DR | 62 |
| PROSPECT AVE | 62 |
| MURRAY HILL TER | 52 |
| NEWBRIDGE RD | 52 |
| HICKORY AVE | 38 |
| BROAD ST | 36 |
| GEORGIAN CT | 30 |
| NEW JERSEY AVE | 30 |
| RECTOR CT | 26 |
| WASHINGTON | 26 |
| BRADLEY AVE | 24 |
| ELDER AVE | 22 |
| NEW BRIDGE RD | 22 |
| ANNEX PL | 20 |
| FAIRVIEW AVE | 20 |
| JOHNSON AVE | 20 |
| ELM ST | 18 |
| LEE PL | 18 |
| LIBERTY RD | 18 |
| PORTLAND AVE | 18 |
| RIVEREDGE RD | 18 |
| WOODBINE ST | 18 |
| GLENWOOD DR | 16 |
| HALLBERG AVE | 16 |
| TRINITY CT | 16 |
2003 - 2018 National Fire Incident Reporting System (NFIRS) incidents
- Incident types reported to NFIRS in Bergenfield, NJ
- 1,93432.9%Hazardous Condition
- 1,65228.1%False Alarm
- 1,37723.4%Fire
- 3626.2%Rescue & EMS
- 3035.2%Service Call
- 2263.8%Good Intent Call
- 210.4%Overpressure Rupture
- Fire incident types reported to NFIRS in Bergenfield, NJ
- 1,00773.1%Structure Fires
- 24217.6%Outside Fires
- 956.9%Mobile Property/Vehicle Fires
- 332.4%Other
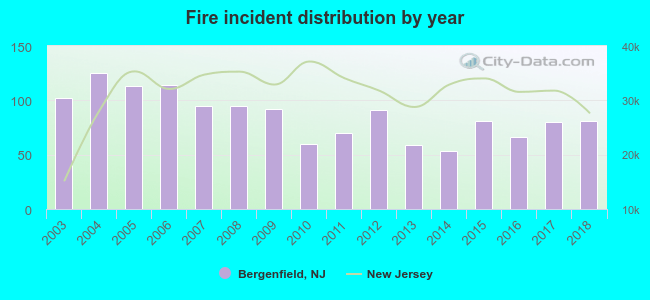 According to the data from the years 2003 - 2018 the average number of fires per year is 86. The highest number of reported fires - 125 took place in 2004, and the least - 53 in 2014. The data has a declining trend.
The average number of yearly fire incidents per 10k residents in Bergenfield, NJ compared to nearest cities:
(Note: Based on data for the last 3 years, including only cities with population 5,000 and above)
| Bergenfield: | 27.6 |
| New Milford: | 8.2 |
| Dumont: | 20.0 |
| Tenafly: | 11.0 |
| River Edge: | 15.3 |
| Cresskill: | 9.1 |
| Teaneck: | 47.0 |
| Englewood: | 88.8 |
| Oradell: | 32.7 |
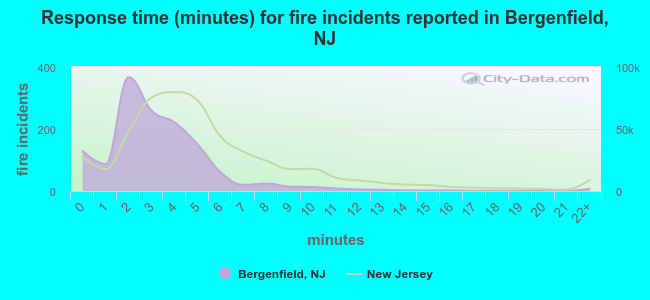 The median response time based on all reported fire incidents is 3 minutes. This is lower compared to the state median value.
The median response time in Bergenfield, NJ compared to nearest cities:
(Note: Based on data for all years, including only cities with at least 500 fire incidents)
| Bergenfield: | 3 minutes |
| Teaneck: | 3 minutes |
| Englewood: | 4 minutes |
| Oradell: | 4 minutes |
| Hackensack: | 3 minutes |
| Leonia: | 3 minutes |
| Fort Lee: | 4 minutes |
| Palisades Park: | 2 minutes |
| Lodi: | 4 minutes |
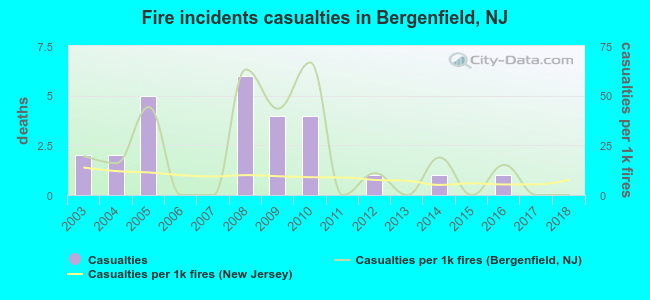 Based on the data from the years 2003 - 2018 the average number of fire-related casualties per year is 2. The highest number of reported injuries - 6 took place in 2008, and the lowest - 0 in 2006. The data has a dropping trend.
The average number of casualties per 1,000 fires is 19. This indicator was the highest - 67 in 2010, and the lowest 0 in 2006. The trend for casualties per 1,000 fires is decreasing. Compared to the state value the number of casualties per 1,000 fire incidents is much higher.
Based on the data from the years 2003 - 2018 the average number of fire-related casualties per year is 2. The highest number of reported injuries - 6 took place in 2008, and the lowest - 0 in 2006. The data has a dropping trend.
The average number of casualties per 1,000 fires is 19. This indicator was the highest - 67 in 2010, and the lowest 0 in 2006. The trend for casualties per 1,000 fires is decreasing. Compared to the state value the number of casualties per 1,000 fire incidents is much higher.Casualties per 1,000 incidents in Bergenfield, NJ compared to nearest cities:
(Note: Based on data for all years, including only cities with at least 500 fire incidents)
| Bergenfield: | 18.9 |
| Teaneck: | 11.1 |
| Englewood: | 6.3 |
| Oradell: | 25.3 |
| Hackensack: | 13.1 |
| Leonia: | 1.4 |
| Fort Lee: | 18.4 |
| Palisades Park: | 7.4 |
| Lodi: | 6.3 |
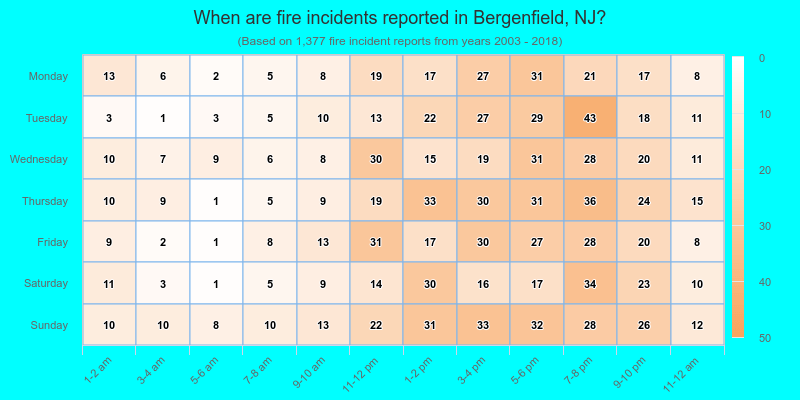
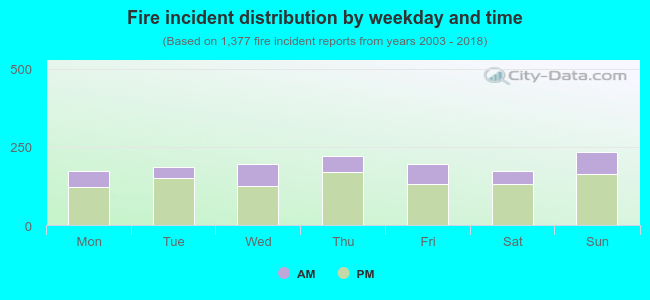 28.4% incidents where reported in the morning and 71.6% in the evening. The most fires (17.1%) took place on Sunday, and the least (12.6%) on Saturday.
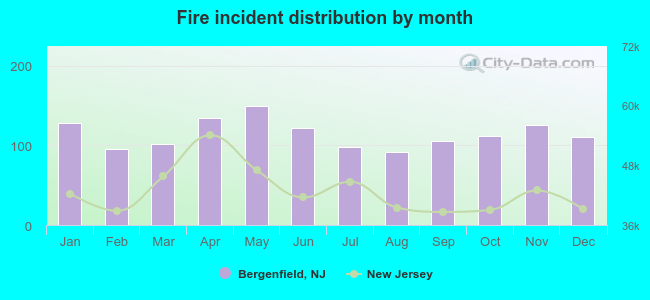 Based on the 1,377 reports from years 2003 - 2018 most fires (10.9%) took place during May, and the least (6.7%) in August.
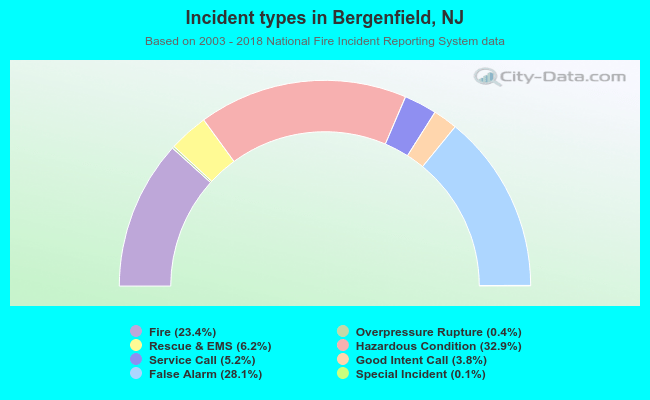 Out of all 5,879 cases reported during the years 2003 - 2018, the most belonged to the categories: Hazardous Condition (32.9%), False Alarm (28.1%), and Fire (23.4%).
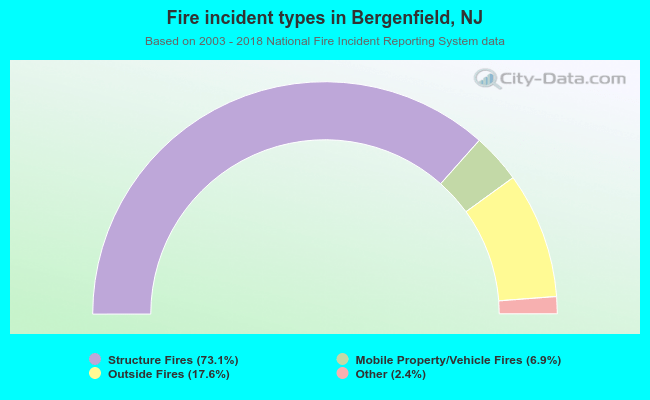 When looking into fire subcategories, the most incidents belonged to: Structure Fires (73.1%), and Outside Fires (17.6%).