Beverly Hills: Fire Incidents, California (CA)
Where are fire incidents reported in Beverly Hills, CA
Something went wrong! Please refresh the page.
| Fire incidents reported | |
|---|---|
| Sreet name | Count |
| BEVERLY DR | 96 |
| WILSHIRE BLVD | 86 |
| RODEO DR | 56 |
| BEDFORD DR | 50 |
| CANON DR | 50 |
| CRESCENT DR | 50 |
| PALM DR | 48 |
| CAMDEN DR | 42 |
| DOHENY DR | 42 |
| MAPLE DR | 38 |
| OAKHURST DR | 36 |
| REXFORD DR | 36 |
| LA PEER DR | 26 |
| ROXBURY DR | 26 |
| ELM DR | 24 |
| LA CIENEGA BLVD | 24 |
| SPALDING DR | 24 |
| SWALL DR | 24 |
| ALMONT DR | 22 |
| SANTA MONICA BLVD | 22 |
| LINDEN DR | 20 |
| LOMA VISTA DR | 20 |
| OLYMPIC BLVD | 20 |
| WILSHIRE BL | 20 |
| FOOTHILL RD | 18 |
| HILLCREST RD | 18 |
| COLDWATER CANYON DR | 16 |
| ROBERTSON BLVD | 16 |
| ALPINE DR | 14 |
| BRIGHTON WAY | 14 |
2005 - 2018 National Fire Incident Reporting System (NFIRS) incidents
- Incident types reported to NFIRS in Beverly Hills, CA
- 17,56059.4%Rescue & EMS
- 4,51615.3%Good Intent Call
- 3,49211.8%False Alarm
- 1,5255.2%Service Call
- 1,4284.8%Hazardous Condition
- 8362.8%Fire
- 1350.5%Severe Weather
- 420.1%Special Incident
- Fire incident types reported to NFIRS in Beverly Hills, CA
- 31537.7%Structure Fires
- 31037.1%Outside Fires
- 12014.4%Mobile Property/Vehicle Fires
- 9110.9%Other
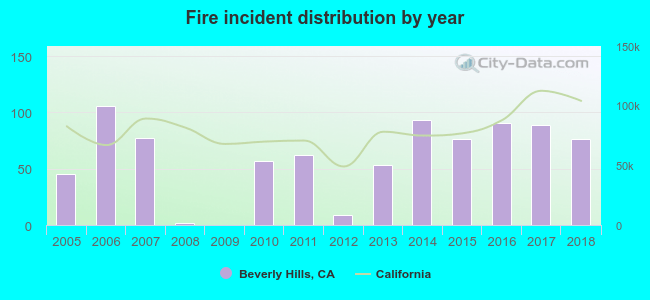 According to the data from the years 2005 - 2018 the average number of fires per year is 60. The highest number of reported fires - 106 took place in 2006, and the least - 0 in 2009. The data has a growing trend.
The average number of yearly fire incidents per 10k residents in Beverly Hills, CA compared to nearest cities:
(Note: Based on data for the last 3 years, including only cities with population 5,000 and above)
| Beverly Hills: | 24.5 |
| Los Angeles: | 16.6 |
| West Hollywood: | 25.5 |
| Culver City: | 17.9 |
| Santa Monica: | 23.0 |
| Ladera Heights: | 17.4 |
| Marina del Rey: | 28.9 |
| Burbank: | 18.2 |
| Inglewood: | 23.8 |
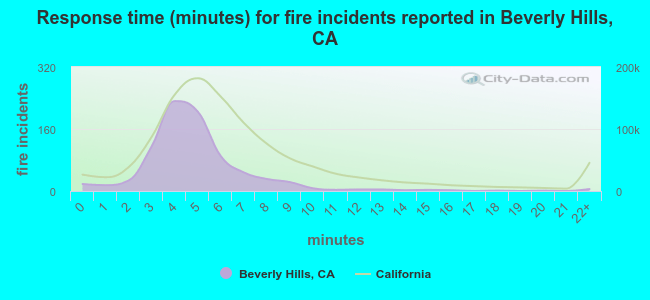 The median response time based on all reported fire incidents is 5 minutes. This is lower than the California median value.
The median response time in Beverly Hills, CA compared to nearest cities:
(Note: Based on data for all years, including only cities with at least 500 fire incidents)
| Beverly Hills: | 5 minutes |
| Los Angeles: | 5 minutes |
| West Hollywood: | 4 minutes |
| Culver City: | 6 minutes |
| Santa Monica: | 5 minutes |
| Burbank: | 4 minutes |
| Inglewood: | 4 minutes |
| El Segundo: | 5 minutes |
| Glendale: | 5 minutes |
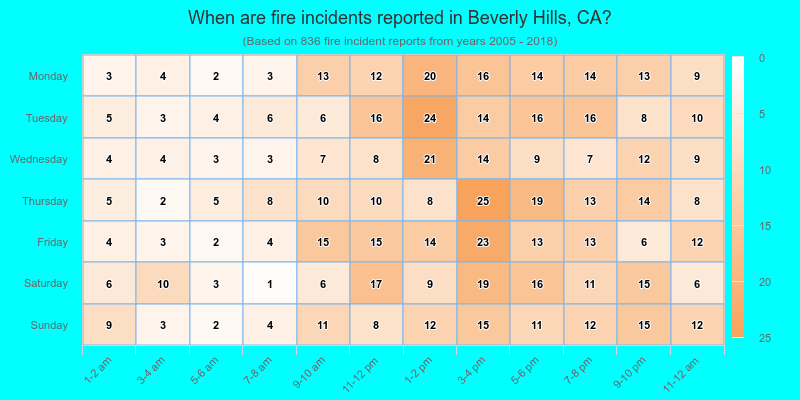
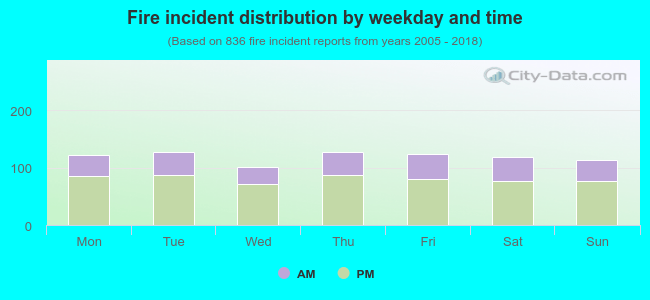 32.2% incidents where reported in the morning and 67.8% in the evening. The most fires (15.3%) took place on Tuesday, and the least (12.1%) on Wednesday.
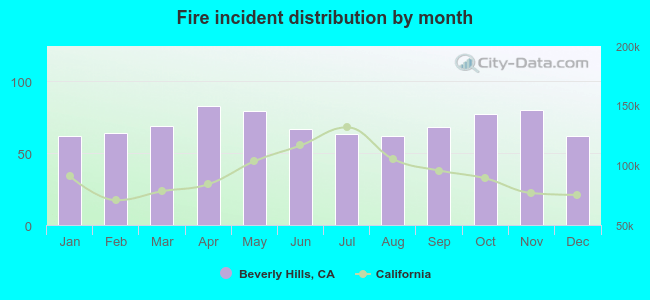 According to the 836 fire incident reports from years 2005 - 2018 most fires (9.9%) took place during April, and the least (7.4%) in January.
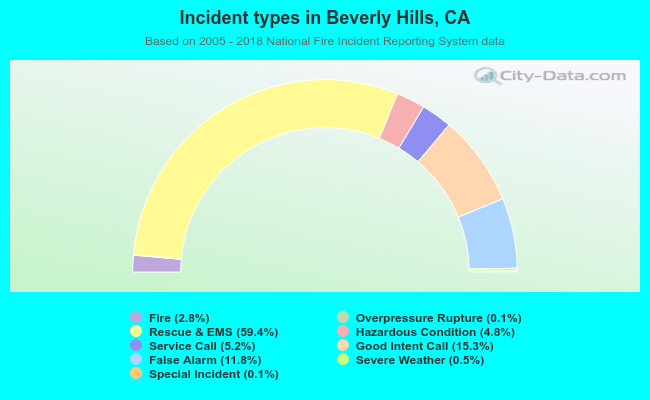 Out of all 29,549 cases reported during the years 2005 - 2018, the most belonged to the categories: Rescue & EMS (59.4%), Good Intent Call (15.3%), and False Alarm (11.8%).
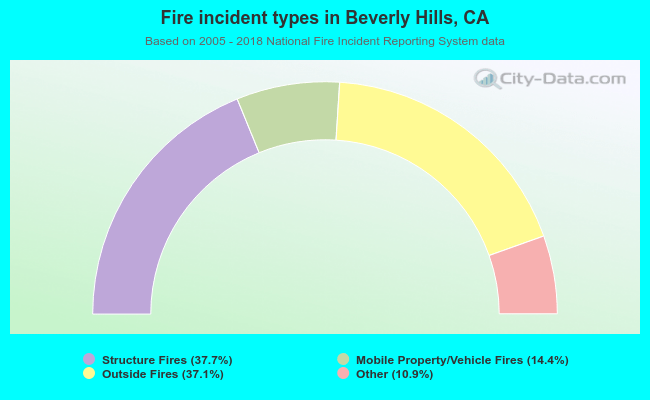 When looking into fire subcategories, the most reports belonged to: Structure Fires (37.7%), and Outside Fires (37.1%).