Los Angeles: Fire Incidents, California (CA)
Where are fire incidents reported in Los Angeles, CA
Something went wrong! Please refresh the page.
| Fire incidents reported | |
|---|---|
| Sreet name | Count |
| FIGUEROA ST | 862 |
| MAIN ST | 604 |
| 7TH ST | 532 |
| SAN PEDRO ST | 482 |
| BROADWAY ST | 412 |
| 6TH ST | 406 |
| 8TH ST | 358 |
| HOOVER ST | 346 |
| WILSHIRE BL | 336 |
| 3RD ST | 334 |
| VERMONT AV | 334 |
| WESTERN AV | 322 |
| CENTRAL AV | 306 |
| PICO BL | 292 |
| 5TH ST | 282 |
| SAN FERNANDO RD | 280 |
| SUNSET BL | 278 |
| VERMONT | 276 |
| NORMANDIE AV | 272 |
| WILSHIRE | 268 |
| IMPERIAL HW X | 260 |
| WESTERN | 252 |
| BERENDO ST | 248 |
| OLYMPIC BL | 244 |
| 1ST ST | 240 |
| 74TH ST | 234 |
| CRENSHAW BL | 234 |
| ST ANDREWS PL | 234 |
| AVALON BL | 232 |
| KING BL | 232 |
| Other | 75,493 |
2005 - 2018 National Fire Incident Reporting System (NFIRS) incidents
- Incident types reported to NFIRS in Los Angeles, CA
- 85,48530.6%Fire
- 72,31625.9%False Alarm
- 42,26115.1%Good Intent Call
- 39,64914.2%Hazardous Condition
- 17,3496.2%Service Call
- 16,0705.8%Rescue & EMS
- 5,0061.8%Special Incident
- 8130.3%Severe Weather
- 3430.1%Overpressure Rupture
- Fire incident types reported to NFIRS in Los Angeles, CA
- 34,18340.0%Structure Fires
- 26,41830.9%Outside Fires
- 22,56226.4%Mobile Property/Vehicle Fires
- 2,3222.7%Other
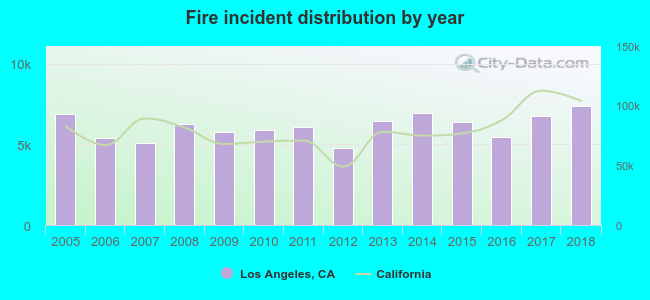 According to the data from the years 2005 - 2018 the average number of fire incidents per year is 6,106. The highest number of reported fire incidents - 7,395 took place in 2018, and the least - 4,765 in 2012. The data has a rising trend.
The average number of yearly fire incidents per 10k residents in Los Angeles, CA compared to nearest cities:
(Note: Based on data for the last 3 years, including only cities with population 5,000 and above)
| Los Angeles: | 16.6 |
| West Hollywood: | 25.5 |
| Beverly Hills: | 24.5 |
| Culver City: | 17.9 |
| Ladera Heights: | 17.4 |
| Burbank: | 18.2 |
| Santa Monica: | 23.0 |
| Marina del Rey: | 28.9 |
| Inglewood: | 23.8 |
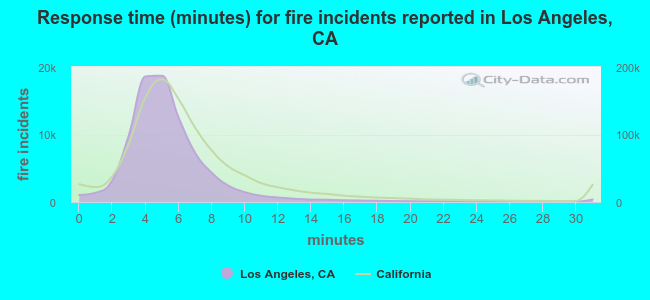 The median response time based on all reported fire incidents is 5 minutes. This is lower compared to the California median value.
The median response time in Los Angeles, CA compared to nearest cities:
(Note: Based on data for all years, including only cities with at least 500 fire incidents)
| Los Angeles: | 5 minutes |
| West Hollywood: | 4 minutes |
| Beverly Hills: | 5 minutes |
| Culver City: | 6 minutes |
| Burbank: | 4 minutes |
| Santa Monica: | 5 minutes |
| Inglewood: | 4 minutes |
| Glendale: | 5 minutes |
| Vernon: | 5 minutes |
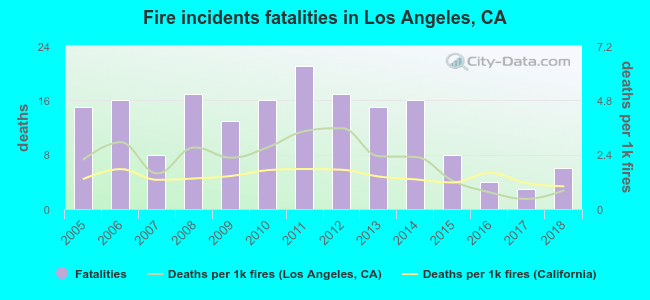 Based on the reports from the years 2005 - 2018 the average number of fire-related yearly deaths is 13. The highest number of reported deaths - 21 took place in 2011, and the lowest - 3 in 2017. The data has a dropping trend.
The average number of deaths per 1,000 fire incidents is 2. This indicator was the highest - 4 in 2012, and the lowest 0 in 2017. The trend for deaths per 1,000 incidents is declining. Compared to the California value the number of fatalities per 1,000 fires is higher.
Based on the reports from the years 2005 - 2018 the average number of fire-related yearly deaths is 13. The highest number of reported deaths - 21 took place in 2011, and the lowest - 3 in 2017. The data has a dropping trend.
The average number of deaths per 1,000 fire incidents is 2. This indicator was the highest - 4 in 2012, and the lowest 0 in 2017. The trend for deaths per 1,000 incidents is declining. Compared to the California value the number of fatalities per 1,000 fires is higher.
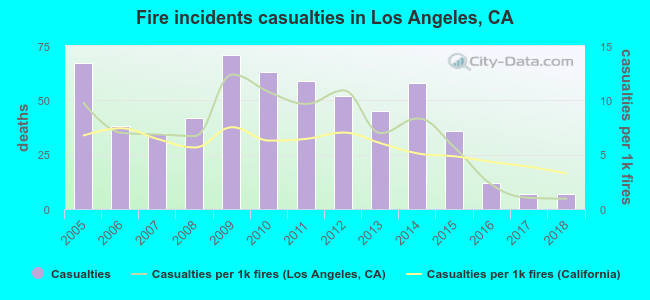 According to the data from the years 2005 - 2018 the average number of fire-related casualties per year is 42. The highest number of injuries - 71 took place in 2009, and the lowest - 7 in 2017. The data has a dropping trend.
The average number of casualties per 1,000 fire incidents is 7. This indicator was the highest - 12 in 2009, and the lowest 1 in 2018. The trend for injuries per 1,000 fire incidents is dropping. Compared to the state value the number of casualties per 1,000 fires is higher.
According to the data from the years 2005 - 2018 the average number of fire-related casualties per year is 42. The highest number of injuries - 71 took place in 2009, and the lowest - 7 in 2017. The data has a dropping trend.
The average number of casualties per 1,000 fire incidents is 7. This indicator was the highest - 12 in 2009, and the lowest 1 in 2018. The trend for injuries per 1,000 fire incidents is dropping. Compared to the state value the number of casualties per 1,000 fires is higher.Casualties per 1,000 incidents in Los Angeles, CA compared to nearest cities:
(Note: Based on data for all years, including only cities with at least 500 fire incidents)
| Los Angeles: | 6.9 |
| West Hollywood: | 0.0 |
| Beverly Hills: | 2.4 |
| Culver City: | 0.0 |
| Burbank: | 4.8 |
| Santa Monica: | 7.7 |
| Inglewood: | 0.0 |
| Glendale: | 0.4 |
| Vernon: | 7.3 |
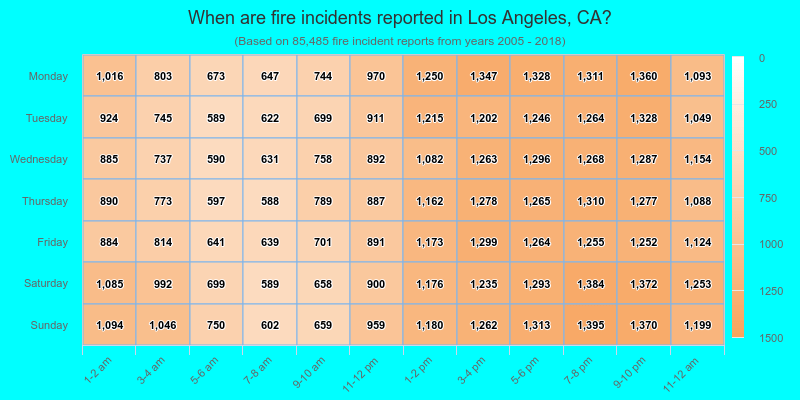
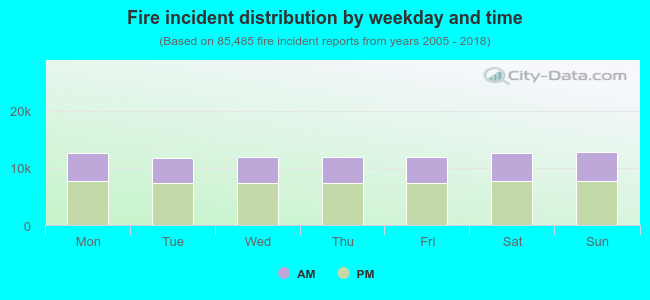 38.6% incidents where reported in the morning and 61.4% in the evening. The most fires (15.0%) took place on Sunday, and the least (13.8%) on Tuesday.
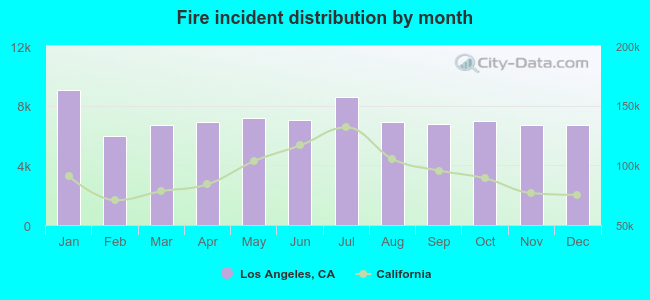 Based on the 85,485 incident reports from years 2005 - 2018 most fires (10.6%) took place during January, and the least (7.0%) in February.
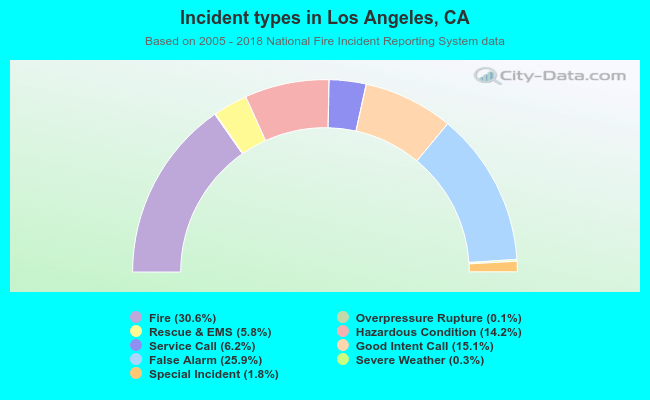 Out of all 279,292 cases reported during the years 2005 - 2018, the most belonged to the categories: Fire (30.6%), False Alarm (25.9%), and Good Intent Call (15.1%).
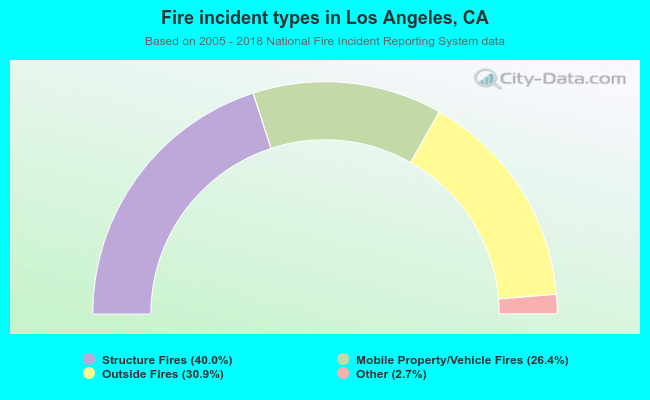 When looking into fire subcategories, the most incidents belonged to: Structure Fires (40.0%), and Outside Fires (30.9%).