Bridgeport: Fire Incidents, Connecticut (CT)
Where are fire incidents reported in Bridgeport, CT
Something went wrong! Please refresh the page.
| Fire incidents reported | |
|---|---|
| Sreet name | Count |
| MAIN ST | 368 |
| FAIRFIELD AVE | 176 |
| PARK AVE | 170 |
| STATE ST | 146 |
| EAST MAIN ST | 116 |
| BOSTON AVE | 106 |
| FAIRFIELD AV | 106 |
| NORTH AVE | 104 |
| E MAIN ST | 96 |
| PARK AV | 96 |
| NOBLE AVE | 92 |
| WASHINGTON AVE | 90 |
| BIRD ST | 86 |
| TRUMBULL AVE | 86 |
| KOSSUTH ST | 82 |
| WILLIAM ST | 78 |
| HUNTINGTON TPKE | 76 |
| CENTRAL AVE | 74 |
| NORTH AV | 74 |
| IRANISTAN AVE | 72 |
| PALISADE AVE | 72 |
| NORMAN ST | 68 |
| LINDLEY ST | 66 |
| MADISON AV | 66 |
| ANTHONY ST | 64 |
| ATLANTIC ST | 64 |
| MADISON AVE | 62 |
| STRATFORD AVE | 62 |
| CENTRAL AV | 60 |
| BOSTON AV | 56 |
| Other | 3,821 |
2004 - 2018 National Fire Incident Reporting System (NFIRS) incidents
- Incident types reported to NFIRS in Bridgeport, CT
- 43,89955.7%Rescue & EMS
- 10,96513.9%Hazardous Condition
- 9,14111.6%False Alarm
- 6,7558.6%Fire
- 5,5967.1%Service Call
- 2,2472.9%Good Intent Call
- 1050.1%Overpressure Rupture
- Fire incident types reported to NFIRS in Bridgeport, CT
- 2,51237.2%Structure Fires
- 2,30734.2%Outside Fires
- 1,67624.8%Mobile Property/Vehicle Fires
- 2603.8%Other
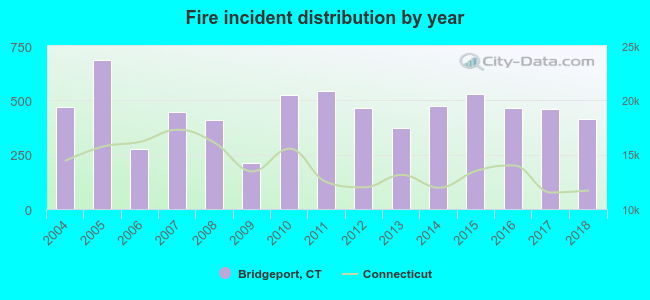 According to the data from the years 2004 - 2018 the average number of fires per year is 450. The highest number of fires - 686 took place in 2005, and the least - 210 in 2009. The data has a declining trend.
The average number of yearly fire incidents per 10k residents in Bridgeport, CT compared to nearest cities:
(Note: Based on data for the last 3 years, including only cities with population 5,000 and above)
| Bridgeport: | 30.2 |
| Stratford: | 32.9 |
| Fairfield: | 22.6 |
| Trumbull: | 36.1 |
| Easton: | 34.3 |
| Milford: | 21.3 |
| Westport: | 32.1 |
| Shelton: | 16.1 |
| Weston: | 20.6 |
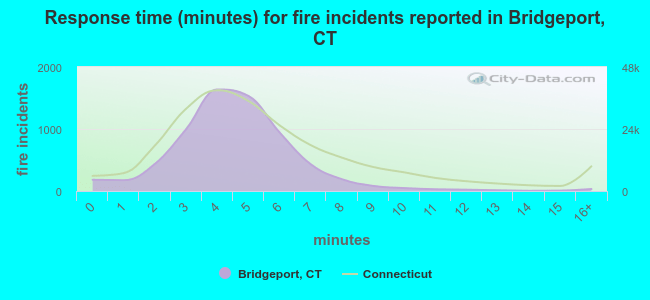 The median response time based on all reported fire incidents is 4 minutes. This is lower compared to the Connecticut median value.
The median response time in Bridgeport, CT compared to nearest cities:
(Note: Based on data for all years, including only cities with at least 500 fire incidents)
| Bridgeport: | 4 minutes |
| Stratford: | 5 minutes |
| Fairfield: | 6 minutes |
| Trumbull: | 6 minutes |
| Milford: | 5 minutes |
| Westport: | 5 minutes |
| Shelton: | 7 minutes |
| Weston: | 6 minutes |
| Monroe: | 6 minutes |
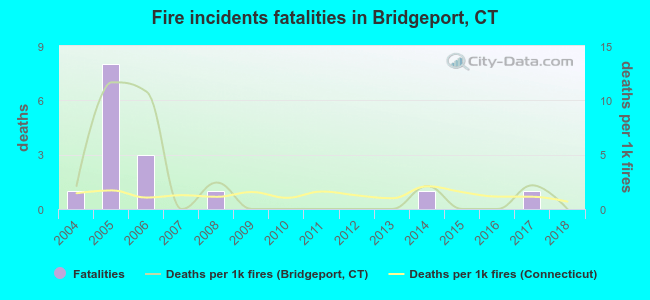 According to the data from the years 2004 - 2018 the average number of fire-related fatalities per year is 1. The highest number of reported deaths - 8 took place in 2005, and the lowest - 0 in 2007. The data has a decreasing trend.
The average number of fatalities per 1,000 fires is 2. This indicator was the highest - 12 in 2005, and the lowest 0 in 2007. The trend for fatalities per 1,000 fires is decreasing. Compared to the state value the number of deaths per 1,000 incidents is higher.
According to the data from the years 2004 - 2018 the average number of fire-related fatalities per year is 1. The highest number of reported deaths - 8 took place in 2005, and the lowest - 0 in 2007. The data has a decreasing trend.
The average number of fatalities per 1,000 fires is 2. This indicator was the highest - 12 in 2005, and the lowest 0 in 2007. The trend for fatalities per 1,000 fires is decreasing. Compared to the state value the number of deaths per 1,000 incidents is higher.
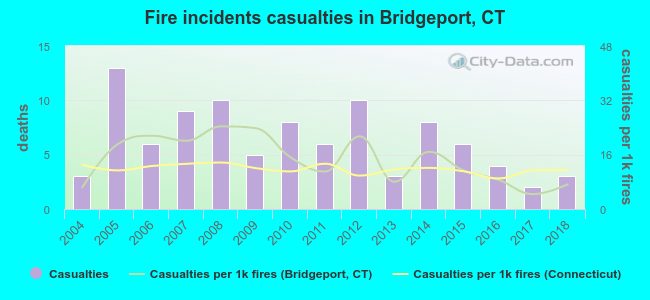 Based on the reports from the years 2004 - 2018 the average number of fire-related casualties per year is 6. The highest number of casualties - 13 took place in 2005, and the lowest - 2 in 2017. The data has a constant trend.
The average number of casualties per 1,000 fire incidents is 15. This indicator was the highest - 24 in 2008, and the lowest 4 in 2017. The trend for casualties per 1,000 incidents is growing. Compared to the Connecticut value the number of injuries per 1,000 incidents is about the same.
Based on the reports from the years 2004 - 2018 the average number of fire-related casualties per year is 6. The highest number of casualties - 13 took place in 2005, and the lowest - 2 in 2017. The data has a constant trend.
The average number of casualties per 1,000 fire incidents is 15. This indicator was the highest - 24 in 2008, and the lowest 4 in 2017. The trend for casualties per 1,000 incidents is growing. Compared to the Connecticut value the number of injuries per 1,000 incidents is about the same.
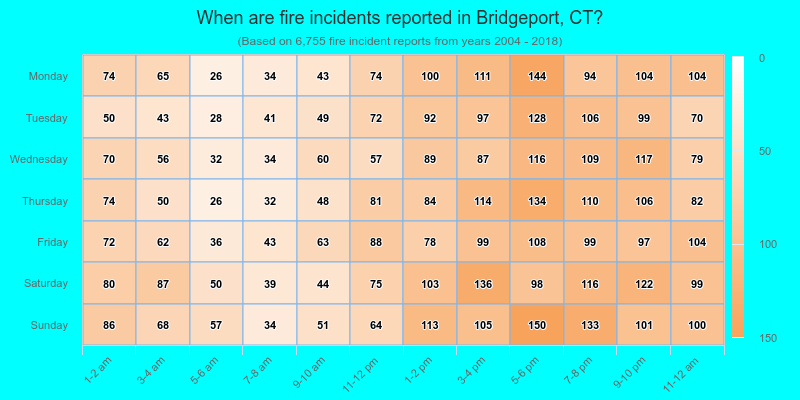
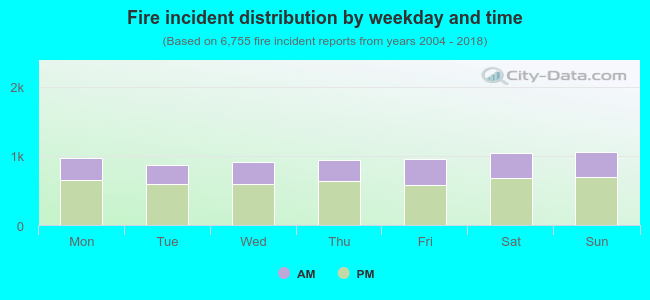 34.3% incidents where reported in the morning and 65.7% in the evening. The most fires (15.7%) took place on Sunday, and the least (13.0%) on Tuesday.
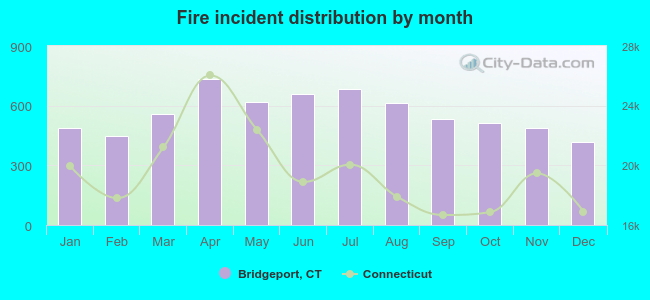 According to the 6,755 reports from years 2004 - 2018 most fires (10.8%) took place during April, and the least (6.2%) in December.
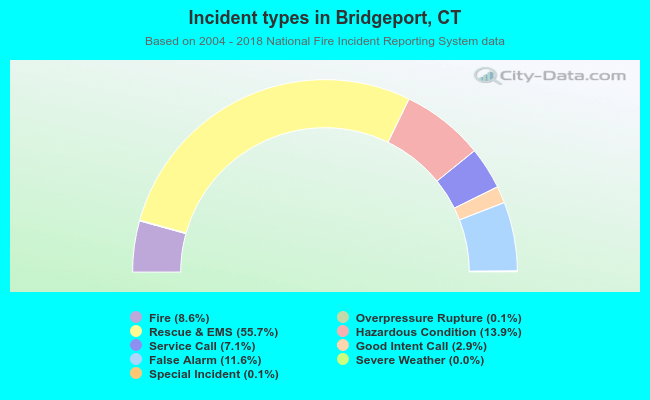 Out of all 78,815 cases reported during the years 2004 - 2018, the most belonged to the categories: Rescue & EMS (55.7%), Hazardous Condition (13.9%), and False Alarm (11.6%).
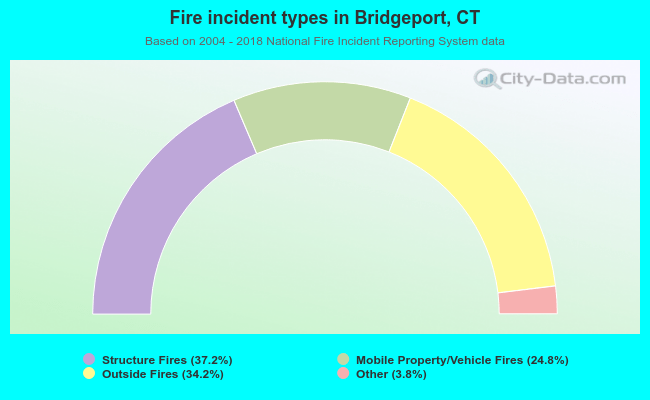 When looking into fire subcategories, the most reports belonged to: Structure Fires (37.2%), and Outside Fires (34.2%).