Bridgeport, Connecticut

Bridgeport: McLevy Hall, Bridgeports original city hall at night
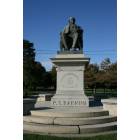
Bridgeport: P.T. Barnum in Seaside Park
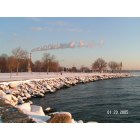
Bridgeport: Seaside Park in a chilli January morning

Bridgeport

Bridgeport: Seaside Park Lighthouse

Bridgeport: Bridgeport Lighthouse taken from St. Mary's by the sea
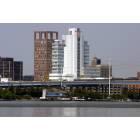
Bridgeport: downtown bridgeport
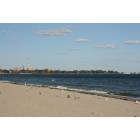
Bridgeport: Seaside Park
- add
your
Submit your own pictures of this city and show them to the world
- OSM Map
- General Map
- Google Map
- MSN Map
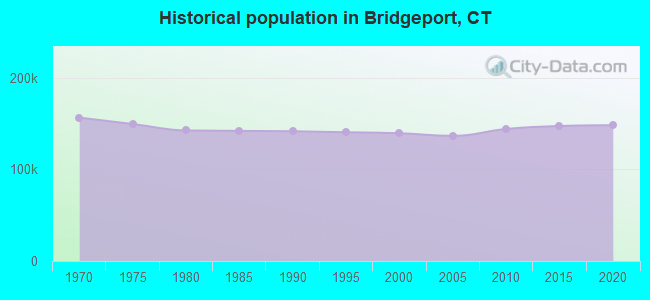
Population change since 2000: +6.3%
 |
| Males: 74,366 | |
| Females: 74,011 |
| Median resident age: | 38.0 years |
| Connecticut median age: | 40.9 years |
Zip codes: 06604, 06605, 06606, 06607, 06608, 06610, 06611.
Bridgeport Zip Code Map| Bridgeport: | $50,311 |
| CT: | $88,429 |
Estimated per capita income in 2022: $28,541 (it was $16,306 in 2000)
Bridgeport city income, earnings, and wages data
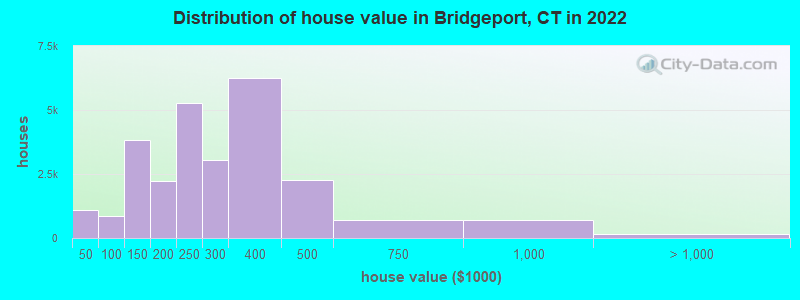
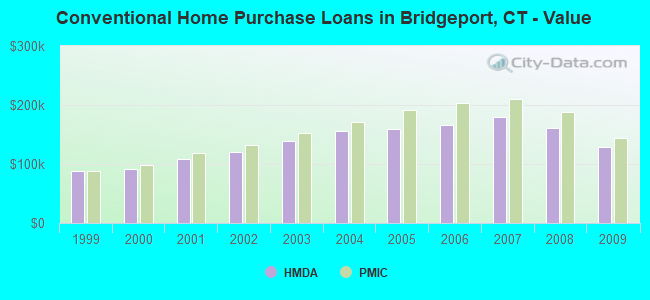
Estimated median house or condo value in 2022: $249,200 (it was $107,700 in 2000)
| Bridgeport: | $249,200 |
| CT: | $347,200 |
Mean prices in 2022: all housing units: $223,945; detached houses: $249,412; townhouses or other attached units: $164,488; in 2-unit structures: $240,586; in 3-to-4-unit structures: $264,198; in 5-or-more-unit structures: $114,271
Median gross rent in 2022: $1,458.
(17.5% for White Non-Hispanic residents, 23.2% for Black residents, 24.8% for Hispanic or Latino residents, 29.7% for American Indian residents, 27.9% for other race residents, 18.2% for two or more races residents)
Detailed information about poverty and poor residents in Bridgeport, CT


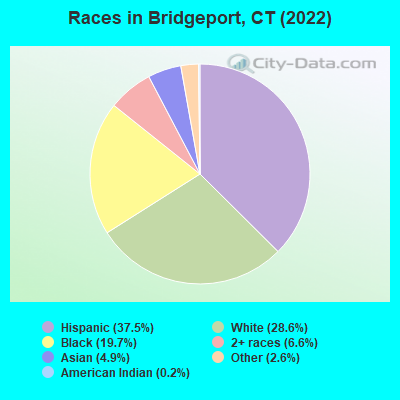
- 55,60637.5%Hispanic
- 42,36328.6%White alone
- 29,21819.7%Black alone
- 9,8326.6%Two or more races
- 7,1984.9%Asian alone
- 3,8782.6%Other race alone
- 2700.2%American Indian alone
Races in Bridgeport detailed stats: ancestries, foreign born residents, place of birth
According to our research of Connecticut and other state lists, there were 281 registered sex offenders living in Bridgeport, Connecticut as of April 27, 2024.
The ratio of all residents to sex offenders in Bridgeport is 519 to 1.
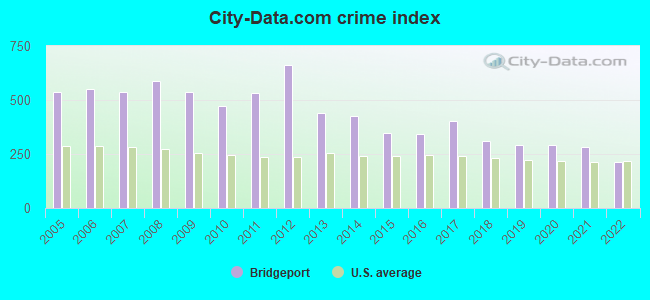
The City-Data.com crime index weighs serious crimes and violent crimes more heavily. Higher means more crime, U.S. average is 246.1. It adjusts for the number of visitors and daily workers commuting into cities.
- means the value is smaller than the state average.- means the value is about the same as the state average.
- means the value is bigger than the state average.
- means the value is much bigger than the state average.
Crime rate in Bridgeport detailed stats: murders, rapes, robberies, assaults, burglaries, thefts, arson
Full-time law enforcement employees in 2021, including police officers: 378 (330 officers - 281 male; 49 female).
| Officers per 1,000 residents here: | 2.30 |
| Connecticut average: | 2.10 |
 Recent articles from our blog. Our writers, many of them Ph.D. graduates or candidates, create easy-to-read articles on a wide variety of topics.

Latest news from Bridgeport, CT collected exclusively by city-data.com from local newspapers, TV, and radio stations
Bridgeport, CT City Guides:
Ancestries: Italian (5.7%), Jamaican (5.4%), Brazilian (5.1%), American (3.4%), Portuguese (2.6%), Irish (2.4%).
Current Local Time: EST time zone
Incorporated on 05/1836
Elevation: 25 feet
Land area: 16.0 square miles.
Population density: 9,274 people per square mile (high).
48,842 residents are foreign born (21.1% Latin America, 5.1% Asia, 3.9% Europe).
| This city: | 32.8% |
| Connecticut: | 15.0% |
Median real estate property taxes paid for housing units with mortgages in 2022: $6,305 (2.2%)
Median real estate property taxes paid for housing units with no mortgage in 2022: $4,798 (2.0%)
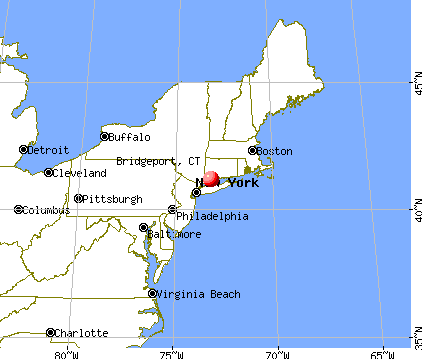
Nearest city with pop. 200,000+: North Hempstead, NY  (37.6 miles , pop. 222,611).
Nearest city with pop. 1,000,000+: Bronx, NY (42.5 miles , pop. 1,332,650).
Nearest cities:
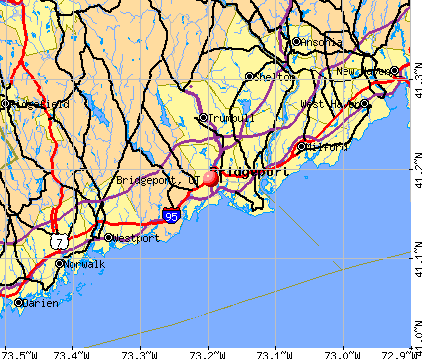
), ), Latitude: 41.19 N, Longitude: 73.20 W
Daytime population change due to commuting: -21,242 (-14.3%)
Workers who live and work in this city: 24,030 (36.3%)
Area code: 203

Detailed articles:
- Bridgeport: Introduction
- Bridgeport Basic Facts
- Bridgeport: Communications
- Bridgeport: Convention Facilities
- Bridgeport: Economy
- Bridgeport: Education and Research
- Bridgeport: Geography and Climate
- Bridgeport: Health Care
- Bridgeport: History
- Bridgeport: Municipal Government
- Bridgeport: Population Profile
- Bridgeport: Recreation
- Bridgeport: Transportation
Bridgeport, Connecticut accommodation & food services, waste management - Economy and Business Data
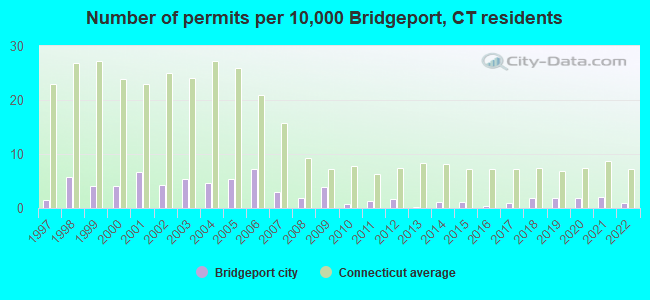
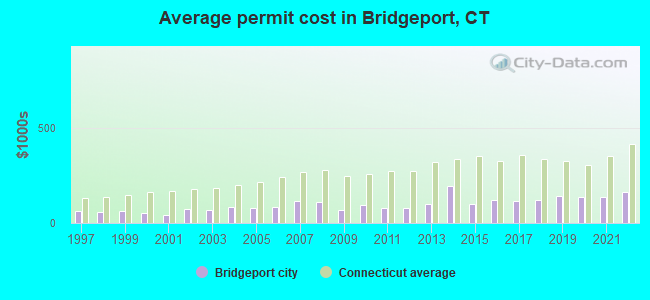
Single-family new house construction building permits:
- 2022: 14 buildings, average cost: $165,200
- 2021: 28 buildings, average cost: $139,300
- 2020: 25 buildings, average cost: $139,000
- 2019: 26 buildings, average cost: $140,000
- 2018: 25 buildings, average cost: $119,400
- 2017: 13 buildings, average cost: $115,700
- 2016: 4 buildings, average cost: $119,400
- 2015: 15 buildings, average cost: $102,400
- 2014: 15 buildings, average cost: $192,500
- 2013: 2 buildings, average cost: $100,300
- 2012: 22 buildings, average cost: $80,900
- 2011: 19 buildings, average cost: $79,000
- 2010: 11 buildings, average cost: $92,700
- 2009: 53 buildings, average cost: $69,000
- 2008: 26 buildings, average cost: $110,900
- 2007: 41 buildings, average cost: $117,300
- 2006: 100 buildings, average cost: $82,200
- 2005: 75 buildings, average cost: $81,300
- 2004: 65 buildings, average cost: $82,100
- 2003: 74 buildings, average cost: $70,700
- 2002: 60 buildings, average cost: $71,600
- 2001: 94 buildings, average cost: $42,400
- 2000: 56 buildings, average cost: $53,500
- 1999: 56 buildings, average cost: $60,700
- 1998: 79 buildings, average cost: $56,600
- 1997: 21 buildings, average cost: $63,100
| Here: | 4.0% |
| Connecticut: | 3.9% |
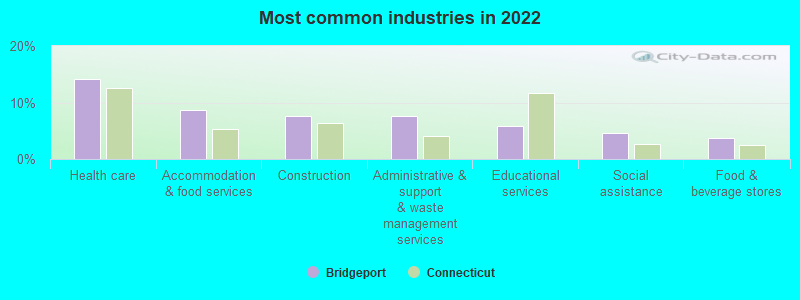
- Health care (14.1%)
- Accommodation & food services (8.7%)
- Construction (7.7%)
- Administrative & support & waste management services (7.6%)
- Educational services (5.8%)
- Social assistance (4.5%)
- Food & beverage stores (3.8%)
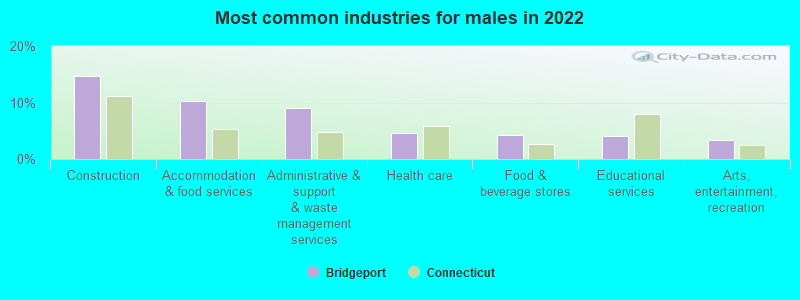
- Construction (14.6%)
- Accommodation & food services (10.2%)
- Administrative & support & waste management services (9.1%)
- Health care (4.6%)
- Food & beverage stores (4.3%)
- Educational services (4.1%)
- Arts, entertainment, recreation (3.3%)
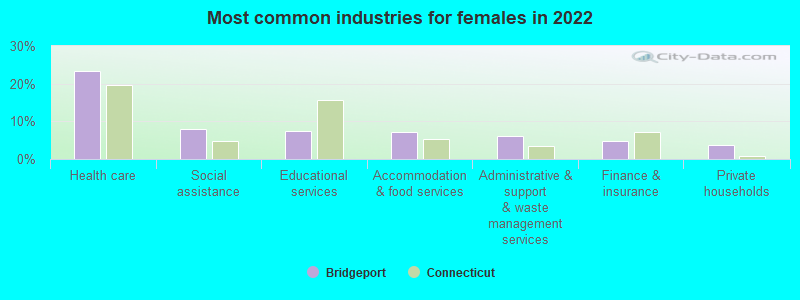
- Health care (23.5%)
- Social assistance (8.0%)
- Educational services (7.5%)
- Accommodation & food services (7.2%)
- Administrative & support & waste management services (6.2%)
- Finance & insurance (4.9%)
- Private households (3.8%)
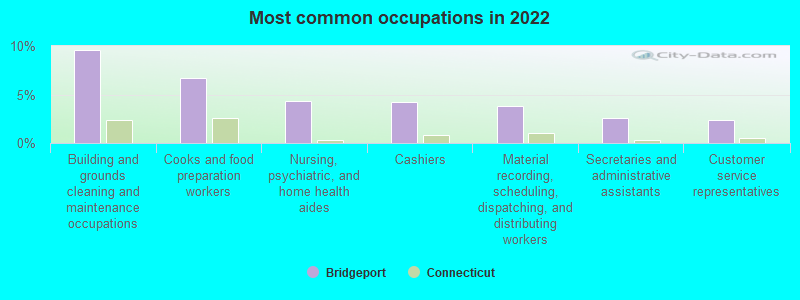
- Building and grounds cleaning and maintenance occupations (9.6%)
- Cooks and food preparation workers (6.7%)
- Nursing, psychiatric, and home health aides (4.3%)
- Cashiers (4.2%)
- Material recording, scheduling, dispatching, and distributing workers (3.8%)
- Secretaries and administrative assistants (2.5%)
- Customer service representatives (2.4%)
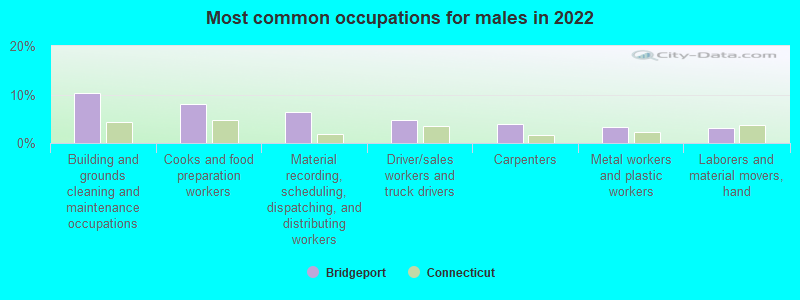
- Building and grounds cleaning and maintenance occupations (10.2%)
- Cooks and food preparation workers (8.0%)
- Material recording, scheduling, dispatching, and distributing workers (6.4%)
- Driver/sales workers and truck drivers (4.7%)
- Carpenters (4.0%)
- Metal workers and plastic workers (3.3%)
- Laborers and material movers, hand (3.0%)
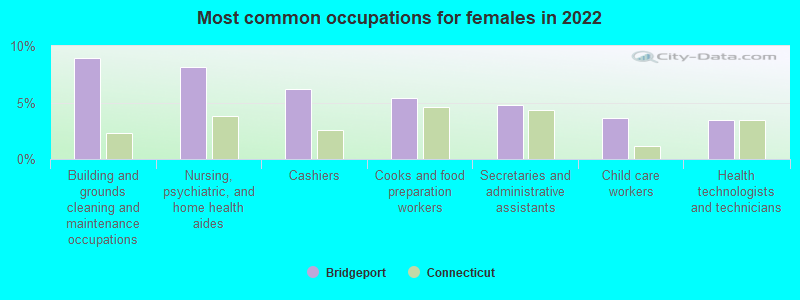
- Building and grounds cleaning and maintenance occupations (8.9%)
- Nursing, psychiatric, and home health aides (8.1%)
- Cashiers (6.2%)
- Cooks and food preparation workers (5.4%)
- Secretaries and administrative assistants (4.8%)
- Child care workers (3.6%)
- Health technologists and technicians (3.5%)
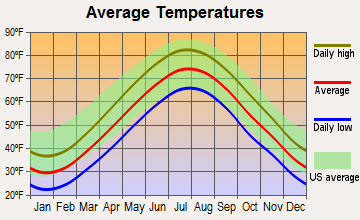
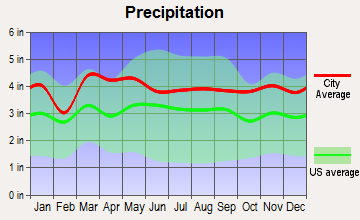
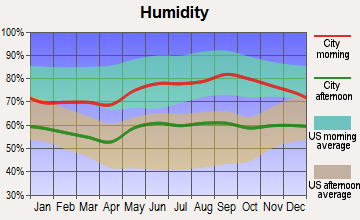
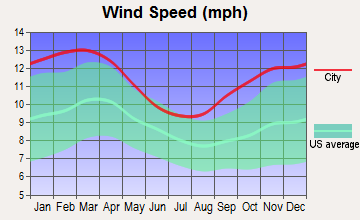
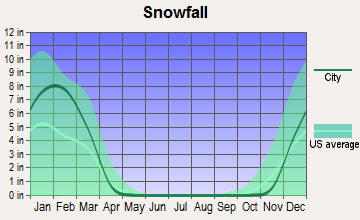
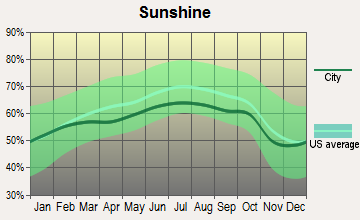
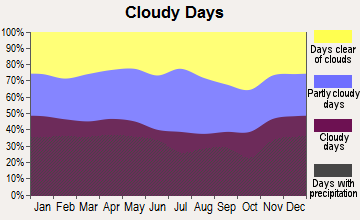
Average climate in Bridgeport, Connecticut
Based on data reported by over 4,000 weather stations
(lower is better)
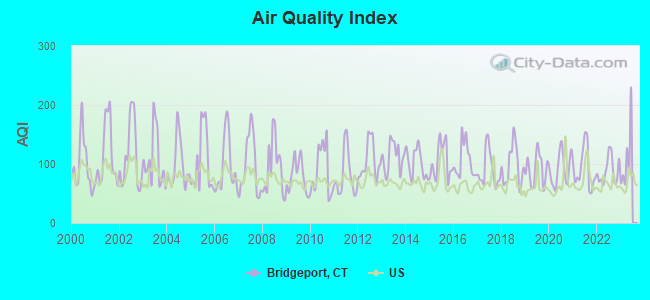
Air Quality Index (AQI) level in 2022 was 88.6. This is worse than average.
| City: | 88.6 |
| U.S.: | 72.6 |
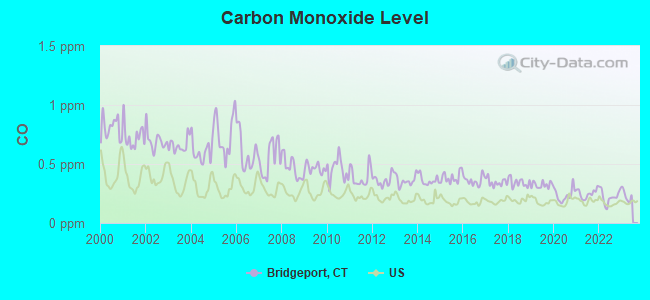
Carbon Monoxide (CO) [ppm] level in 2022 was 0.223. This is about average. Closest monitor was 0.9 miles away from the city center.
| City: | 0.223 |
| U.S.: | 0.251 |
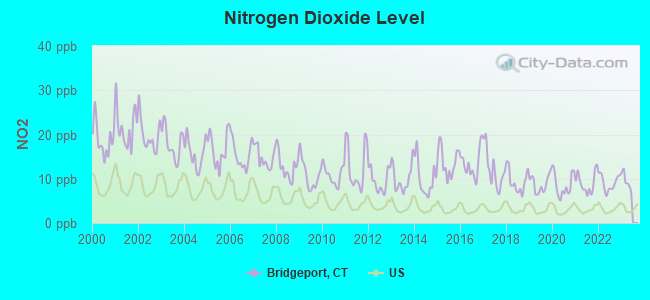
Nitrogen Dioxide (NO2) [ppb] level in 2022 was 9.08. This is significantly worse than average. Closest monitor was 0.6 miles away from the city center.
| City: | 9.08 |
| U.S.: | 5.11 |
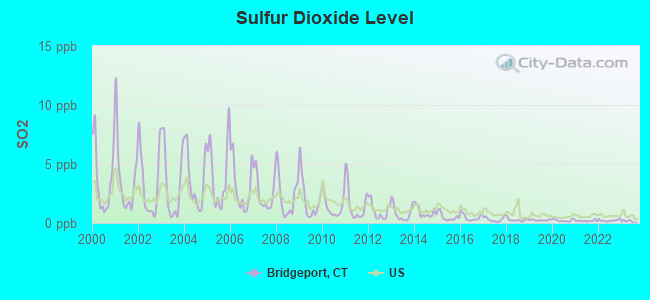
Sulfur Dioxide (SO2) [ppb] level in 2022 was 0.221. This is significantly better than average. Closest monitor was 0.6 miles away from the city center.
| City: | 0.221 |
| U.S.: | 1.515 |
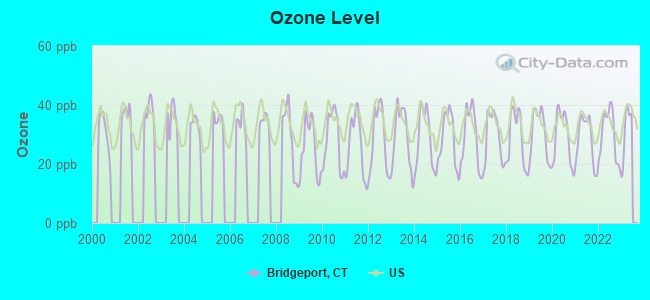
Ozone [ppb] level in 2022 was 30.0. This is about average. Closest monitor was 0.5 miles away from the city center.
| City: | 30.0 |
| U.S.: | 33.3 |
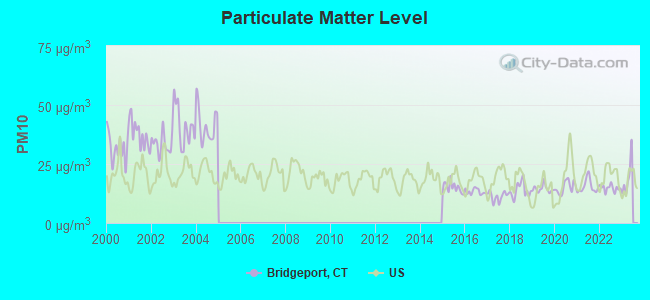
Particulate Matter (PM10) [µg/m3] level in 2022 was 14.8. This is better than average. Closest monitor was 0.5 miles away from the city center.
| City: | 14.8 |
| U.S.: | 19.2 |
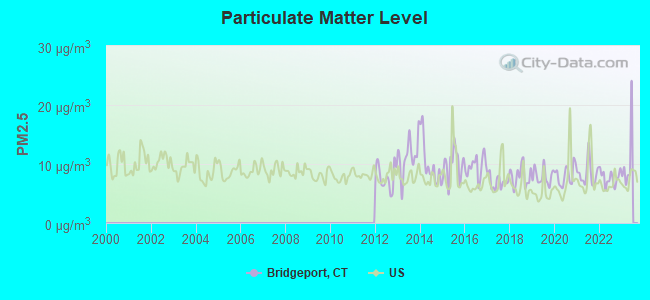
Particulate Matter (PM2.5) [µg/m3] level in 2022 was 7.66. This is about average. Closest monitor was 0.5 miles away from the city center.
| City: | 7.66 |
| U.S.: | 8.11 |
Tornado activity:
Bridgeport-area historical tornado activity is slightly below Connecticut state average. It is 41% smaller than the overall U.S. average.
On 7/10/1989, a category F4 (max. wind speeds 207-260 mph) tornado 17.0 miles away from the Bridgeport city center injured 40 people and caused between $50,000,000 and $500,000,000 in damages.
On 5/24/1962, a category F3 (max. wind speeds 158-206 mph) tornado 25.3 miles away from the city center killed one person and injured 50 people and caused between $500,000 and $5,000,000 in damages.
Earthquake activity:
Bridgeport-area historical earthquake activity is significantly above Connecticut state average. It is 70% smaller than the overall U.S. average.On 10/7/1983 at 10:18:46, a magnitude 5.3 (5.1 MB, 5.3 LG, 5.1 ML, Class: Moderate, Intensity: VI - VII) earthquake occurred 199.9 miles away from the city center
On 4/20/2002 at 10:50:47, a magnitude 5.3 (5.3 ML, Depth: 3.0 mi) earthquake occurred 231.3 miles away from Bridgeport center
On 8/23/2011 at 17:51:04, a magnitude 5.8 (5.8 MW, Depth: 3.7 mi) earthquake occurred 339.5 miles away from the city center
On 4/20/2002 at 10:50:47, a magnitude 5.2 (5.2 MB, 4.2 MS, 5.2 MW, 5.0 MW) earthquake occurred 229.7 miles away from the city center
On 1/19/1982 at 00:14:42, a magnitude 4.7 (4.5 MB, 4.7 MD, 4.5 LG, Class: Light, Intensity: IV - V) earthquake occurred 179.5 miles away from Bridgeport center
On 1/16/1994 at 01:49:16, a magnitude 4.6 (4.6 MB, 4.6 LG, Depth: 3.1 mi) earthquake occurred 160.2 miles away from the city center
Magnitude types: regional Lg-wave magnitude (LG), body-wave magnitude (MB), duration magnitude (MD), local magnitude (ML), surface-wave magnitude (MS), moment magnitude (MW)
Natural disasters:
The number of natural disasters in Fairfield County (24) is greater than the US average (15).Major Disasters (Presidential) Declared: 13
Emergencies Declared: 11
Causes of natural disasters: Storms: 6, Floods: 5, Hurricanes: 5, Snowstorms: 4, Blizzards: 3, Snows: 3, Winter Storms: 3, Tropical Storms: 2, Snowfall: 1, Wind: 1 (Note: some incidents may be assigned to more than one category).

Hospitals in Bridgeport:
- BRIDGEPORT HOSPITAL (Voluntary non-profit - Private, provides emergency services, 267 GRANT STREET)
- SOUTHWEST CONNECTICUT MENTAL HEALTH (1635 CENTRAL AVE)
- ST VINCENT'S MEDICAL CENTER (Voluntary non-profit - Church, 2800 MAIN ST)
Nursing Homes in Bridgeport:
- ASTORIA PARK (725 PARK AVE)
- BRIDGEPORT HEALTH CARE CENTER (600 BOND STREET)
- BRIDGEPORT MANOR (540 BOND STREET)
- DINAN MEMORIAL CENTER-TEDESCO ANNEX (600 BOND ST)
- DINAN MEMORIAL CTR (BOND STREET EXTENSION)
- NORTHBRIDGE HEALTH CARE CENTER (2875 MAIN STREET)
- RONCALLI HEALTH CENTER, INC, ICF (425 GRANT STREET)
- SPRINGS AT WATERMARK 3030 PARK, THE (3030 PARK AVENUE)
Dialysis Facilities in Bridgeport:
Home Health Centers in Bridgeport:
Airports and heliports located in Bridgeport:
- Igor I Sikorsky Memorial Airport (BDR) (Runways: 3, Air Taxi Ops: 2,309, Itinerant Ops: 31,189, Local Ops: 33,829, Military Ops: 624)
- Bridgeport Hospital Heliport (0CT7)
- Medical Center Heliport (CT12)
- Sikorsky Bridgeport Heliport (CT37)
Colleges/Universities in Bridgeport:
- University of Bridgeport (Full-time enrollment: 3,708; Location: 126 Park Avenue; Private, not-for-profit; Website: www.bridgeport.edu; Offers Doctor's degree)
- Housatonic Community College (Full-time enrollment: 3,677; Location: 900 Lafayette Blvd; Public; Website: www.hcc.commnet.edu)
- St Vincent's College (Full-time enrollment: 530; Location: 2800 Main St; Private, not-for-profit; Website: www.stvincentscollege.edu)
- New England Tractor Trailer Training School of CT-Bridgeport (Full-time enrollment: 365; Location: 510 Barnum Ave; Private, for-profit; Website: www.nettts.com)
- Bridgeport Hospital School of Nursing (Full-time enrollment: 141; Location: 200 Mill Hill Ave; Private, not-for-profit; Website: www.bridgeporthospital.org/bhsn/)
- The Leon Institute of Hair Design (Full-time enrollment: 24; Location: 111 Wall St; Private, for-profit)
- Bullard-Havens Technical High School (Full-time enrollment: 14; Location: 500 Palisade Avenue; Public; Website: www.cttech.org/bullard-havens/index.htm)
Other colleges/universities with over 2000 students near Bridgeport:
- Porter and Chester Institute of Stratford (about 3 miles; Stratford, CT; Full-time enrollment: 2,822)
- Sacred Heart University (about 4 miles; Fairfield, CT; FT enrollment: 5,650)
- Fairfield University (about 4 miles; Fairfield, CT; FT enrollment: 4,640)
- University of New Haven (about 15 miles; West Haven, CT; FT enrollment: 6,205)
- Norwalk Community College (about 15 miles; Norwalk, CT; FT enrollment: 4,085)
- Gateway Community College (about 17 miles; New Haven, CT; FT enrollment: 4,672)
- Southern Connecticut State University (about 17 miles; New Haven, CT; FT enrollment: 8,708)
Biggest public high schools in Bridgeport:
- CENTRAL HIGH SCHOOL (Students: 1,808, Location: ONE LINCOLN BOULEVARD, Grades: 9-12)
- HARDING HIGH SCHOOL (Students: 1,324, Location: 1734 CENTRAL AVENUE, Grades: 9-12)
- BASSICK HIGH SCHOOL (Students: 1,001, Location: 1181 FAIRFIELD AVENUE, Grades: 9-12)
- BULLARD-HAVENS TECHNICAL HIGH SCHOOL (Students: 888, Location: 500 PALISADE AVENUE, Grades: 9-12)
- THE BRIDGE ACADEMY (Students: 186, Location: 401 KOSSUTH STREET, Grades: 7-12, Charter school)
- BRIDGEPORT LEARNING CENTER (Students: 30, Location: 280 TESINY AVENUE, Grades: 1-12)
- BRIDGEPORT CORRECTIONAL CENTER (Students: 20, Location: 1106 NORTH AVENUE, Grades: 10-12)
- GREATER BRIDGEPORT COMMUNITY MENTAL HEALTH CENTER (Location: 1635 CENTRAL AVENUE, Grades: 12)
- ACHIEVEMENT FIRST BRIDGEPORT ACADEMY (Location: 655 STILLMAN STREET, Grades: KG-12, Charter school)
- BRIDGEPORT MILITARY ACADEMY (Location: 840 OLD TOWN ROAD, Grades: 9-10)
Private high schools in Bridgeport:
- KOLBE CATHEDRAL HIGH SCHOOL (Students: 325, Location: 33 CALHOUN PL, Grades: 9-12)
- BRIDGEPORT INTERNATIONAL ACADEMY (Students: 75, Location: 285 LAFAYETTE ST STE 200, Grades: 9-12)
- COPE SCHOOL (Students: 9, Location: 425 GRANT ST, Grades: 8-12)
Biggest public elementary/middle schools in Bridgeport:
- BLACKHAM SCHOOL (Students: 1,182, Location: 425 THORME STREET, Grades: PK-8)
- ROOSEVELT SCHOOL (Students: 1,056, Location: 680 PARK AVENUE, Grades: PK-8)
- READ SCHOOL (Students: 970, Location: 130 EZRA STREET, Grades: PK-8)
- LUIS MUNOZ MARIN SCHOOL (Students: 923, Location: 479 HELEN STREET, Grades: PK-8)
- COLUMBUS SCHOOL (Students: 916, Location: 275 GEORGE STREET, Grades: PK-8)
- CURIALE SCHOOL (Students: 888, Location: 300 LAUREL AVENUE, Grades: KG-8)
- WINTHROP SCHOOL (Students: 740, Location: 85 ECKART STREET, Grades: KG-8)
- MADISON SCHOOL (Students: 718, Location: 376 WAYNE STREET, Grades: KG-6)
- BEARDSLEY SCHOOL (Students: 661, Location: 500 HUNTINGTON ROAD, Grades: PK-6)
- WALTERSVILLE SCHOOL (Students: 583, Location: 95 GILMORE STREET, Grades: PK-8)
Private elementary/middle schools in Bridgeport:
- ST ANDREW SCHOOL (Students: 261, Location: 395 ANTON ST, Grades: PK-8)
- ST ANN SCHOOL (Students: 247, Location: 521 BREWSTER ST, Grades: PK-8)
- ST AUGUSTINE CATHEDRAL SCHOOL (Students: 237, Location: 63 PEQUONNOCK ST, Grades: PK-8)
- ST RAPHAEL ELEMENTARY SCHOOL (Students: 206, Location: 324 FRANK ST, Grades: PK-8)
- ST AMBROSE SCHOOL (Students: 204, Location: 461 MILL HILL AVE, Grades: PK-8)
- ST PETER SCHOOL (Students: 182, Location: 659 BEECHWOOD AVE, Grades: KG-8)
- LOVE CHRISTIAN ACADEMY (Students: 74, Location: 729 UNION AVE, Grades: KG-8)
- FAIRFIELD COUNTY SDA SCHOOL (Students: 58, Location: 827 TRUMBULL AVE, Grades: KG-8)
- BRIDGEPORT HOPE SCHOOL (Students: 53, Location: 283 LAFAYETTE ST, Grades: KG-8)
Points of interest:
Notable locations in Bridgeport: East End Freight Yards (A), Black Rock Yacht Club (B), Mather Dock (C), Marina Village (D), East End Yacht Club (E), Captains Cove Seaport (F), Burr Creek Marina (G), Hill Side Home (H), Bridgeport Station (I), Bridgeport and Port Jefferson Ferry (J), Boston Industrial Park (K), Berkshire Mills (L), Algonquin Club (M), Jewish Community Center Library (N), Housatonic Museum of Art (O), Fairfield County Jail (P), Fairfield County Court House (Q), Daniel T Banks Health Science Library (R), Court Marina (S), Connecticut Judicial Branch Law Library (T). Display/hide their locations on the map
Shopping Centers: Stratford Square Shopping Center (1), Shoppers Plaza Shopping Center (2), Lafayette Shopping Plaza Shopping Center (3), Hi-Ho Center Shopping Mall Shopping Center (4), Grand Central Shopping Center (5), Crossway Mall Shopping Center (6), Brookside Shopping Center (7), Bayview Shopping Center (8), Baldwin Plaza Shopping Center (9). Display/hide their locations on the map
Churches in Bridgeport include: Holy Trinity Church (A), Bethel Memorial Deliverance Church (B), Bridgeport Islamic Society (C), Brooklawn Seventh Day Adventist Church (D), Calvary Episcopal Church (E), Centro Christiano Church (F), Church of God (G), Church of God of Prophecy (H), Church of God New Life (I). Display/hide their locations on the map
Cemeteries: Old Stratfield Cemetery (1), Park Cemetery (2), Saint Augustine Cemetery (3), Mount Grove Cemetery (4), Lakeview Cemetery (5). Display/hide their locations on the map
Lakes and reservoirs: Stillman Pond (A), Success Lake (B), Chamberland Pond (C), Island Brook Lagoon (D), Seeleys Pond (E), Bruce Pond (F), Bunnells Pond (G), Lake Forest (H). Display/hide their locations on the map
Streams, rivers, and creeks: White Rock Creek (A), Pequonnock River (B), Island Brook (C), Johnsons Creek (D). Display/hide their locations on the map
Parks in Bridgeport include: West Side Park (1), Beardsley Park (2), Tunxis Hill Park (3), Svihra Park (4), Clinton Park (5), Ninety Acres Park (6), Old Mill Green (7), Barnum-Palliser Historic District (8), Bassickville Historic District (9). Display/hide their locations on the map
Beaches: Money Beach (A), Seaside Beach (B). Display/hide their locations on the map
Tourist attractions: Barnum Museum (820 Main Street), Discovery Museum (4450 Park Avenue), What's Your Game (Amusement & Theme Parks; 140 North Avenue), Downtown Cabaret Theatre - Box Office (Amusement & Theme Parks; 263 Golden Hill Street Suite 2), Cappy & Son and Daughter (Amusement & Theme Parks; 3295 Fairfield Avenue), Sheena Tours (Tours & Charters; 42 Joseph Street), Leisure Tours International (Tours & Charters; 107 Fairview Avenue), Dattco (Tours & Charters; 25 Radel Street).
Hotels: Holiday Inn (1070 Main Street), Holiday Inn Bridgeport (1070 Main Street), Arcade Hotel (1001 Main Street).
Courts: Connecticut State - Fairfield Judicial District- Judicial Branch- Superior Court Housing- Bridge (1127 Main Street), Connecticut State - Judicial Branch- Superior Court- Fairfield Judicial District- She (1061 Main Street), Connecticut State - Detention Center & After Hours- Judicial Branch- Superior Court Hou (790 Fairfield Avenue), Bankruptcy Court (915 Lafayette Boulevard), Connecticut State - Judicial Branch- Superior Court Housing- Fairfield Judicial District- Crim (1061 Main), Beacon Court (36 Beacon Court), Bridgeport City - Probate Court (202 State Street), United States Government - Courts Us- Us District Court- Clerk's Of (915 Lafayette Boulevard).
Birthplace of: Julie Chu - Ice hockey player, Syesha Mercado - Singer, Robert Mitchum - (1917-1997), actor, Larry Kramer - Screenwriter, Joseph C. Wilson - Ambassador, Jesse Richards - Artist, Billy Lush (baseball) - Baseball player and coach, Daniel Quirk - Professional wrestler, Rich Whitney - Lawyer, Eric Von Schmidt - Musician.
Drinking water stations with addresses in Bridgeport and their reported violations in the past:
AQUARION WATER CO OF CT-GREENWICH SYSTEM (Population served: 52,959, Surface water):Past monitoring violations:AQUARION WATER CO OF CT-VALLEY SYSTEM (Population served: 14,815, Purch surface water):
- Monitoring and Reporting (DBP) - In SEP-2013, Contaminant: Chlorite
- Single Turbidity Exceed (Enhanced SWTR) - In JUN-2009, Contaminant: IESWTR. Follow-up actions: St Public Notif requested (JUL-22-2009), St Violation/Reminder Notice (JUL-22-2009), St Compliance achieved (JUL-31-2009), St Public Notif received (AUG-10-2009)
Past monitoring violations:AQUARION WATER CO OF CT-NEW MILFORD (Population served: 9,841, Groundwater):
- 6 regular monitoring violations
Past monitoring violations:AQUARION WATER CO OF CT-CHIMNEY HEIGHTS (Population served: 1,980, Groundwater):
- 49 regular monitoring violations
Past monitoring violations:AQUARION WATER CO OF CT-WOODBURY SYSTEM (Population served: 1,642, Groundwater):
- One minor monitoring violation
Past monitoring violations:AQUARION WATER CO OF CT-BROOKFIELD SYS (Population served: 1,481, Groundwater):
- Monitoring and Reporting (DBP) - Between JUL-2005 and SEP-2005, Contaminant: Chlorine. Follow-up actions: St Violation/Reminder Notice (JAN-04-2006), St Compliance achieved (APR-27-2006)
- One minor monitoring violation
- 2 regular monitoring violations
Past monitoring violations:AQUARION WATER CO OF CT-WESTERN BROOKFLD (Population served: 1,123, Groundwater):
- Monitoring and Reporting (DBP) - Between OCT-2006 and DEC-2006, Contaminant: Chlorine. Follow-up actions: St Violation/Reminder Notice (FEB-16-2007), St Compliance achieved (MAR-20-2007)
Past health violations:AQUARION WATER CO OF CT-RIDGEFIELD KNOLL (Population served: 967, Groundwater):Past monitoring violations:
- MCL, Average - Between JAN-2007 and MAR-2007, Contaminant: Combined Uranium. Follow-up actions: St Compliance achieved (JUN-30-2007), St Public Notif requested (AUG-28-2007), St Violation/Reminder Notice (AUG-28-2007), St Public Notif received (SEP-18-2007)
- MCL, Average - Between OCT-2006 and DEC-2006, Contaminant: Combined Uranium. Follow-up actions: St Public Notif requested (APR-24-2007), St Violation/Reminder Notice (APR-24-2007), St Public Notif received (JUN-01-2007), St Compliance achieved (JUN-30-2007)
- MCL, Monthly (TCR) - In OCT-2005, Contaminant: Coliform. Follow-up actions: St Public Notif received (OCT-20-2005), St Public Notif requested (NOV-08-2005), St Violation/Reminder Notice (NOV-08-2005), St Compliance achieved (JUN-30-2006)
- MCL, Acute (TCR) - In OCT-2005, Contaminant: Coliform. Follow-up actions: St Public Notif received (OCT-20-2005), St Public Notif requested (NOV-08-2005), St Violation/Reminder Notice (NOV-08-2005), St Compliance achieved (JUN-30-2006)
- Monitoring and Reporting (DBP) - Between APR-2012 and JUN-2012, Contaminant: Chlorine. Follow-up actions: St Violation/Reminder Notice (SEP-10-2012), St Compliance achieved (SEP-27-2012)
- Monitoring and Reporting (DBP) - Between JAN-2011 and DEC-2011, Contaminant: Total Haloacetic Acids (HAA5). Follow-up actions: St Compliance achieved (MAR-07-2012), St Violation/Reminder Notice (MAR-07-2012)
- Monitoring and Reporting (DBP) - Between JAN-2011 and DEC-2011, Contaminant: TTHM. Follow-up actions: St Compliance achieved (MAR-07-2012), St Violation/Reminder Notice (MAR-07-2012)
- 20 regular monitoring violations
Past health violations:Past monitoring violations:
- OCCT/SOWT Study/Recommendation - In JUL-01-2008, Contaminant: Lead and Copper Rule. Follow-up actions: St Violation/Reminder Notice (JAN-08-2009), St Compliance achieved (JAN-23-2009)
- Public Education - In MAR-01-2008, Contaminant: Lead and Copper Rule. Follow-up actions: St Compliance achieved (JAN-12-2009)
- Water Quality Parameter M/R - Between JAN-2007 and DEC-2007, Contaminant: Lead and Copper Rule. Follow-up actions: St Public Notif requested (MAR-17-2009), St Violation/Reminder Notice (MAR-17-2009), St Public Notif received (APR-24-2009)
- One routine major monitoring violation
Drinking water stations with addresses in Bridgeport that have no violations reported:
- AQUARION WATER CO OF CT-MAIN SYSTEM (Population served: 341,421, Primary Water Source Type: Surface water)
- AQUARION WATER CO OF CT-STAMFORD (Population served: 98,976, Primary Water Source Type: Surface water)
- AQUARION WATER CO OF CT-NOROTON SYSTEM (Population served: 17,675, Primary Water Source Type: Purch surface water)
- AQUARION WATER CO OF CT-SIMSBURY SYSTEM (Population served: 12,566, Primary Water Source Type: Groundwater)
- AQUARION WATER CO OF CT-MYSTIC (Population served: 11,520, Primary Water Source Type: Surface water)
- AQUARION WATER CO OF CT-NEW CANAAN SYS (Population served: 8,874, Primary Water Source Type: Purch surface water)
- AQUARION WATER CO OF CT-RIDGEFIELD SYS (Population served: 7,902, Primary Water Source Type: Purch surface water)
- AQUARION WATER CO OF CT-NEWTOWN SYSTEM (Population served: 3,927, Primary Water Source Type: Groundwater)
- AQUARION WATER CO OF CT-LITCHFIELD SYS (Population served: 2,619, Primary Water Source Type: Purch surface water)
- AQUARION WATER CO OF CT-SALISBURY SYS (Population served: 2,507, Primary Water Source Type: Surface water)
| This city: | 2.7 people |
| Connecticut: | 2.5 people |
| This city: | 63.6% |
| Whole state: | 66.3% |
| This city: | 8.7% |
| Whole state: | 6.6% |
Likely homosexual households (counted as self-reported same-sex unmarried-partner households)
- Lesbian couples: 0.3% of all households
- Gay men: 0.3% of all households
People in group quarters in Bridgeport in 2010:
- 1,722 people in college/university student housing
- 910 people in state prisons
- 759 people in nursing facilities/skilled-nursing facilities
- 650 people in other noninstitutional facilities
- 235 people in emergency and transitional shelters (with sleeping facilities) for people experiencing homelessness
- 205 people in correctional residential facilities
- 159 people in group homes intended for adults
- 80 people in residential treatment centers for adults
- 48 people in mental (psychiatric) hospitals and psychiatric units in other hospitals
- 36 people in group homes for juveniles (non-correctional)
- 32 people in workers' group living quarters and job corps centers
- 2 people in in-patient hospice facilities
People in group quarters in Bridgeport in 2000:
- 1,218 people in college dormitories (includes college quarters off campus)
- 942 people in nursing homes
- 796 people in local jails and other confinement facilities (including police lockups)
- 308 people in other noninstitutional group quarters
- 84 people in halfway houses
- 65 people in mental (psychiatric) hospitals or wards
- 54 people in homes for the mentally retarded
- 47 people in job corps and vocational training facilities
- 43 people in homes or halfway houses for drug/alcohol abuse
- 32 people in wards in general hospitals for patients who have no usual home elsewhere
- 6 people in religious group quarters
Banks with branches in Bridgeport (2011 data):
- People's United Bank: 9 branches. Info updated 2012/02/16: Bank assets: $27,319.3 mil, Deposits: $20,835.4 mil, local headquarters, positive income, Commercial Lending Specialization, 374 total offices
- Bank of America, National Association: Main Street / Commerce Park Branch, North End Branch, Newfield Branch, Boston Avenue Branch, Bridgeport Center Branch, East Main Street Branch. Info updated 2009/11/18: Bank assets: $1,451,969.3 mil, Deposits: $1,077,176.8 mil, headquarters in Charlotte, NC, positive income, 5782 total offices, Holding Company: Bank Of America Corporation
- JPMorgan Chase Bank, National Association: Boston Avenue Branch, Bridgeport Financial Center Branch, Trumbull Center Banking Center, North End Branch, West Side (Bridgeport) Branch. Info updated 2011/11/10: Bank assets: $1,811,678.0 mil, Deposits: $1,190,738.0 mil, headquarters in Columbus, OH, positive income, International Specialization, 5577 total offices, Holding Company: Jpmorgan Chase & Co.
- TD Bank, National Association: Barnum Avenue Branch, 1000 Lafayette Boulevard Branch, Old Town Road Branch, North End Branch. Info updated 2010/10/04: Bank assets: $188,912.6 mil, Deposits: $153,149.8 mil, headquarters in Wilmington, DE, positive income, 1314 total offices, Holding Company: Toronto-Dominion Bank, The
- Citibank, National Association: Bridgeport Branch at 4551 Main Street, branch established on 2007/11/13; Downtown Bridgeport at 939 Main Street, branch established on 2008/02/19. Info updated 2012/01/10: Bank assets: $1,288,658.0 mil, Deposits: $882,541.0 mil, headquarters in Sioux Falls, SD, positive income, International Specialization, 1048 total offices, Holding Company: Citigroup Inc.
- The Community's Bank: at 1087 Broad St, branch established on 2001/02/23; Beardsley Park Branch at 2574 East Main Street, branch established on 1973/06/02. Info updated 2011/07/27: Bank assets: $36.3 mil, Deposits: $29.4 mil, local headquarters, negative income in the last year, Commercial Lending Specialization, 2 total offices, Holding Company: Urban Financial Group, Inc.
- Webster Bank, National Association: Bridgeport Branch at 3546 Main Street, branch established on 2005/01/10. Info updated 2008/12/23: Bank assets: $18,674.3 mil, Deposits: $13,861.5 mil, headquarters in Waterbury, CT, positive income, Commercial Lending Specialization, 167 total offices, Holding Company: Webster Financial Corporation
- Fairfield County Bank: Bridgeport Branch at 1089 Madison Avenue, branch established on 2007/11/09. Info updated 2012/01/12: Bank assets: $1,441.4 mil, Deposits: $1,172.5 mil, headquarters in Ridgefield, CT, positive income, Commercial Lending Specialization, 22 total offices
For population 15 years and over in Bridgeport:
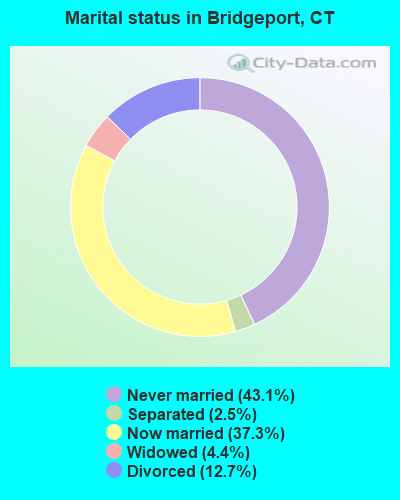
- Never married: 43.1%
- Now married: 37.3%
- Separated: 2.5%
- Widowed: 4.4%
- Divorced: 12.7%
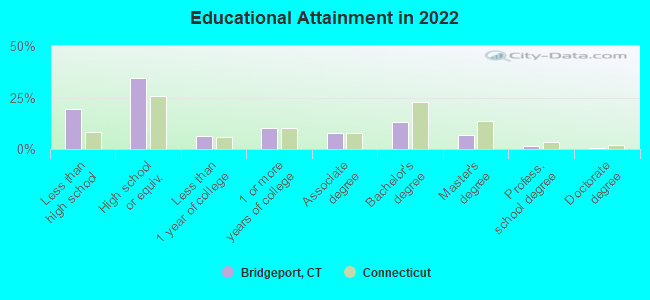
For population 25 years and over in Bridgeport:
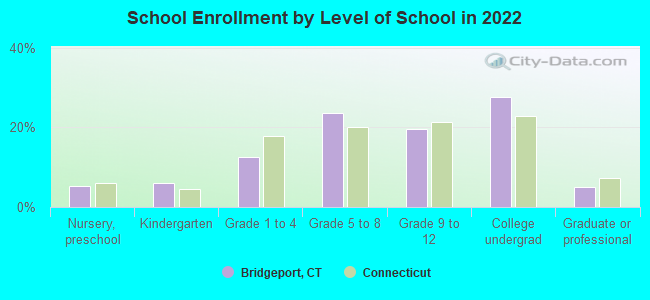
- High school or higher: 80.4%
- Bachelor's degree or higher: 21.9%
- Graduate or professional degree: 8.9%
- Unemployed: 10.5%
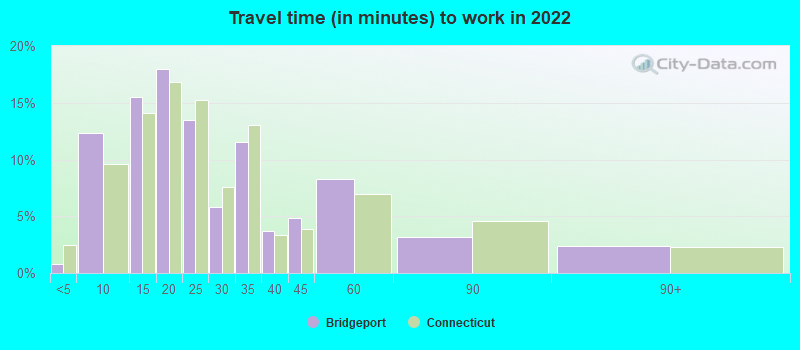
- Mean travel time to work (commute): 25.9 minutes
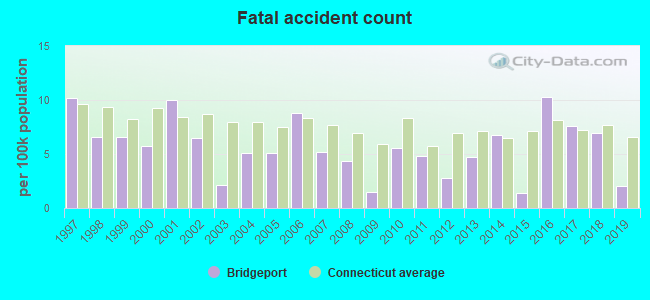
| Here: | 15.5 |
| Connecticut average: | 12.6 |
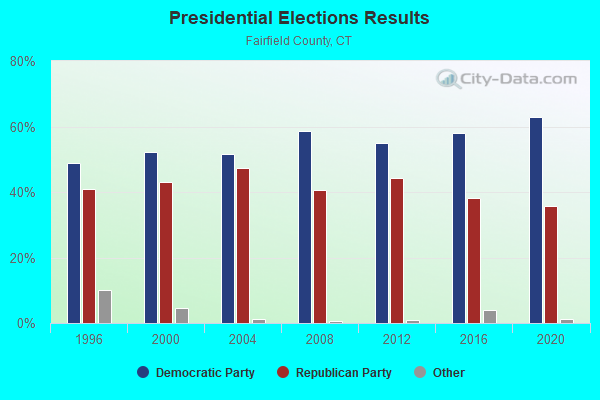
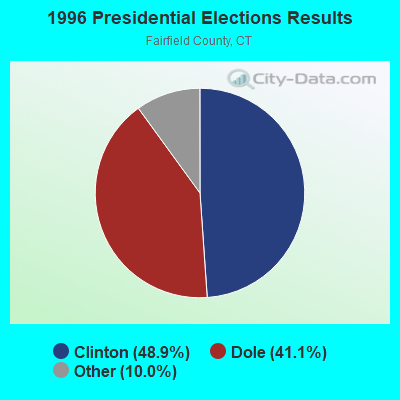
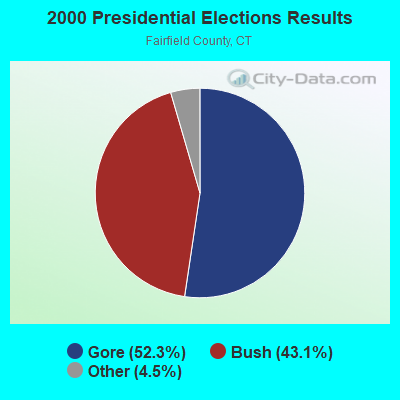
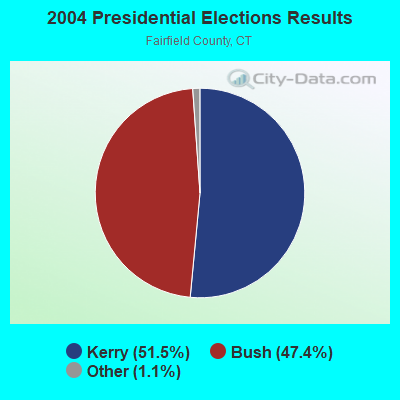
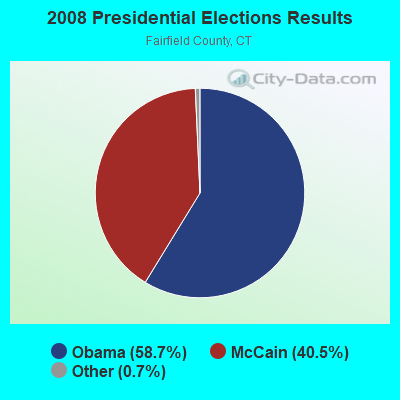
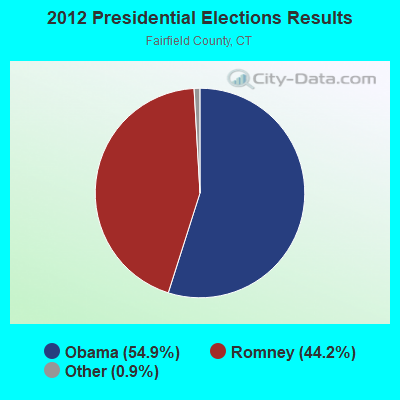
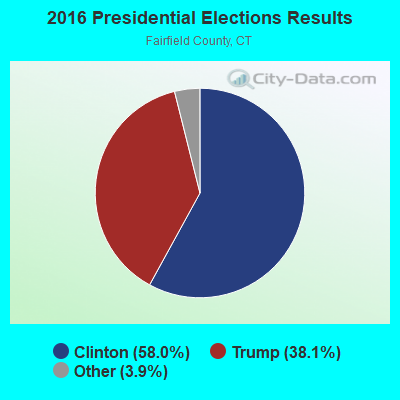
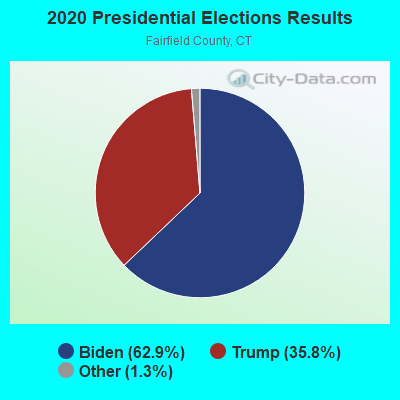
Graphs represent county-level data. Detailed 2008 Election Results
Neighborhoods in Bridgeport:
(Bridgeport, Connecticut Neighborhood Map)- Black Rock neighborhood
- Boston Avenue (Success Park) neighborhood
- Brooklawn neighborhood
- Central Business District neighborhood
- Downtown Bridgeport (Downtown) neighborhood
- East End neighborhood
- East Side neighborhood
- Enterprise Zone neighborhood
- Hollow neighborhood
- Lake Forest neighborhood
- Lake Success neighborhood
- Lower East End neighborhood
- Lower East Side neighborhood
- Madison neighborhood
- Mill Hill neighborhood
- Noble neighborhood
- North Bridgeport neighborhood
- North End neighborhood
- Reservoir neighborhood
- South End neighborhood
- St. Vincent neighborhood
- Steel Point neighborhood
- Upper East Side neighborhood
- Upper Madison neighborhood
- Washington Park neighborhood
- West End (West Side) neighborhood
- Whiskey Hill neighborhood
Religion statistics for Bridgeport, CT (based on Fairfield County data)
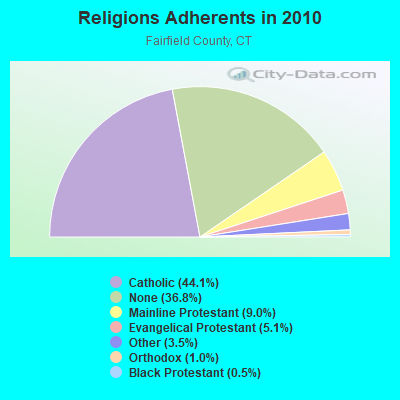
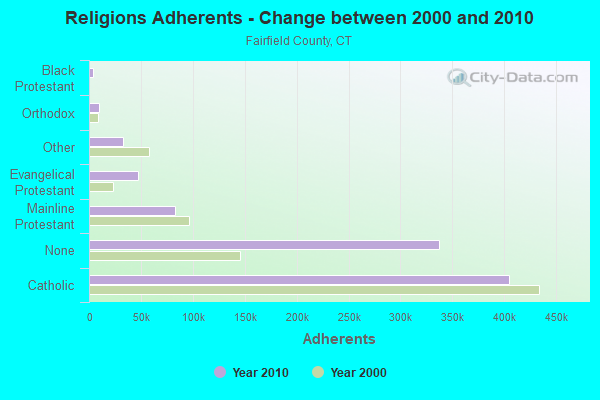
| Religion | Adherents | Congregations |
|---|---|---|
| Catholic | 404,341 | 94 |
| Mainline Protestant | 82,604 | 175 |
| Evangelical Protestant | 46,888 | 242 |
| Other | 32,501 | 95 |
| Orthodox | 9,215 | 21 |
| Black Protestant | 4,144 | 27 |
| None | 337,136 | - |
Food Environment Statistics:
| Fairfield County: | 2.50 / 10,000 pop. |
| Connecticut: | 2.21 / 10,000 pop. |
| This county: | 0.06 / 10,000 pop. |
| State: | 0.07 / 10,000 pop. |
| Fairfield County: | 0.85 / 10,000 pop. |
| Connecticut: | 1.02 / 10,000 pop. |
| Fairfield County: | 1.70 / 10,000 pop. |
| State: | 2.27 / 10,000 pop. |
| Here: | 9.67 / 10,000 pop. |
| State: | 9.19 / 10,000 pop. |
| This county: | 6.5% |
| Connecticut: | 7.3% |
| Fairfield County: | 17.9% |
| Connecticut: | 21.5% |
| This county: | 17.2% |
| State: | 15.8% |
Health and Nutrition:
| Bridgeport: | 47.5% |
| State: | 50.0% |
| Bridgeport: | 45.7% |
| Connecticut: | 47.5% |
| Here: | 28.8 |
| Connecticut: | 28.7 |
| Here: | 21.0% |
| Connecticut: | 20.9% |
| Bridgeport: | 12.0% |
| Connecticut: | 10.5% |
| Bridgeport: | 6.7 |
| Connecticut: | 6.8 |
| This city: | 32.8% |
| Connecticut: | 34.2% |
| Bridgeport: | 54.1% |
| Connecticut: | 56.4% |
| This city: | 80.9% |
| Connecticut: | 78.9% |
More about Health and Nutrition of Bridgeport, CT Residents
| Local government employment and payroll (March 2019) | |||||
| Function | Full-time employees | Monthly full-time payroll | Average yearly full-time wage | Part-time employees | Monthly part-time payroll |
|---|---|---|---|---|---|
| Elementary and Secondary - Instruction | 2,060 | $12,459,026 | $72,577 | 162 | $295,183 |
| Elementary and Secondary - Other Total | 548 | $1,435,139 | $31,426 | 206 | $183,561 |
| Police Protection - Officers | 380 | $2,807,765 | $88,666 | 0 | $0 |
| Firefighters | 291 | $2,426,913 | $100,079 | 0 | $0 |
| Police - Other | 133 | $288,364 | $26,018 | 1 | $683 |
| Financial Administration | 95 | $531,883 | $67,185 | 2 | $5,455 |
| Solid Waste Management | 86 | $589,119 | $82,203 | 1 | $2,325 |
| Other and Unallocable | 71 | $212,463 | $35,909 | 1 | $2,569 |
| Other Government Administration | 52 | $309,495 | $71,422 | 2 | $4,750 |
| Local Libraries | 51 | $247,172 | $58,158 | 18 | $22,948 |
| Health | 45 | $243,668 | $64,978 | 5 | $8,844 |
| Streets and Highways | 43 | $208,519 | $58,191 | 18 | $49,373 |
| Parks and Recreation | 27 | $152,978 | $67,990 | 39 | $21,185 |
| Judicial and Legal | 18 | $142,230 | $94,820 | 0 | $0 |
| Airports | 11 | $61,975 | $67,609 | 0 | $0 |
| Housing and Community Development (Local) | 8 | $45,389 | $68,084 | 0 | $0 |
| Sewerage | 7 | $52,049 | $89,227 | 0 | $0 |
| Welfare | 6 | $24,418 | $48,836 | 8 | $12,330 |
| Fire - Other | 4 | $18,642 | $55,926 | 0 | $0 |
| Water Transport and Terminals | 2 | $9,986 | $59,916 | 0 | $0 |
| Totals for Government | 3,938 | $22,267,194 | $67,853 | 463 | $609,205 |
Bridgeport government finances - Expenditure in 2021 (per resident):
- Construction - General - Other: $28,118,000 ($189.50)
Elementary and Secondary Education: $11,420,000 ($76.97)
Parks and Recreation: $5,640,000 ($38.01)
Regular Highways: $4,213,000 ($28.39)
Housing and Community Development: $3,200,000 ($21.57)
Natural Resources - Other: $2,500,000 ($16.85)
Air Transportation: $1,500,000 ($10.11)
Parking Facilities: $565,000 ($3.81)
- Current Operations - Elementary and Secondary Education: $330,230,000 ($2225.61)
Police Protection: $94,393,000 ($636.17)
Local Fire Protection: $78,386,000 ($528.29)
Sewerage: $30,733,000 ($207.13)
General - Other: $21,413,000 ($144.31)
General Public Buildings: $15,433,000 ($104.01)
Solid Waste Management: $8,090,000 ($54.52)
Libraries: $7,755,000 ($52.27)
Parks and Recreation: $7,463,000 ($50.30)
Financial Administration: $6,131,000 ($41.32)
Public Welfare - Other: $5,526,000 ($37.24)
Judicial and Legal Services: $4,961,000 ($33.44)
Central Staff Services: $4,949,000 ($33.35)
Health - Other: $4,912,000 ($33.10)
Regular Highways: $3,215,000 ($21.67)
Protective Inspection and Regulation - Other: $2,786,000 ($18.78)
Parking Facilities: $2,753,000 ($18.55)
Air Transportation: $1,988,000 ($13.40)
Housing and Community Development: $1,306,000 ($8.80)
Public Welfare Institutions: $235,000 ($1.58)
- General - Interest on Debt: $45,509,000 ($306.71)
- Intergovernmental to Local - Other - General - Other: $67,105,000 ($452.26)
Other - Elementary and Secondary Education: $15,010,000 ($101.16)
- Other Capital Outlay - Elementary and Secondary Education: $4,892,000 ($32.97)
- Total Salaries and Wages: $171,410,000 ($1155.23)
Bridgeport government finances - Revenue in 2021 (per resident):
- Charges - Sewerage: $38,991,000 ($262.78)
Parks and Recreation: $2,965,000 ($19.98)
Other: $1,023,000 ($6.89)
Parking Facilities: $885,000 ($5.96)
Air Transportation: $735,000 ($4.95)
Solid Waste Management: $273,000 ($1.84)
Housing and Community Development: $105,000 ($0.71)
Elementary and Secondary Education - Other: $96,000 ($0.65)
Elementary and Secondary Education School Lunch: $9,000 ($0.06)
- Federal Intergovernmental - Housing and Community Development: $4,471,000 ($30.13)
Other: $1,952,000 ($13.16)
Health and Hospitals: $781,000 ($5.26)
Air Transportation: $771,000 ($5.20)
Education: $497,000 ($3.35)
Highways: $112,000 ($0.75)
- Local Intergovernmental - Education: $1,978,000 ($13.33)
- Miscellaneous - General Revenue - Other: $2,014,000 ($13.57)
Rents: $310,000 ($2.09)
Interest Earnings: $71,000 ($0.48)
Donations From Private Sources: $5,000 ($0.03)
- State Intergovernmental - Education: $270,292,000 ($1821.66)
General Local Government Support: $197,934,000 ($1333.99)
Other: $4,509,000 ($30.39)
Highways: $4,081,000 ($27.50)
Health and Hospitals: $1,758,000 ($11.85)
Public Welfare: $321,000 ($2.16)
- Tax - Property: $333,651,000 ($2248.67)
Documentary and Stock Transfer: $3,406,000 ($22.96)
Occupation and Business License - Other: $3,243,000 ($21.86)
Other License: $3,000 ($0.02)
Bridgeport government finances - Debt in 2021 (per resident):
- Long Term Debt - Beginning Outstanding - Unspecified Public Purpose: $984,139,000 ($6632.69)
Outstanding Unspecified Public Purpose: $946,006,000 ($6375.69)
Retired Unspecified Public Purpose: $38,133,000 ($257.00)
Beginning Outstanding - Public Debt for Private Purpose: $30,169,000 ($203.33)
Outstanding Nonguaranteed - Industrial Revenue: $26,072,000 ($175.71)
Retired Nonguaranteed - Public Debt for Private Purpose: $4,097,000 ($27.61)
- Short Term Debt Outstanding - Beginning: $23,000,000 ($155.01)
End of Fiscal Year: $21,500,000 ($144.90)
Bridgeport government finances - Cash and Securities in 2021 (per resident):
- Bond Funds - Cash and Securities: $2,400,000 ($16.18)
- Other Funds - Cash and Securities: $97,243,000 ($655.38)
- Sinking Funds - Cash and Securities: $28,382,000 ($191.28)
5.92% of this county's 2021 resident taxpayers lived in other counties in 2020 ($194,373 average adjusted gross income)
| Here: | 5.92% |
| Connecticut average: | 5.79% |
0.01% of residents moved from foreign countries ($50 average AGI)
Fairfield County: 0.01% Connecticut average: 0.02%
Top counties from which taxpayers relocated into this county between 2020 and 2021:
| from Westchester County, NY | |
| from New York County, NY | |
| from New Haven County, CT |
6.13% of this county's 2020 resident taxpayers moved to other counties in 2021 ($174,109 average adjusted gross income)
| Here: | 6.13% |
| Connecticut average: | 5.82% |
0.01% of residents moved to foreign countries ($428 average AGI)
Fairfield County: 0.01% Connecticut average: 0.02%
Top counties to which taxpayers relocated from this county between 2020 and 2021:
| to New Haven County, CT | |
| to New York County, NY | |
| to Westchester County, NY |
| Businesses in Bridgeport, CT | ||||
| Name | Count | Name | Count | |
|---|---|---|---|---|
| AT&T | 2 | MasterBrand Cabinets | 8 | |
| Advance Auto Parts | 1 | McDonald's | 4 | |
| AutoZone | 2 | New Balance | 5 | |
| BMW | 1 | Nike | 11 | |
| Blockbuster | 1 | Payless | 1 | |
| Burger King | 2 | Penske | 1 | |
| CVS | 3 | Quiznos | 2 | |
| Curves | 1 | RadioShack | 1 | |
| DHL | 1 | Red Lobster | 1 | |
| Dairy Queen | 1 | Rite Aid | 3 | |
| Decora Cabinetry | 6 | Ryder Rental & Truck Leasing | 1 | |
| Domino's Pizza | 1 | Staples | 1 | |
| Dunkin Donuts | 14 | Stop & Shop | 2 | |
| FedEx | 16 | Subway | 2 | |
| Firestone Complete Auto Care | 1 | T-Mobile | 1 | |
| Ford | 1 | True Value | 1 | |
| GameStop | 1 | U-Haul | 2 | |
| H&R Block | 3 | UPS | 10 | |
| Holiday Inn | 1 | Vans | 1 | |
| Home Depot | 1 | Walgreens | 3 | |
| KFC | 2 | Wendy's | 1 | |
| Marshalls | 1 | YMCA | 3 | |
Strongest AM radio stations in Bridgeport:
- WDJZ (1530 AM; daytime; 5 kW; BRIDGEPORT, CT; Owner: PEOPLE'S BROADCAST NETWORK, LLC)
- WICC (600 AM; 1 kW; BRIDGEPORT, CT; Owner: CUMULUS LICENSING CORP.)
- WCUM (1450 AM; 1 kW; BRIDGEPORT, CT; Owner: RADIO CUMBRE BROADCASTING, INC.)
- WFIF (1500 AM; daytime; 5 kW; MILFORD, CT)
- WFAN (660 AM; 50 kW; NEW YORK, NY; Owner: INFINITY BROADCASTING OPERATIONS, INC.)
- WGSM (740 AM; 25 kW; HUNTINGTON, NY; Owner: K RADIO LICENSEE, INC.)
- WCBS (880 AM; 50 kW; NEW YORK, NY; Owner: INFINITY BROADCASTING OPERATIONS, INC.)
- WADS (690 AM; daytime; 3 kW; ANSONIA, CT; Owner: RADIO AMOR, INC.)
- WMCA (570 AM; 50 kW; NEW YORK, NY; Owner: SALEM MEDIA OF NEW YORK, LLC)
- WABC (770 AM; 50 kW; NEW YORK, NY; Owner: WABC-AM RADIO, INC.)
- WOR (710 AM; 50 kW; NEW YORK, NY; Owner: BUCKLEY BROADCASTING CORPORATION)
- WTIC (1080 AM; 50 kW; HARTFORD, CT; Owner: INFINITY RADIO OPERATIONS INC.)
- WEPN (1050 AM; 50 kW; NEW YORK, NY; Owner: NEW YORK AM RADIO, LLC)
Strongest FM radio stations in Bridgeport:
- WEBE (107.9 FM; WESTPORT, CT; Owner: CUMULUS LICENSING CORP.)
- WEZN-FM (99.9 FM; BRIDGEPORT, CT; Owner: CXR HOLDINGS, INC.)
- WSHU-FM (91.1 FM; FAIRFIELD, CT; Owner: SACRED HEART UNIVERSITY, INC.)
- WRKI-FM2 (95.1 FM; BRIDGEPORT, CT; Owner: CUMULUS LICENSING CORP.)
- WPKN (89.5 FM; BRIDGEPORT, CT; Owner: WPKN, INC.)
- W285DE (104.9 FM; BRIDGEPORT, CT; Owner: DANBURY COMMUNITY RADIO, INC.)
- WMNR-FM1 (88.1 FM; HUNTINGTON, CT; Owner: MONROE BOARD OF EDUCATION)
- WMNR (88.1 FM; MONROE, CT; Owner: MONROE BOARD OF EDUCATION)
- WKCI-FM (101.3 FM; HAMDEN, CT; Owner: CLEAR CHANNEL BROADCASTING LICENSES, INC.)
- W220CF (91.9 FM; HUNTINGTON, CT; Owner: MONROE BOARD OF EDUCATION)
- WPLR (99.1 FM; NEW HAVEN, CT; Owner: COX RADIO, INC.)
- WRXC (90.1 FM; SHELTON, CT; Owner: MONROE BOARD OF EDUCATION)
- WALK-FM (97.5 FM; PATCHOGUE, NY; Owner: AMFM RADIO LICENSES, L.L.C.)
- WYBC-FM (94.3 FM; NEW HAVEN, CT; Owner: YALE BROADCASTING CO., INC.)
- WDAQ (98.3 FM; DANBURY, CT; Owner: BERKSHIRE BROADCASTING CORP.)
- WWPT (90.3 FM; WESTPORT, CT; Owner: WESTPORT CT. BOARD OF EDUCATION)
- WPLJ (95.5 FM; NEW YORK, NY; Owner: WPLJ-FM RADIO, INC.)
- WEFX (95.9 FM; NORWALK, CT; Owner: COX RADIO, INC.)
- WRCH (100.5 FM; NEW BRITAIN, CT; Owner: INFINITY RADIO OPERATIONS INC.)
- WRKI (95.1 FM; BROOKFIELD, CT; Owner: CUMULUS LICENSING CORP.)
TV broadcast stations around Bridgeport:
- WEDW (Channel 49; BRIDGEPORT, CT; Owner: CONNECTICUT PUBLIC BROADCASTING, INC.)
- W65DZ (Channel 65; BRIDGEPORT, CT; Owner: PAGING ASSOCIATES, INC.)
- WTNH (Channel 8; NEW HAVEN, CT; Owner: WTNH BROADCASTING, INC.)
- WEDY (Channel 65; NEW HAVEN, CT; Owner: CONNECTICUT PUBLIC BROADCASTING, INC.)
- WCTX (Channel 59; NEW HAVEN, CT; Owner: WTNH BROADCASTING, INC.)
- WTIC-TV (Channel 61; HARTFORD, CT; Owner: TRIBUNE TELEVISION COMPANY)
- W11BJ (Channel 11; HARTFORD, CT; Owner: COMMUNICATIONS SITE MANAGEMENT LLC)
- WNYW (Channel 5; NEW YORK, NY; Owner: FOX TELEVISION STATIONS, INC.)
- WCBS-TV (Channel 2; NEW YORK, NY; Owner: CBS BROADCASTING INC.)
- WSAH (Channel 43; BRIDGEPORT, CT; Owner: WSAH LICENSE, INC.)
- WABC-TV (Channel 7; NEW YORK, NY; Owner: AMERICAN BROADCASTING COMPANIES, INC)
- WPIX (Channel 11; NEW YORK, NY; Owner: WPIX, INC.)
- WWOR-TV (Channel 9; SECAUCUS, NJ; Owner: FOX TELEVISION STATIONS, INC.)
- WTXX (Channel 20; WATERBURY, CT; Owner: WTXX INC.)
- WFTY (Channel 67; SMITHTOWN, NY; Owner: UNIVISION NEW YORK LLC)
- WLNY (Channel 55; RIVERHEAD, NY; Owner: WLNY-TV, INC.)
- WVIT (Channel 30; NEW BRITAIN, CT; Owner: OUTLET BROADCASTING, INC)
- WNJU (Channel 47; LINDEN, NJ; Owner: WNJU LICENSE CORPORATION)
- WXNY-LP (Channel 32; NEW YORK, NY; Owner: ISLAND BROADCASTING COMPANY)
- WPXN-TV (Channel 31; NEW YORK, NY; Owner: PAXSON COMMUNICATIONS LICENSE COMPANY, LLC)
- WEDH (Channel 24; HARTFORD, CT; Owner: CONNECTICUT PUBLIC BROADCASTING, INC.)
- WFUT (Channel 68; NEWARK, NJ; Owner: UNIVISION NEW YORK LLC)
- WNBC (Channel 4; NEW YORK, NY; Owner: NATIONAL BROADCASTING COMPANY, INC.)
- WNET (Channel 13; NEWARK, NJ; Owner: EDUCATIONAL BROADCASTING CORPORATION)
- WXTV (Channel 41; PATERSON, NJ; Owner: WXTV LICENSE PARTNERSHIP, G.P.)
Medal of Honor Recipients
Medal of Honor Recipients born in Bridgeport: John C. Curtis, John Jones, John MacKenzlE, Oscar E. Peck, Tedford H. Cann.
- National Bridge Inventory (NBI) Statistics
- 103Number of bridges
- 1,611ft / 491mTotal length
- $30,300,000Total costs
- 4,124,003Total average daily traffic
- 345,728Total average daily truck traffic
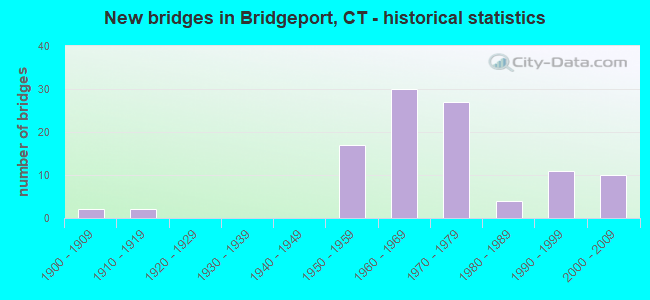
- New bridges - historical statistics
- 21900-1909
- 21910-1919
- 171950-1959
- 301960-1969
- 271970-1979
- 41980-1989
- 111990-1999
- 102000-2009
FCC Registered Commercial Land Mobile Towers: 6 (See the full list of FCC Registered Commercial Land Mobile Towers in Bridgeport, CT)
FCC Registered Private Land Mobile Towers: 4 (See the full list of FCC Registered Private Land Mobile Towers)
FCC Registered Broadcast Land Mobile Towers: 62 (See the full list of FCC Registered Broadcast Land Mobile Towers)
FCC Registered Microwave Towers: 34 (See the full list of FCC Registered Microwave Towers in this town)
FCC Registered Paging Towers: 22 (See the full list of FCC Registered Paging Towers)
FCC Registered Maritime Coast & Aviation Ground Towers: 18 (See the full list of FCC Registered Maritime Coast & Aviation Ground Towers)
FCC Registered Amateur Radio Licenses: 246 (See the full list of FCC Registered Amateur Radio Licenses in Bridgeport)
FAA Registered Aircraft: 14 (See the full list of FAA Registered Aircraft in Bridgeport)
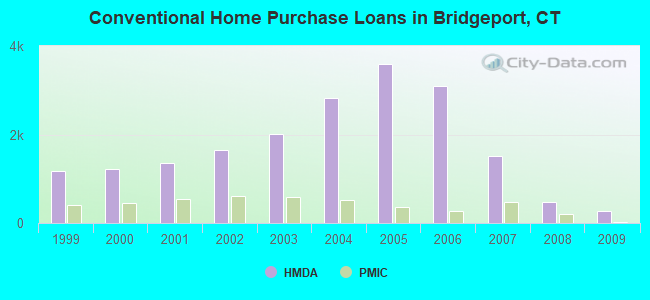
| Home Mortgage Disclosure Act Aggregated Statistics For Year 2009 (Based on 39 full tracts) | ||||||||||||||
| A) FHA, FSA/RHS & VA Home Purchase Loans | B) Conventional Home Purchase Loans | C) Refinancings | D) Home Improvement Loans | E) Loans on Dwellings For 5+ Families | F) Non-occupant Loans on < 5 Family Dwellings (A B C & D) | G) Loans On Manufactured Home Dwelling (A B C & D) | ||||||||
|---|---|---|---|---|---|---|---|---|---|---|---|---|---|---|
| Number | Average Value | Number | Average Value | Number | Average Value | Number | Average Value | Number | Average Value | Number | Average Value | Number | Average Value | |
| LOANS ORIGINATED | 384 | $166,510 | 263 | $128,118 | 650 | $177,851 | 43 | $82,953 | 7 | $688,143 | 129 | $139,465 | 0 | $0 |
| APPLICATIONS APPROVED, NOT ACCEPTED | 34 | $150,147 | 32 | $110,719 | 126 | $185,008 | 19 | $33,526 | 1 | $535,000 | 22 | $157,818 | 0 | $0 |
| APPLICATIONS DENIED | 132 | $163,629 | 123 | $118,024 | 787 | $196,718 | 124 | $64,290 | 0 | $0 | 125 | $155,048 | 1 | $2,000 |
| APPLICATIONS WITHDRAWN | 72 | $164,250 | 72 | $131,208 | 309 | $190,337 | 14 | $162,286 | 7 | $384,286 | 40 | $167,800 | 0 | $0 |
| FILES CLOSED FOR INCOMPLETENESS | 22 | $162,318 | 11 | $88,364 | 75 | $203,507 | 3 | $139,000 | 0 | $0 | 7 | $107,143 | 0 | $0 |
Detailed mortgage data for all 39 tracts in Bridgeport, CT
| Private Mortgage Insurance Companies Aggregated Statistics For Year 2009 (Based on 23 full tracts) | ||||||
| A) Conventional Home Purchase Loans | B) Refinancings | C) Non-occupant Loans on < 5 Family Dwellings (A & B) | ||||
|---|---|---|---|---|---|---|
| Number | Average Value | Number | Average Value | Number | Average Value | |
| LOANS ORIGINATED | 30 | $144,667 | 7 | $221,000 | 0 | $0 |
| APPLICATIONS APPROVED, NOT ACCEPTED | 24 | $171,250 | 13 | $210,769 | 2 | $109,000 |
| APPLICATIONS DENIED | 9 | $126,111 | 10 | $172,200 | 0 | $0 |
| APPLICATIONS WITHDRAWN | 5 | $229,600 | 1 | $103,000 | 0 | $0 |
| FILES CLOSED FOR INCOMPLETENESS | 2 | $190,000 | 2 | $270,000 | 1 | $191,000 |
2004 - 2018 National Fire Incident Reporting System (NFIRS) incidents
- Fire incident types reported to NFIRS in Bridgeport, CT
- 2,51237.2%Structure Fires
- 2,30734.2%Outside Fires
- 1,67624.8%Mobile Property/Vehicle Fires
- 2603.8%Other
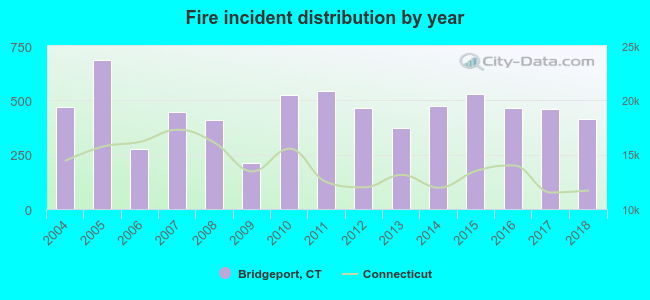 Based on the data from the years 2004 - 2018 the average number of fires per year is 450. The highest number of fires - 686 took place in 2005, and the least - 210 in 2009. The data has a dropping trend.
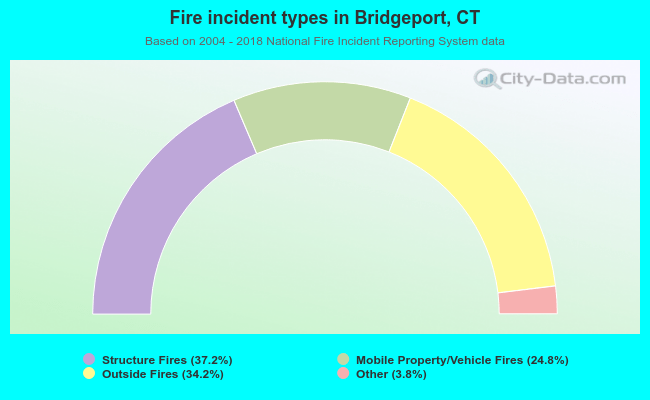 When looking into fire subcategories, the most incidents belonged to: Structure Fires (37.2%), and Outside Fires (34.2%).
| Most common first names in Bridgeport, CT among deceased individuals | ||
| Name | Count | Lived (average) |
|---|---|---|
| John | 1,819 | 74.3 years |
| Mary | 1,818 | 80.3 years |
| Joseph | 1,297 | 74.5 years |
| William | 973 | 73.3 years |
| Anna | 905 | 81.8 years |
| Helen | 735 | 80.2 years |
| James | 708 | 71.8 years |
| George | 663 | 74.2 years |
| Frank | 614 | 74.8 years |
| Margaret | 581 | 79.7 years |
| Most common last names in Bridgeport, CT among deceased individuals | ||
| Last name | Count | Lived (average) |
|---|---|---|
| Smith | 332 | 73.3 years |
| Johnson | 214 | 73.7 years |
| Brown | 192 | 71.7 years |
| Williams | 185 | 69.8 years |
| Jones | 133 | 70.9 years |
| Rivera | 115 | 62.9 years |
| Miller | 107 | 74.6 years |
| Davis | 106 | 69.9 years |
| Rodriguez | 96 | 60.9 years |
| Jackson | 95 | 68.4 years |
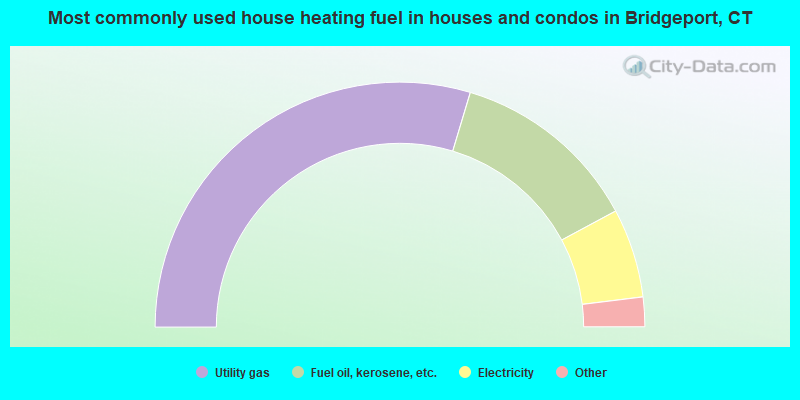
- 59.3%Utility gas
- 25.0%Fuel oil, kerosene, etc.
- 11.8%Electricity
- 2.4%Bottled, tank, or LP gas
- 0.8%Solar energy
- 0.7%Other fuel
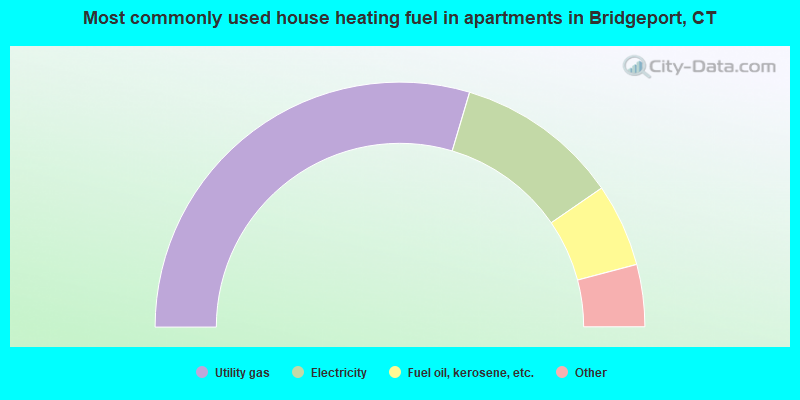
- 59.2%Utility gas
- 21.6%Electricity
- 11.0%Fuel oil, kerosene, etc.
- 3.9%Bottled, tank, or LP gas
- 3.5%Other fuel
- 0.8%No fuel used
Bridgeport compared to Connecticut state average:
- Median household income below state average.
- Black race population percentage above state average.
- Hispanic race population percentage above state average.
- Median age below state average.
- Foreign-born population percentage significantly above state average.
- Renting percentage above state average.
Bridgeport, CT compared to other similar cities:
Bridgeport on our top lists:
- #1 on the list of "Top 101 cities with the highest number of rapes per 100,000 residents, excludes tourist destinations and others with a lot of outsiders visiting based on city industries data (population 50,000+)"
- #7 on the list of "Top 101 cities with the largest city-data.com crime index increase from 2011 to 2012 (population 50,000+)"
- #15 on the list of "Top 101 cities with the highest city-data.com crime index, excludes tourist destinations and others with a lot of outsiders visiting based on city industries data (population 50,000+)"
- #19 on the list of "Top 101 cities with largest percentage of females in occupations: healthcare support occupations (population 50,000+)"
- #20 on the list of "Top 101 cities with the lowest cost per building permit (population 50,000+)"
- #24 on the list of "Top 101 cities with largest percentage of males in occupations: building and grounds cleaning and maintenance occupations (population 50,000+)"
- #25 on the list of "Top 101 cities with the most residents born in Other South Eastern Asia (population 500+)"
- #27 on the list of "Top 101 cities with largest percentage of males in industries: administrative and support and waste management services (population 50,000+)"
- #32 on the list of "Top 101 cities with largest percentage of males in occupations: transportation occupations (population 50,000+)"
- #34 on the list of "Top 101 cities with largest percentage of males in occupations: construction and extraction occupations (population 50,000+)"
- #34 on the list of "Top 101 cities with largest percentage of females in industries: health care and social assistance (population 50,000+)"
- #35 on the list of "Top 101 cities with largest percentage of females in occupations: building and grounds cleaning and maintenance occupations (population 50,000+)"
- #35 on the list of "Top 101 cities with largest percentage of females in occupations: personal care and service occupations (population 50,000+)"
- #37 on the list of "Top 101 cities with the most residents born in Jamaica (population 500+)"
- #39 on the list of "Top 101 cities with the highest number of robberies per 100,000 residents, excludes tourist destinations and others with a lot of outsiders visiting based on city industries data (population 50,000+)"
- #39 on the list of "Top 101 cities with largest percentage of females in industries: administrative and support and waste management services (population 50,000+)"
- #42 on the list of "Top 101 cities with the largest city-data.com crime index increase from 2002 to 2012 (population 50,000+)"
- #45 on the list of "Top 100 cities with old houses but young residents (pop. 50,000+)"
- #46 on the list of "Top 101 cities with the highest number of murders per 100,000 residents, excludes tourist destinations and others with a lot of outsiders visiting based on city industries data (population 50,000+)"
- #48 on the list of "Top 101 cities with the least cars per house, population 50,000+"
- #84 (06607) on the list of "Top 101 zip codes with the largest percentage of West Indian first ancestries"
- #14 on the list of "Top 101 counties with the most Orthodox congregations"
- #18 on the list of "Top 101 counties with the best general health status score of residents (1-5), 3 years of data"
- #21 on the list of "Top 101 counties with the most Catholic congregations"
- #21 on the list of "Top 101 counties with the most Catholic adherents"
- #22 on the list of "Top 101 counties with the highest percentage of residents that visited a dentist within the past year"
State forum archive:

|
|
Total of 222 patent applications in 2008-2024.