Coal City: Fire Incidents, Illinois (IL)
Where are fire incidents reported in Coal City, IL
Something went wrong! Please refresh the page.
|
| |||||||||||||||||||||||||||||||||||||||||||||||||||||||||||||||||||||||||||||||||||||||||||||||||||||||||||||
2002 - 2018 National Fire Incident Reporting System (NFIRS) incidents
- Incident types reported to NFIRS in Coal City, IL
- 2,31243.7%Rescue & EMS
- 96718.3%Service Call
- 75314.2%Fire
- 56510.7%Good Intent Call
- 4408.3%Hazardous Condition
- 2354.4%False Alarm
- 120.2%Special Incident
- 60.1%Severe Weather
- Fire incident types reported to NFIRS in Coal City, IL
- 40553.8%Structure Fires
- 26435.1%Outside Fires
- 689.0%Mobile Property/Vehicle Fires
- 162.1%Other
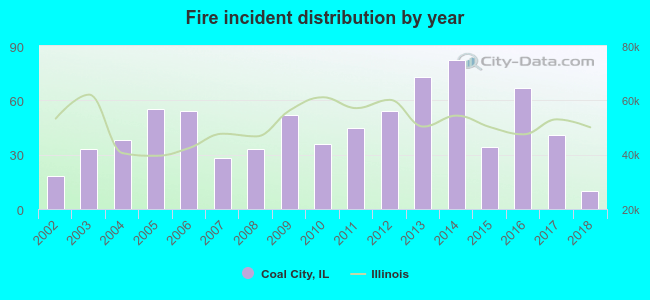 Based on the data from the years 2002 - 2018 the average number of fire incidents per year is 44. The highest number of fire incidents - 82 took place in 2014, and the least - 10 in 2018. The data has a decreasing trend.
The average number of yearly fire incidents per 10k residents in Coal City, IL compared to nearest cities:
(Note: Based on data for the last 3 years, including only cities with population 5,000 and above)
| Coal City: | 71.2 |
| Braidwood: | 46.3 |
| Wilmington: | 146.5 |
| Morris: | 101.4 |
| Channahon: | 43.1 |
| Minooka: | 54.8 |
| Shorewood: | 36.6 |
| Manhattan: | 60.7 |
| Joliet: | 28.1 |
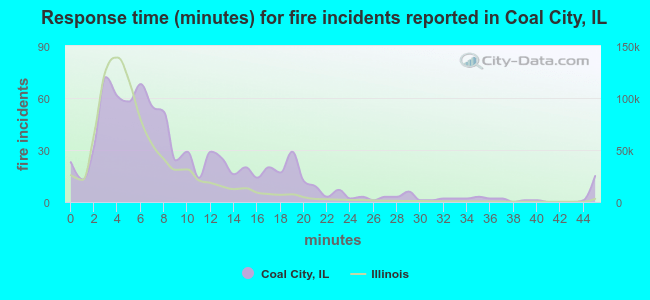 The median response time based on all reported fire incidents is 7 minutes. This is higher compared to the Illinois median value.
The median response time in Coal City, IL compared to nearest cities:
(Note: Based on data for all years, including only cities with at least 500 fire incidents)
| Coal City: | 7 minutes |
| Braidwood: | 6 minutes |
| Wilmington: | 9 minutes |
| Morris: | 9 minutes |
| Channahon: | 7 minutes |
| Minooka: | 7 minutes |
| Elwood: | 7 minutes |
| Dwight: | 11 minutes |
| Shorewood: | 5 minutes |
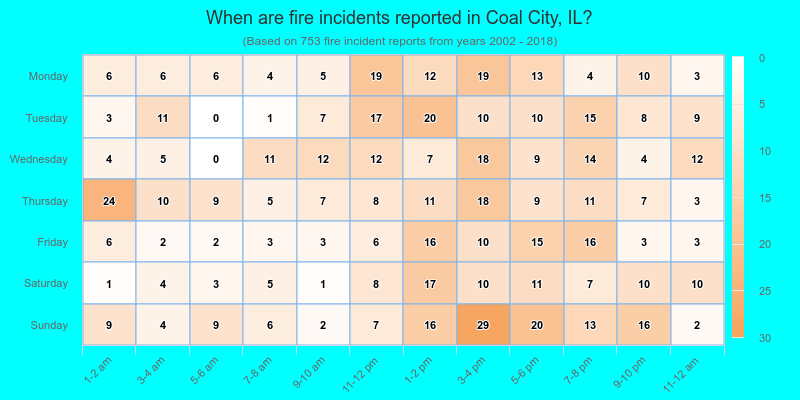
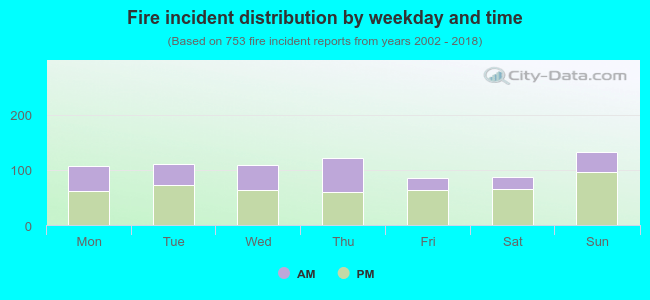 36.3% incidents where reported in the morning and 63.7% in the evening. The most fires (17.7%) took place on Sunday, and the least (11.3%) on Friday.
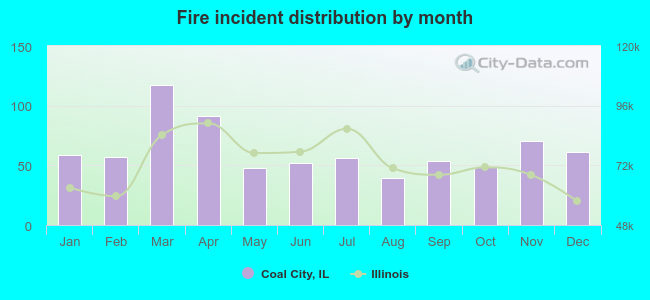 Based on the 753 fire incidents from years 2002 - 2018 most fires (15.5%) took place during March, and the least (5.2%) in August.
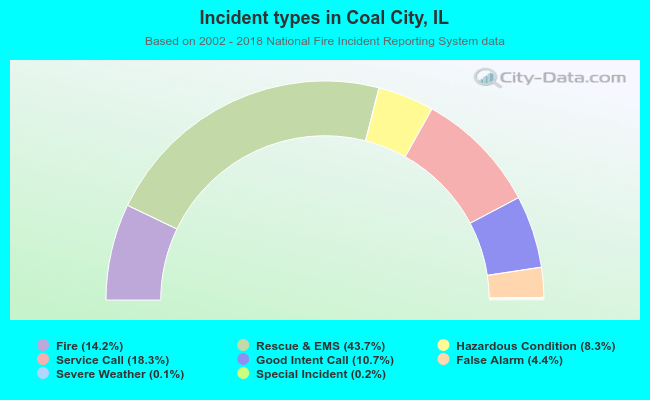 Out of all 5,290 cases reported during the years 2002 - 2018, the most belonged to the categories: Overpressure Rupture (43.7%), Hazardous Condition (18.3%), and Fire (14.2%).
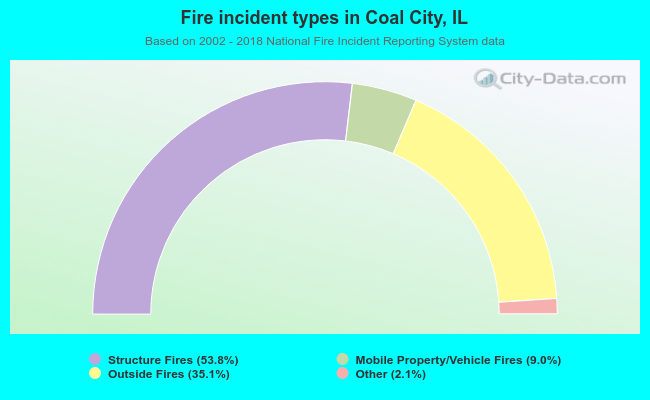 When looking into fire subcategories, the most incidents belonged to: Structure Fires (53.8%), and Outside Fires (35.1%).