| Fire incidents reported |
|---|
| Sreet name | Count |
|---|
| COAL CITY RD. | 30 | | COAL CITY RD | 26 | | COAL CITY RD | 24 | | COAL CITY ROAD | 24 | | WHITBY ROAD | 18 | | WHITBY RD. | 12 | | WHITBY RD | 10 | | 125 EPPERLY RD | 8 | | BEAVER ST. | 8 | | INDEPENDENCE ROAD | 8 | | 125 PINE ST | 6 | | 126 AGEE DR | 6 | | COAL CITY ROAD RD | 6 | | LYNWINN RD | 6 | | 102 BATTLESHIP CP | 4 | | 149 ABNEY ROAD | 4 | | 2118 BEAVER ST. | 4 | | 223 BEAVER ST | 4 | | 584 BASHAM ST | 4 | | CASTLEBAR ST | 4 | | CENTER AVE. | 4 | | COLE LN | 4 | | DARNELL LN | 4 | | HUGHES DR. | 4 | | HUNGATE RD. | 4 |
| | | Fire incidents reported |
|---|
| Sreet name | Count |
|---|
| HYLTON LOOP | 4 | | INDEPENDENCE RD. | 4 | | LILLYS RIDGE | 4 | | LYNWINN RD | 4 | | LYNWINN ROAD | 4 | | MULLENS STREET | 4 | | RACE TRACK RD | 4 | | RACETRACK ROAD | 4 | | SULLIVAN ROAD | 4 | | SULLIVAN ROAD RD | 4 | | TINGLER AVE | 4 | | WALKER ST | 4 | | WARNER AVE | 4 | | WHITBY RD | 4 | | WILLIBET HOLLOW | 4 | | 101 ALABASTER LANE | 2 | | 102 BATTLESHIP CAMP | 2 | | 103 TAKEIN DR | 2 | | 1042 INDEPENDENCE RD | 2 | | 106 HUDSON DR | 2 | | 109 BARLING LANE | 2 | | 109 LILLYS RIDGE | 2 | | 110 HUDSON DR | 2 | | 110 LILLY RIDGE RD | 2 | | 110 LILLYS RIDGE RD. | 2 |
|
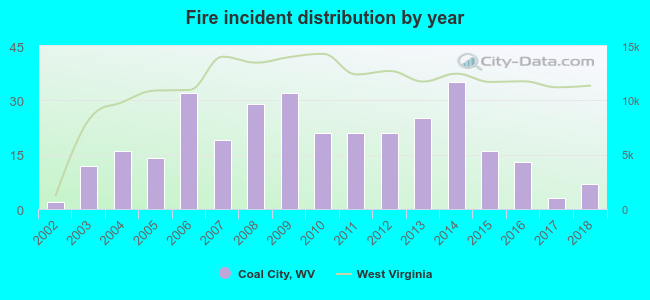 According to the data from the years 2002 - 2018 the average number of fires per year is 19. The highest number of reported fires - 35 took place in 2014, and the least - 2 in 2002. The data has an increasing trend.
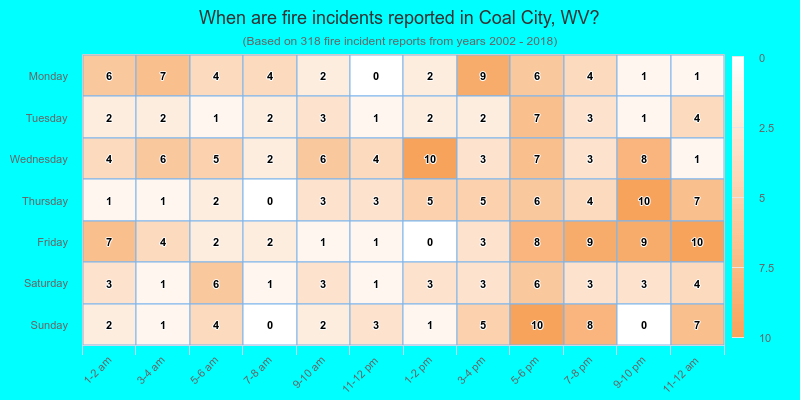
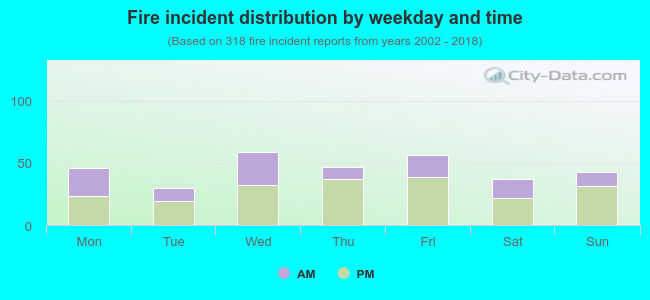 36.2% incidents where reported in the morning and 63.8% in the evening. The most fires (18.6%) took place on Wednesday, and the least (9.4%) on Tuesday.
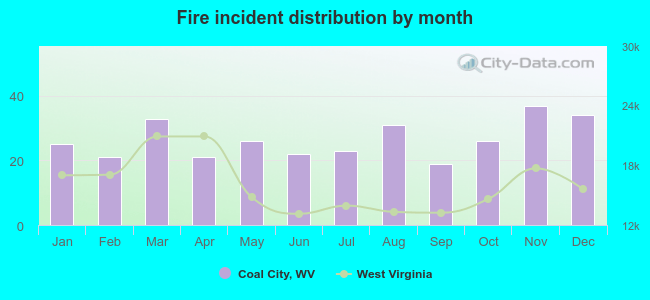 According to the 318 fire incidents from years 2002 - 2018 most fires (11.6%) took place during November, and the least (6.0%) in September.
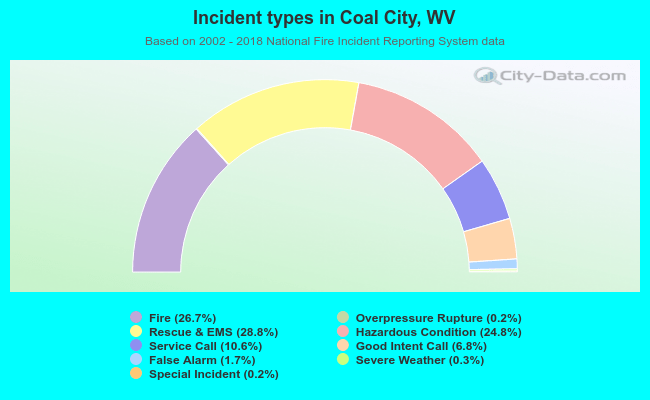 Out of all 1,193 cases reported during the years 2002 - 2018, the most belonged to the categories: Rescue & EMS (28.8%), Fire (26.7%), and Hazardous Condition (24.8%).
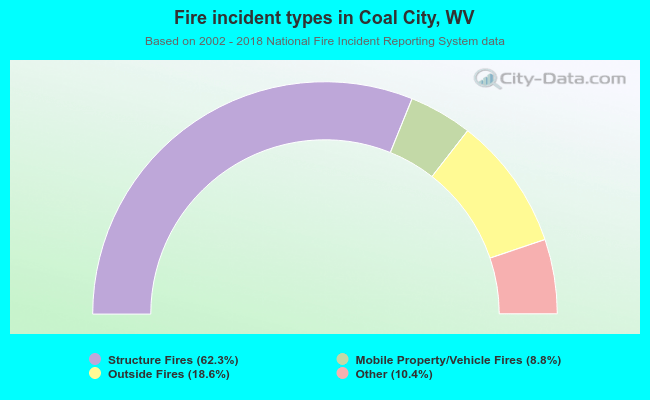 When looking into fire subcategories, the most reports belonged to: Structure Fires (62.3%), and Outside Fires (18.6%).