Cockeysville: Fire Incidents, Maryland (MD)
Where are fire incidents reported in Cockeysville, MD
Something went wrong! Please refresh the page.
| Fire incidents reported | |
|---|---|
| Sreet name | Count |
| YORK RD | 218 |
| SHAWAN RD | 72 |
| PADONIA RD | 70 |
| CRANBROOK RD | 66 |
| WARREN RD | 66 |
| BEAVER DAM RD | 58 |
| TEXAS STATION CT | 36 |
| MC CORMICK RD | 32 |
| GILROY RD | 28 |
| GREENSIDE DR | 28 |
| LAKE VISTA CIR | 26 |
| FRANKEL WAY | 24 |
| SCHILLING RD | 24 |
| INTERNATIONAL CIR | 22 |
| LORD BYRON LN | 22 |
| SCHILLING CIR | 22 |
| BEAVER CT | 18 |
| CRANBROOK HILLS PL | 18 |
| FALLS RD | 18 |
| GREENSPRING DR | 18 |
| LIMESTONE VALLEY DR | 16 |
| SHAWAN RD*WARREN RD | 16 |
| BEEHIVE PL | 14 |
| HOGARTH CIR | 14 |
| MALCOLM CIR | 14 |
| MCCORMICK RD | 14 |
| SHAWAN RD*BELFAST RD | 14 |
| SHAWAN RDBELFAST RD | 14 |
| TIMONIUM RD | 14 |
| CROSSWIND PL | 12 |
2004 - 2018 National Fire Incident Reporting System (NFIRS) incidents
- Incident types reported to NFIRS in Cockeysville, MD
- 10,37360.3%Rescue & EMS
- 2,17412.6%Hazardous Condition
- 1,5529.0%False Alarm
- 1,2137.1%Good Intent Call
- 9075.3%Fire
- 8985.2%Service Call
- 620.4%Overpressure Rupture
- Fire incident types reported to NFIRS in Cockeysville, MD
- 51256.4%Outside Fires
- 17519.3%Mobile Property/Vehicle Fires
- 15917.5%Structure Fires
- 616.7%Other
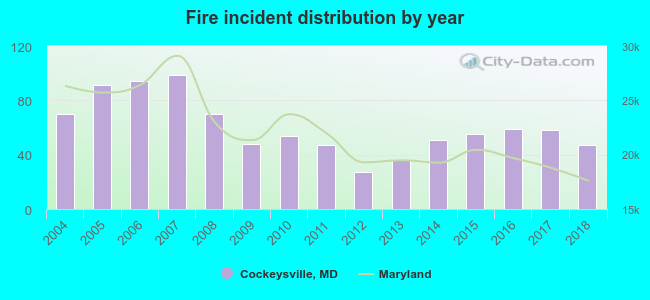 Based on the data from the years 2004 - 2018 the average number of fires per year is 60. The highest number of reported fire incidents - 99 took place in 2007, and the least - 27 in 2012. The data has a dropping trend.
The average number of yearly fire incidents per 10k residents in Cockeysville, MD compared to nearest cities:
(Note: Based on data for the last 3 years, including only cities with population 5,000 and above)
| Cockeysville: | 26.3 |
| Towson: | 13.6 |
| Parkville: | 23.6 |
| Pikesville: | 21.3 |
| Garrison: | 1.1 |
| Perry Hall: | 2.6 |
| Owings Mills: | 22.2 |
| Reisterstown: | 22.8 |
| Fallston: | 44.7 |
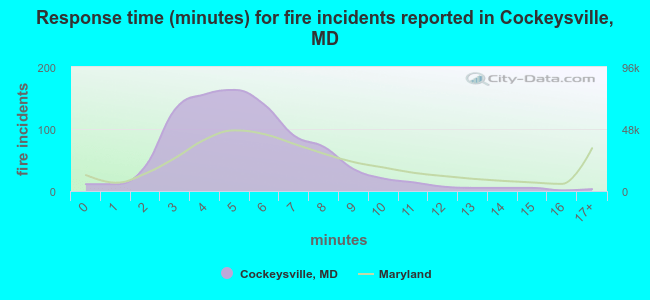 The median response time based on all reported fire incidents is 5 minutes. This is lower than the Maryland median value.
The median response time in Cockeysville, MD compared to nearest cities:
(Note: Based on data for all years, including only cities with at least 500 fire incidents)
| Cockeysville: | 5 minutes |
| Towson: | 5 minutes |
| Parkville: | 5 minutes |
| Pikesville: | 5 minutes |
| Owings Mills: | 6 minutes |
| Reisterstown: | 6 minutes |
| Fallston: | 8 minutes |
| Randallstown: | 5 minutes |
| Baltimore: | 6 minutes |
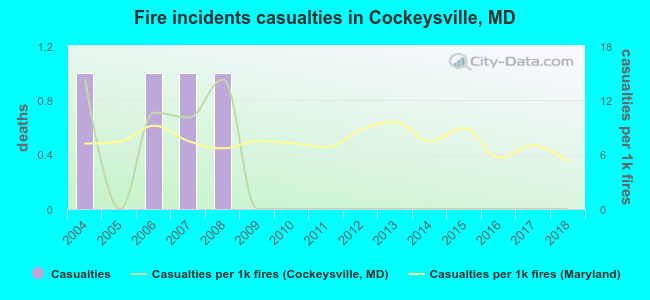 Based on the reports from the years 2004 - 2018 the average number of fire-related yearly casualties is 0. The highest number of reported casualties - 1 took place in 2004, and the lowest - 0 in 2005. The data has a dropping trend.
The average number of casualties per 1,000 fires is 3. This indicator was the highest - 14 in 2004, and the lowest 0 in 2005. The trend for injuries per 1,000 fire incidents is decreasing. Compared to the Maryland value the number of injuries per 1,000 incidents is lower.
Based on the reports from the years 2004 - 2018 the average number of fire-related yearly casualties is 0. The highest number of reported casualties - 1 took place in 2004, and the lowest - 0 in 2005. The data has a dropping trend.
The average number of casualties per 1,000 fires is 3. This indicator was the highest - 14 in 2004, and the lowest 0 in 2005. The trend for injuries per 1,000 fire incidents is decreasing. Compared to the Maryland value the number of injuries per 1,000 incidents is lower.Casualties per 1,000 incidents in Cockeysville, MD compared to nearest cities:
(Note: Based on data for all years, including only cities with at least 500 fire incidents)
| Cockeysville: | 4.4 |
| Towson: | 2.9 |
| Parkville: | 6.2 |
| Pikesville: | 4.2 |
| Owings Mills: | 4.6 |
| Reisterstown: | 1.0 |
| Fallston: | 1.1 |
| Randallstown: | 7.7 |
| Baltimore: | 11.4 |
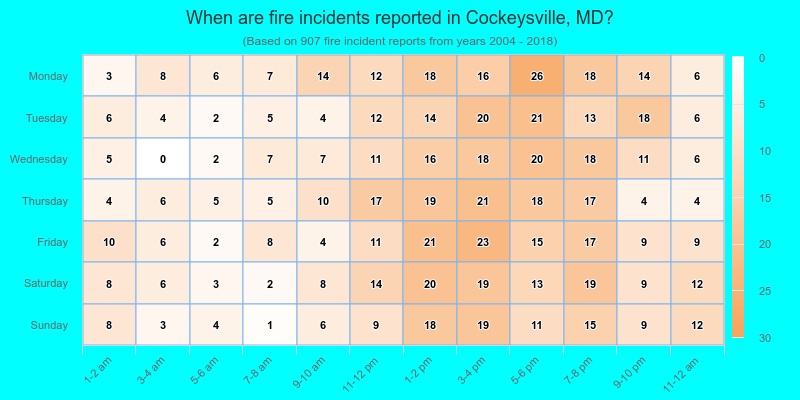
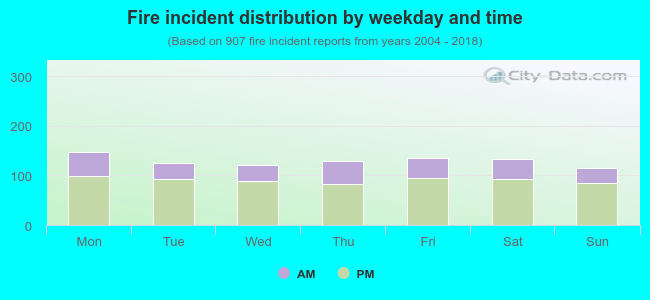 30.3% incidents where reported in the morning and 69.7% in the evening. The most fires (16.3%) took place on Monday, and the least (12.7%) on Sunday.
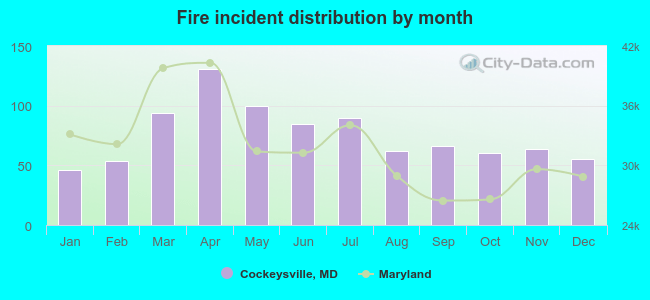 Based on the 907 fire incidents from years 2004 - 2018 most fires (14.4%) took place during April, and the least (5.1%) in January.
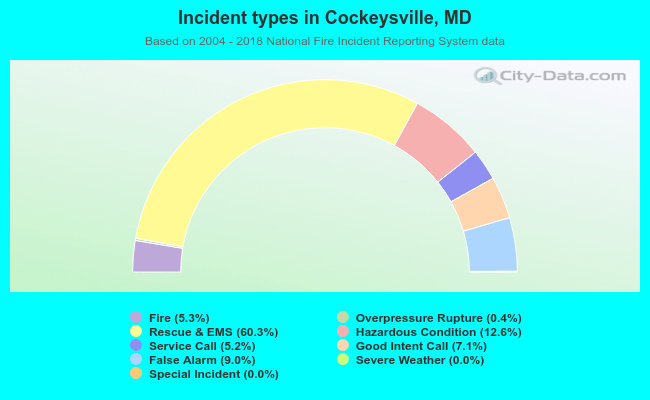 Out of all 17,193 cases reported during the years 2004 - 2018, the most belonged to the categories: Rescue & EMS (60.3%), Hazardous Condition (12.6%), and False Alarm (9.0%).
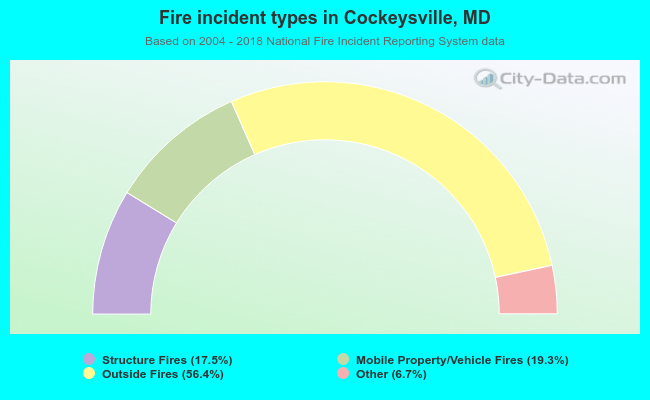 When looking into fire subcategories, the most incidents belonged to: Outside Fires (56.4%), and Mobile Property/Vehicle Fires (19.3%).