Towson: Fire Incidents, Maryland (MD)
Where are fire incidents reported in Towson, MD
Something went wrong! Please refresh the page.
| Fire incidents reported | |
|---|---|
| Sreet name | Count |
| YORK RD | 306 |
| JOPPA RD | 180 |
| LOCH RAVEN BLVD | 148 |
| DULANEY VALLEY RD | 144 |
| CHARLES ST | 102 |
| PUTTY HILL AV | 46 |
| DONINGTON CIR | 42 |
| GOUCHER BLVD | 42 |
| CHESAPEAKE AV | 28 |
| CROMWELL BRIDGE RD | 28 |
| PROVIDENCE RD | 28 |
| TOWSONTOWN CT | 28 |
| KENILWORTH DR | 24 |
| TOWSONTOWN BLVD | 24 |
| ACORN CIR | 22 |
| LOCH RAVEN DR | 22 |
| SOUTHERLY RD | 22 |
| WASHINGTON AV | 22 |
| TAYLOR AV | 20 |
| CAMPUS VIEW DR | 18 |
| LA. SALLE RD | 18 |
| PENNSYLVANIA AVE | 18 |
| STEVENSON LN | 18 |
| WITHERWOOD CT | 18 |
| BRIDGEMAN TER | 16 |
| DULANEY VALLEY*YORK | 16 |
| GREENVIEW TER | 16 |
| HAMPTON LN | 16 |
| PLEASANT PLAINS RD | 16 |
| VIRGINIA AVE | 16 |
2004 - 2018 National Fire Incident Reporting System (NFIRS) incidents
- Incident types reported to NFIRS in Towson, MD
- 26,56070.0%Rescue & EMS
- 4,00310.5%Hazardous Condition
- 2,4806.5%False Alarm
- 1,7674.7%Good Intent Call
- 1,7354.6%Service Call
- 1,3573.6%Fire
- 520.1%Overpressure Rupture
- Fire incident types reported to NFIRS in Towson, MD
- 76456.3%Outside Fires
- 27620.3%Mobile Property/Vehicle Fires
- 23817.5%Structure Fires
- 795.8%Other
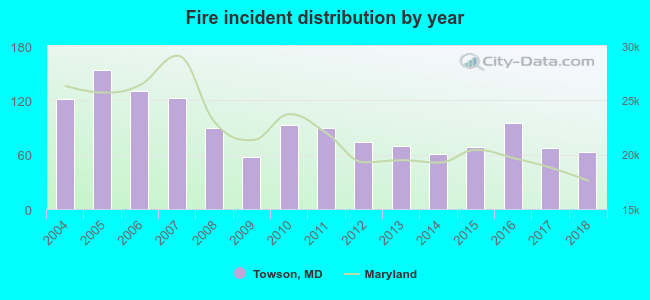 Based on the data from the years 2004 - 2018 the average number of fires per year is 90. The highest number of reported fire incidents - 154 took place in 2005, and the least - 57 in 2009. The data has a dropping trend.
The average number of yearly fire incidents per 10k residents in Towson, MD compared to nearest cities:
(Note: Based on data for the last 3 years, including only cities with population 5,000 and above)
| Towson: | 13.6 |
| Parkville: | 23.6 |
| Pikesville: | 21.3 |
| Cockeysville: | 26.3 |
| Baltimore: | 47.1 |
| Rosedale: | 19.7 |
| Perry Hall: | 2.6 |
| Garrison: | 1.1 |
| White Marsh: | 31.9 |
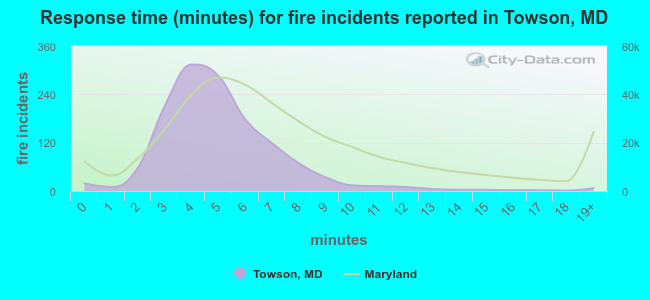 The median response time based on all reported fire incidents is 5 minutes. This is lower than the Maryland median value.
The median response time in Towson, MD compared to nearest cities:
(Note: Based on data for all years, including only cities with at least 500 fire incidents)
| Towson: | 5 minutes |
| Parkville: | 5 minutes |
| Pikesville: | 5 minutes |
| Cockeysville: | 5 minutes |
| Baltimore: | 6 minutes |
| Owings Mills: | 6 minutes |
| Middle River: | 5 minutes |
| Randallstown: | 5 minutes |
| Essex: | 5 minutes |
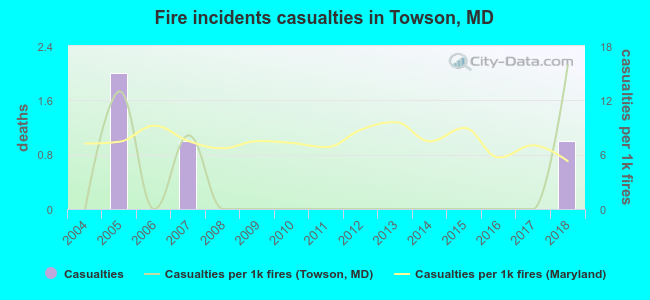 According to the reports from the years 2004 - 2018 the average number of fire-related yearly casualties is 0. The highest number of reported injuries - 2 took place in 2005, and the lowest - 0 in 2004. The data has an increasing trend.
The average number of casualties per 1,000 fire incidents is 2. This indicator was the highest - 16 in 2018, and the lowest 0 in 2004. The trend for casualties per 1,000 fires is rising. Compared to the state value the number of casualties per 1,000 fires is much lower.
According to the reports from the years 2004 - 2018 the average number of fire-related yearly casualties is 0. The highest number of reported injuries - 2 took place in 2005, and the lowest - 0 in 2004. The data has an increasing trend.
The average number of casualties per 1,000 fire incidents is 2. This indicator was the highest - 16 in 2018, and the lowest 0 in 2004. The trend for casualties per 1,000 fires is rising. Compared to the state value the number of casualties per 1,000 fires is much lower.Casualties per 1,000 incidents in Towson, MD compared to nearest cities:
(Note: Based on data for all years, including only cities with at least 500 fire incidents)
| Towson: | 2.9 |
| Parkville: | 6.2 |
| Pikesville: | 4.2 |
| Cockeysville: | 4.4 |
| Baltimore: | 11.4 |
| Owings Mills: | 4.6 |
| Middle River: | 2.7 |
| Randallstown: | 7.7 |
| Essex: | 4.9 |
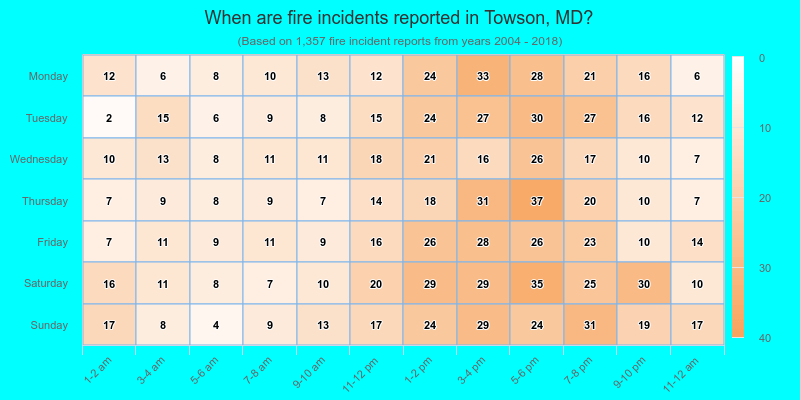
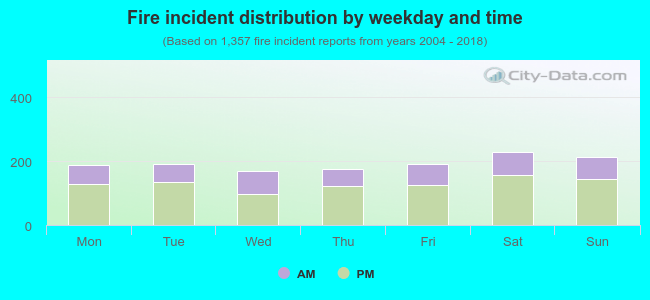 32.7% incidents where reported in the morning and 67.3% in the evening. The most fires (16.9%) took place on Saturday, and the least (12.4%) on Wednesday.
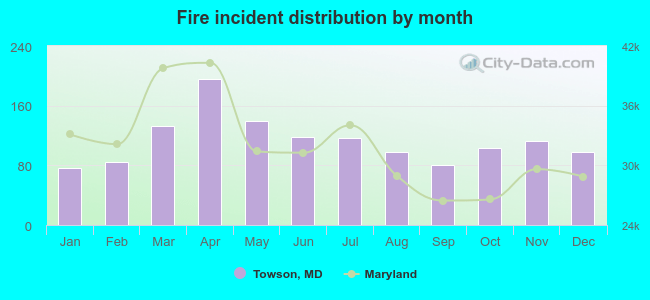 According to the 1,357 reports from years 2004 - 2018 most fires (14.4%) took place during April, and the least (5.6%) in January.
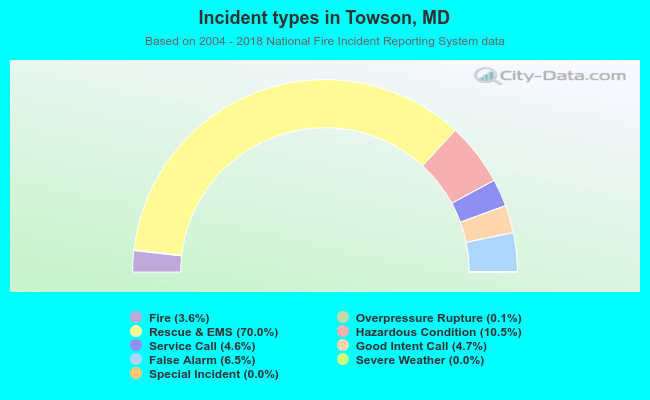 Out of all 37,967 cases reported during the years 2004 - 2018, the most belonged to the categories: Rescue & EMS (70.0%), Hazardous Condition (10.5%), and False Alarm (6.5%).
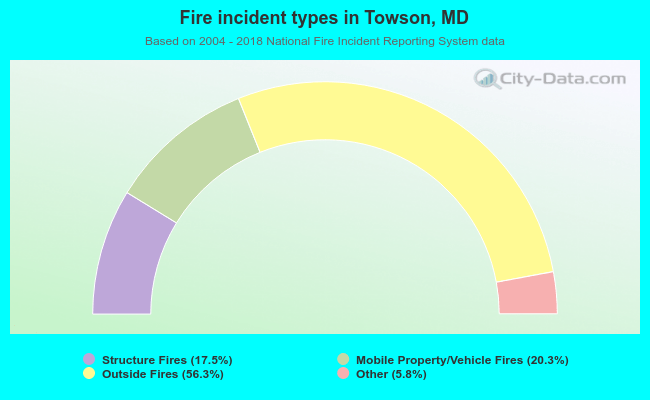 When looking into fire subcategories, the most incidents belonged to: Outside Fires (56.3%), and Mobile Property/Vehicle Fires (20.3%).