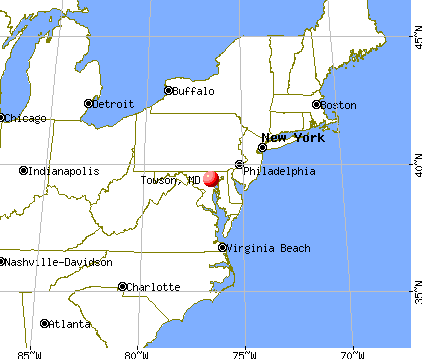
Towson, Maryland

Towson: Towson University
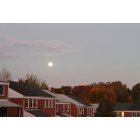
Towson: Full Moon Over Rowhouses

Towson: Fresh fruit at the Towson Farmer's Market

Towson: Fall trees dripping with color

Towson: Snow laden trees at Towson High School
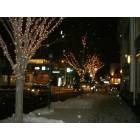
Towson: Towson Feb '07 After the snow
- add
your
Submit your own pictures of this place and show them to the world
- OSM Map
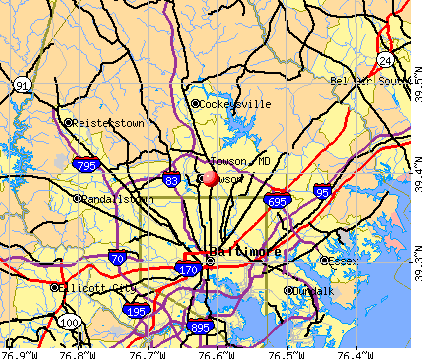
- General Map
- Google Map
- MSN Map
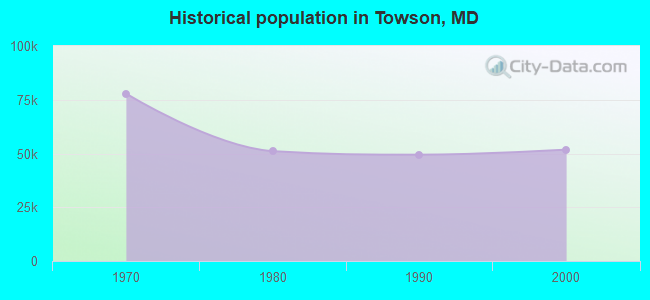
Population change since 2000: +6.6%
| Males: 25,438 | |
| Females: 29,759 |
| Median resident age: | 34.3 years |
| Maryland median age: | 39.7 years |
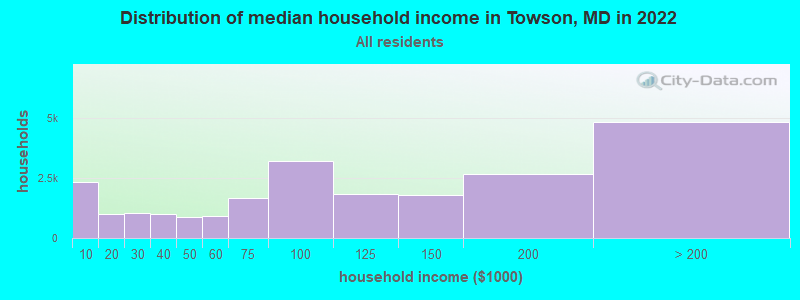
| Towson: | $96,604 |
| MD: | $94,991 |
Estimated per capita income in 2022: $57,911 (it was $32,502 in 2000)
Towson CDP income, earnings, and wages data
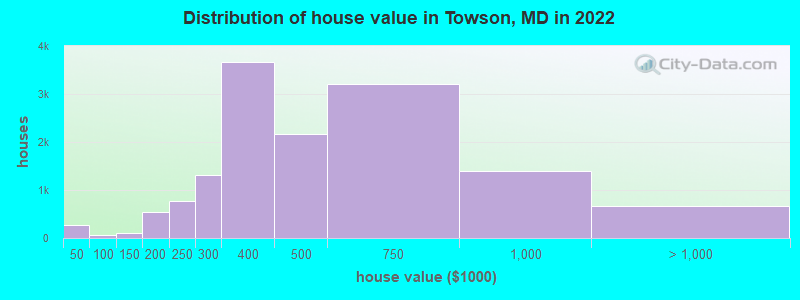
Estimated median house or condo value in 2022: $432,786 (it was $155,800 in 2000)
| Towson: | $432,786 |
| MD: | $398,100 |
Mean prices in 2022: all housing units: $502,666; detached houses: $604,132; townhouses or other attached units: $365,534; in 2-unit structures: $376,915; in 3-to-4-unit structures: $187,596; in 5-or-more-unit structures: $347,414
Median gross rent in 2022: $1,669.
(11.5% for White Non-Hispanic residents, 12.9% for Black residents, 7.9% for Hispanic or Latino residents, 9.4% for other race residents, 16.0% for two or more races residents)
Detailed information about poverty and poor residents in Towson, MD


Compare current foreclosures in Towson, MD:
| Photo | Address | Area | Beds / Baths | Price | Details |
|---|---|---|---|---|---|

|
#1
Lambourne Rd Unit 505
Towson, MD 21204
|
1,439 sq. feet
|
1 baths - beds |
show details | |

|
#2
Charles Spring Way
Towson, MD 21204
|
2,412 sq. feet
|
2 baths - beds |
show details | |

|
#3
Drumwood Rd
Towson, MD 21286
|
1,580 sq. feet
|
1 baths - beds |
show details | |

|
#4
Putty Hill Ave
Towson, MD 21286
|
1,740 sq. feet
|
1 baths - beds |
show details | |

|
#5
Putty Hill Ave
Towson, MD 21286
|
1,580 sq. feet
|
1 baths - beds |
show details | |

|
#6
Skidmore Ct
Towson, MD 21204
|
1,555 sq. feet
|
1 baths - beds |
show details | |

|
#7
Landrake Rd
Towson, MD 21204
|
2,448 sq. feet
|
3 baths - beds |
show details | |

|
#8
Hampton Garth
Towson, MD 21286
|
2,823 sq. feet
|
2 baths - beds |
show details | |

|
#9
Lacosta Ct
Towson, MD 21204
|
2,560 sq. feet
|
3 baths - beds |
show details | |

|
#10
Loch Ness Rd
Towson, MD 21286
|
1,473 sq. feet
|
2 baths - beds |
show details |
| Photo | Address | Area | Beds / Baths | Price | Details |
|---|---|---|---|---|---|

|
#11
Loch Raven Blvd
Towson, MD 21286
|
1,350 sq. feet
|
1 baths - beds |
show details | |

|
#12
Loch Raven Blvd
Towson, MD 21286
|
1,473 sq. feet
|
1 baths - beds |
show details | |

|
#13
Hampton Ln
Towson, MD 21286
|
3,072 sq. feet
|
3 baths - beds |
show details | |

|
#14
Loch Ness Rd
Towson, MD 21286
|
1,800 sq. feet
|
1 baths - beds |
show details | |

|
#15
Jacobo Ln
Towson, MD 21286
|
2,042 sq. feet
|
2 baths - beds |
show details | |

|
#16
Aberdeen Rd
Towson, MD 21286
|
1,430 sq. feet
|
1 baths - beds |
show details | |

|
#17
Airway Cir Apt 4b
Towson, MD 21286
|
- sq. feet
|
- baths - beds |
show details | |

|
#18
E Joppa Rd Ste Ph12
Towson, MD 21286
|
- sq. feet
|
- baths - beds |
show details | |

|
#19
Southerly Rd # 438
Towson, MD 21204
|
- sq. feet
|
- baths - beds |
show details | |

|
#20
Versailles Cir Apt B
Towson, MD 21204
|
- sq. feet
|
- baths - beds |
show details |
| Photo | Address | Area | Beds / Baths | Price | Details |
|---|---|---|---|---|---|

|
#21
Stonewain Ct Apt 4a
Towson, MD 21204
|
- sq. feet
|
- baths - beds |
show details | |

|
#22
Hillen Rd
Towson, MD 21286
|
- sq. feet
|
- baths - beds |
show details | |

|
#23
Washington Ave Apt 517
Towson, MD 21204
|
- sq. feet
|
- baths - beds |
show details | |

|
#24
Washington Ave Apt 310
Towson, MD 21204
|
- sq. feet
|
- baths - beds |
show details | |

|
#25
Treeway Ct Apt 4a
Towson, MD 21286
|
- sq. feet
|
- baths - beds |
show details | |

|
#26
Osler Dr Ste 205
Towson, MD 21204
|
- sq. feet
|
- baths - beds |
show details | |

|
#27
Stevenson Ln Apt C2
Towson, MD 21204
|
- sq. feet
|
- baths - beds |
show details | |

|
#28
Southerly Rd # 343
Towson, MD 21204
|
- sq. feet
|
- baths - beds |
show details | |

|
#29
Charles Street Ave Apt B
Towson, MD 21204
|
- sq. feet
|
- baths - beds |
show details | |

|
#30
E Joppa Rd Ste 210
Towson, MD 21286
|
- sq. feet
|
- baths - beds |
show details |
| Photo | Address | Area | Beds / Baths | Price | Details |
|---|---|---|---|---|---|

|
#31
E Joppa Rd Ste 1212
Towson, MD 21286
|
- sq. feet
|
- baths - beds |
show details | |

|
#32
Aberdeen Rd, Apt B
Towson, MD 21286
|
- sq. feet
|
- baths - beds |
show details | |

|
#33
Edgewood Rd
Towson, MD 21286
|
- sq. feet
|
- baths - beds |
show details | |

|
#34
Stevenson Ln Apt C5
Towson, MD 21204
|
- sq. feet
|
- baths - beds |
show details | |

|
#35
Castlegate Ct
Towson, MD 21204
|
- sq. feet
|
- baths - beds |
show details | |

|
#36
Aylway, Circle 18
Towson, MD 21286
|
- sq. feet
|
- baths - beds |
show details | |

|
#37
Washington Ave, Apt 616
Towson, MD 21204
|
- sq. feet
|
- baths - beds |
show details | |

|
#38
Kenilworth Park Dr Apt 2c
Towson, MD 21204
|
- sq. feet
|
- baths - beds |
show details | |

|
#39
Clyde Bank Rd
Towson, MD 21286
|
- sq. feet
|
- baths - beds |
show details | |

|
#40
Southerly Rd
Towson, MD 21204
|
- sq. feet
|
- baths - beds |
show details |
| Photo | Address | Area | Beds / Baths | Price | Details |
|---|---|---|---|---|---|

|
#41
Stepford Road
Towson, MD 21286
|
- sq. feet
|
- baths - beds |
show details | |

|
#42
Edgewood Rd
Towson, MD 21286
|
- sq. feet
|
- baths - beds |
show details | |

|
#43
Lambourne Rd Apt T2
Towson, MD 21204
|
- sq. feet
|
- baths - beds |
show details | |

|
#44
Mylander Ln, Apt 2049
Towson, MD 21286
|
- sq. feet
|
- baths - beds |
show details | |

|
Check over 1 million property listings on Foreclosure.com!
|
browse all offers | |||


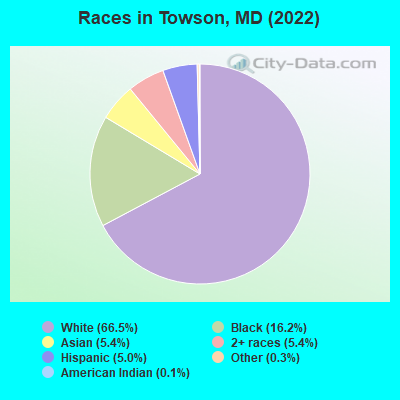
- 38,12466.5%White alone
- 9,26016.2%Black alone
- 3,1225.4%Asian alone
- 3,1195.4%Two or more races
- 2,8945.0%Hispanic
- 1860.3%Other race alone
- 630.1%American Indian alone
- 270.05%Native Hawaiian and Other
Pacific Islander alone
Races in Towson detailed stats: ancestries, foreign born residents, place of birth
According to our research of Maryland and other state lists, there were 23 registered sex offenders living in Towson, Maryland as of April 27, 2024.
The ratio of all residents to sex offenders in Towson is 2,546 to 1.
The ratio of registered sex offenders to all residents in this city is much lower than the state average.
 Recent articles from our blog. Our writers, many of them Ph.D. graduates or candidates, create easy-to-read articles on a wide variety of topics.

 | New Work in Towson need BWI Access Weekly (21 replies) |
| What Town for Temporary Relocation to Towson with Good Access to BWI (2 replies) |
| Questions about moving to Towson (7 replies) |
| Hardwood flooring apartment near Towson (1 reply) |
| Towson vs. Bowie vs. Waldorf (7 replies) |
| Bowie vs. Waldorf vs. Towson (3 replies) |
Latest news from Towson, MD collected exclusively by city-data.com from local newspapers, TV, and radio stations
Towson, MD City Guides:
Ancestries: Irish (8.4%), German (7.2%), American (7.2%), English (6.6%), Italian (4.8%), European (3.9%).
Current Local Time: EST time zone
Elevation: 460 feet
Land area: 14.0 square miles.
Population density: 3,931 people per square mile (average).
6,264 residents are foreign born (4.7% Asia, 2.3% Africa, 1.6% Europe, 1.3% Latin America).
| This place: | 10.9% |
| Maryland: | 15.7% |
Median real estate property taxes paid for housing units with mortgages in 2022: $4,446 (1.0%)
Median real estate property taxes paid for housing units with no mortgage in 2022: $4,110 (1.1%)
Nearest city with pop. 200,000+: Baltimore, MD  (5.9 miles , pop. 651,154).
Nearest city with pop. 1,000,000+: Philadelphia, PA (88.5 miles , pop. 1,517,550).
Nearest cities:
), ), ), ), ), ), )Latitude: 39.39 N, Longitude: 76.61 W
Daytime population change due to commuting: +33,707 (+58.8%)
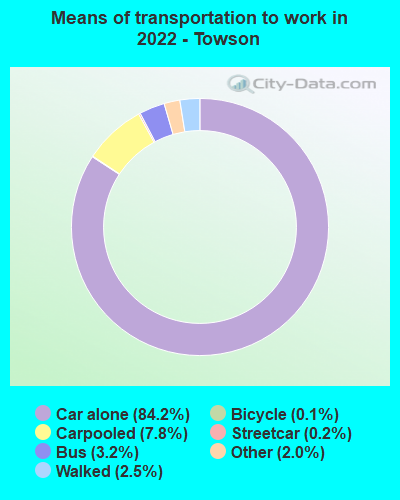
Workers who live and work in this place: 12,537 (43.7%)
Area codes: 410, 443
Property values in Towson, MD
Towson tourist attractions:
| Here: | 2.1% |
| Maryland: | 2.0% |
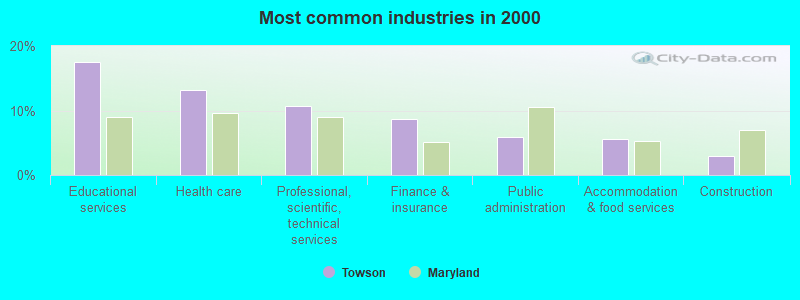
- Educational services (17.5%)
- Health care (13.2%)
- Professional, scientific, technical services (10.6%)
- Finance & insurance (8.6%)
- Public administration (6.0%)
- Accommodation & food services (5.5%)
- Construction (3.0%)
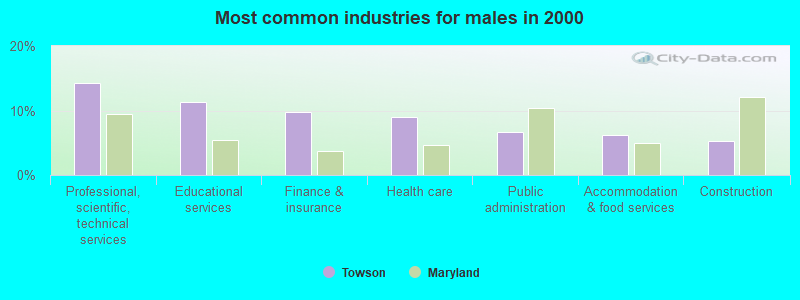
- Professional, scientific, technical services (14.3%)
- Educational services (11.3%)
- Finance & insurance (9.8%)
- Health care (9.1%)
- Public administration (6.6%)
- Accommodation & food services (6.1%)
- Construction (5.3%)
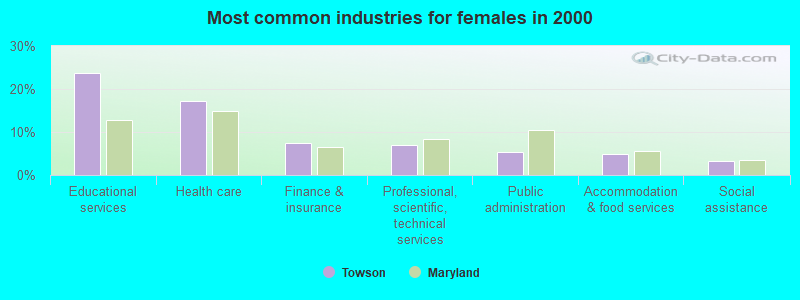
- Educational services (23.7%)
- Health care (17.3%)
- Finance & insurance (7.4%)
- Professional, scientific, technical services (7.0%)
- Public administration (5.3%)
- Accommodation & food services (4.9%)
- Social assistance (3.2%)
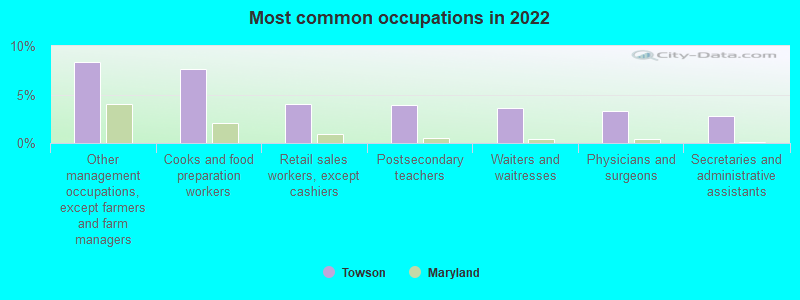
- Other management occupations, except farmers and farm managers (8.3%)
- Cooks and food preparation workers (7.6%)
- Retail sales workers, except cashiers (4.0%)
- Postsecondary teachers (3.9%)
- Waiters and waitresses (3.6%)
- Physicians and surgeons (3.3%)
- Secretaries and administrative assistants (2.7%)
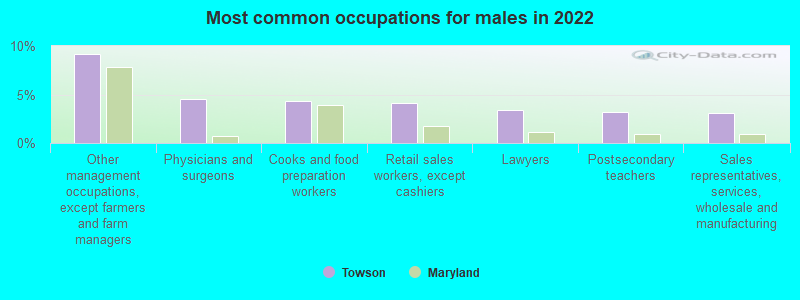
- Other management occupations, except farmers and farm managers (9.2%)
- Physicians and surgeons (4.5%)
- Cooks and food preparation workers (4.3%)
- Retail sales workers, except cashiers (4.1%)
- Lawyers (3.4%)
- Postsecondary teachers (3.2%)
- Sales representatives, services, wholesale and manufacturing (3.0%)
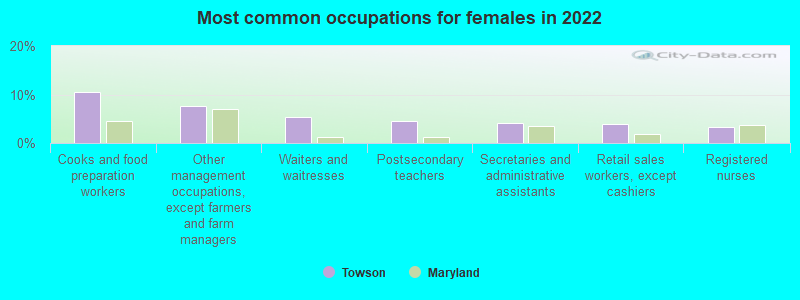
- Cooks and food preparation workers (10.5%)
- Other management occupations, except farmers and farm managers (7.5%)
- Waiters and waitresses (5.4%)
- Postsecondary teachers (4.6%)
- Secretaries and administrative assistants (4.2%)
- Retail sales workers, except cashiers (3.9%)
- Registered nurses (3.4%)
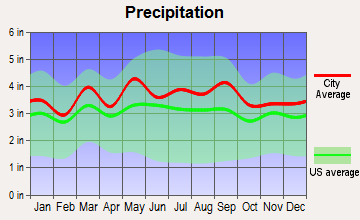
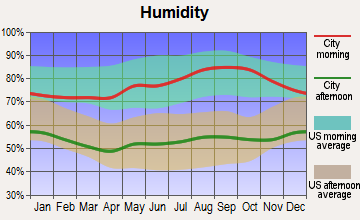
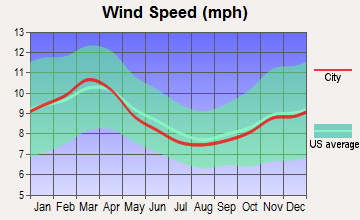
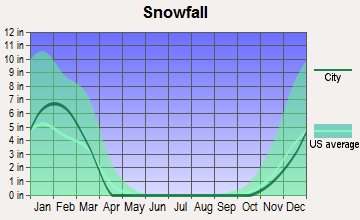
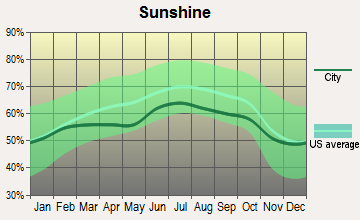
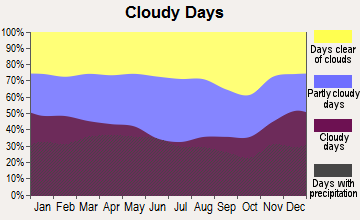
Average climate in Towson, Maryland
Based on data reported by over 4,000 weather stations

|
|

(lower is better)
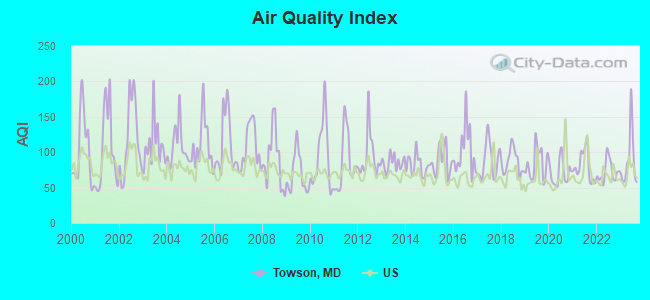
Air Quality Index (AQI) level in 2023 was 87.3. This is worse than average.
| City: | 87.3 |
| U.S.: | 72.6 |
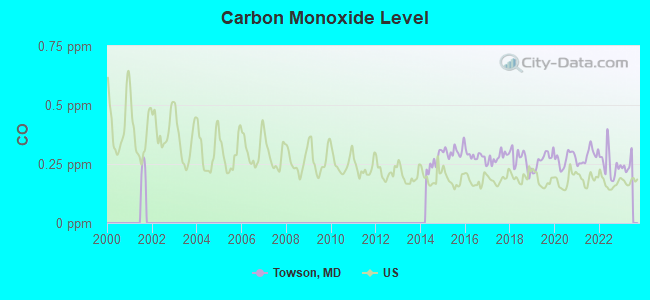
Carbon Monoxide (CO) [ppm] level in 2022 was 0.250. This is about average. Closest monitor was 1.0 miles away from the city center.
| City: | 0.250 |
| U.S.: | 0.251 |
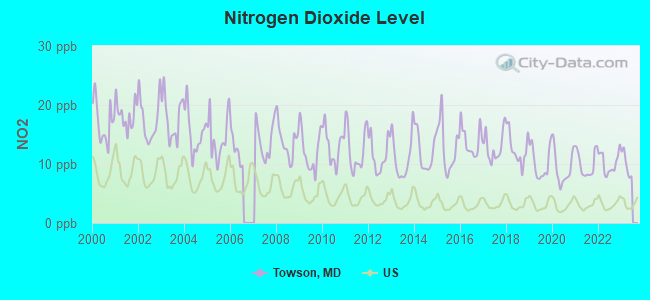
Nitrogen Dioxide (NO2) [ppb] level in 2022 was 10.2. This is significantly worse than average. Closest monitor was 1.0 miles away from the city center.
| City: | 10.2 |
| U.S.: | 5.1 |
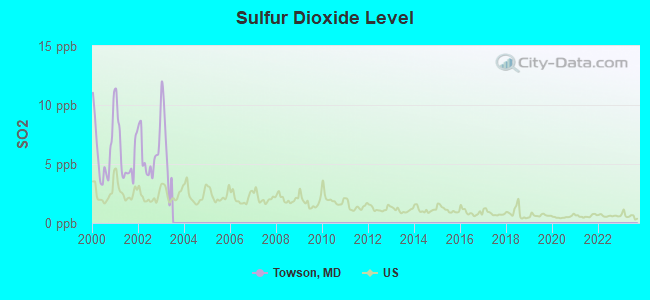
Sulfur Dioxide (SO2) [ppb] level in 2002 was 5.75. This is significantly worse than average. Closest monitor was 1.0 miles away from the city center.
| City: | 5.75 |
| U.S.: | 1.51 |
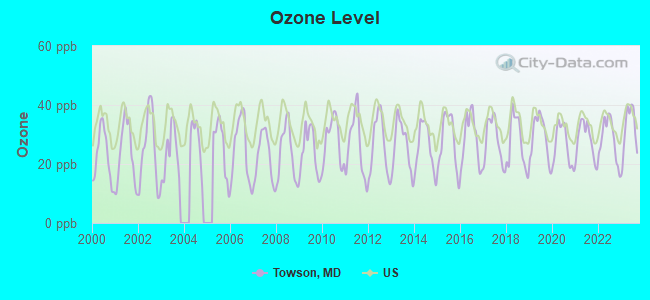
Ozone [ppb] level in 2023 was 31.8. This is about average. Closest monitor was 1.0 miles away from the city center.
| City: | 31.8 |
| U.S.: | 33.3 |
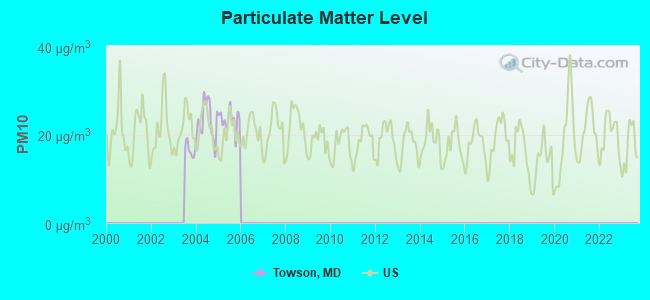
Particulate Matter (PM10) [µg/m3] level in 2005 was 23.3. This is worse than average. Closest monitor was 3.9 miles away from the city center.
| City: | 23.3 |
| U.S.: | 19.2 |
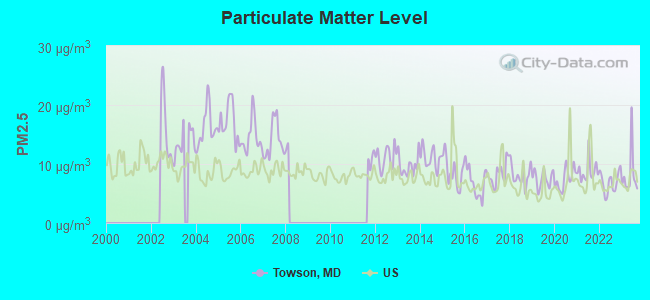
Particulate Matter (PM2.5) [µg/m3] level in 2023 was 8.15. This is about average. Closest monitor was 3.9 miles away from the city center.
| City: | 8.15 |
| U.S.: | 8.11 |
Tornado activity:
Towson-area historical tornado activity is slightly above Maryland state average. It is 19% greater than the overall U.S. average.
On 6/9/1961, a category F3 (max. wind speeds 158-206 mph) tornado 12.0 miles away from the Towson place center caused between $50,000 and $500,000 in damages.
On 9/24/2001, a category F3 tornado 16.3 miles away from the place center killed 2 people and injured 55 people and caused $101 million in damages.
Earthquake activity:
Towson-area historical earthquake activity is significantly above Maryland state average. It is 60% smaller than the overall U.S. average.On 8/23/2011 at 17:51:04, a magnitude 5.8 (5.8 MW, Depth: 3.7 mi, Class: Moderate, Intensity: VI - VII) earthquake occurred 125.1 miles away from the city center
On 1/16/1994 at 01:49:16, a magnitude 4.6 (4.6 MB, 4.6 LG, Depth: 3.1 mi, Class: Light, Intensity: IV - V) earthquake occurred 71.6 miles away from the city center
On 9/25/1998 at 19:52:52, a magnitude 5.2 (4.8 MB, 4.3 MS, 5.2 LG, 4.5 MW, Depth: 3.1 mi) earthquake occurred 246.5 miles away from the city center
On 8/25/2011 at 05:07:52, a magnitude 4.5 (4.5 ML, Depth: 4.2 mi) earthquake occurred 124.0 miles away from Towson center
On 1/16/1994 at 00:42:43, a magnitude 4.2 (4.2 MB, 4.0 LG, Depth: 3.1 mi) earthquake occurred 72.1 miles away from the city center
On 12/9/2003 at 20:59:18, a magnitude 4.5 (4.5 ML, Depth: 6.2 mi) earthquake occurred 138.0 miles away from the city center
Magnitude types: regional Lg-wave magnitude (LG), body-wave magnitude (MB), local magnitude (ML), surface-wave magnitude (MS), moment magnitude (MW)
Natural disasters:
The number of natural disasters in Baltimore County (21) is greater than the US average (15).Major Disasters (Presidential) Declared: 15
Emergencies Declared: 5
Causes of natural disasters: Hurricanes: 6, Winter Storms: 5, Floods: 4, Snowstorms: 4, Storms: 4, Tropical Storms: 2, Blizzard: 1, Heavy Rain: 1, Snow: 1, Snowfall: 1, Tornado: 1, Other: 1 (Note: some incidents may be assigned to more than one category).
Main business address for: AMERICASBANK CORP (SAVINGS INSTITUTION, FEDERALLY CHARTERED), BLACK & DECKER CORP (METALWORKING MACHINERY & EQUIPMENT).
Hospitals in Towson:
- HOSPICE OF BALTIMORE (555 WEST TOWSONTOWN BOULEVARD)
- PLASTIC SRGY CNTR DR BALLESTEROS (120 SISTER PIERRE DR)
- SAINT JOSEPH MEDICAL CENTER (7601 OSLER DRIVE)
- SHEPPARD ENOCH PRATT HOSPITAL, THE (6501 N CHARLES STREET PO BOX 6815)
- UNIVERSITY OF MARYLAND ST JOSEPH MEDICAL CENTER (Voluntary non-profit - Private, provides emergency services, 7601 OSLER DRIVE)
Nursing Homes in Towson:
- CHESTNUT GRN HLTH CTR BLAKEHUR (1055 WEST JOPPA ROAD)
- DULANEY TOWSON NSG CONV CTR (111 WEST ROAD)
- HOLLY HILL MANOR NRSG HM (531 STEVENSON LA)
- HOLLY HILL NURSING AND REHABILITATION CENTER (531 STEVENSON LANE)
- MANORCARE HEALTH SERVICES - DULANEY (111 WEST ROAD)
- MANORCARE HEALTH SERVICES - RUXTON (7001 CHARLES STREET)
- MANORCARE HEALTH SERVICES -TOWSON (509 EAST JOPPA ROAD)
- PICKERSGILL HOME (615 CHESTNUT LN)
- PICKERSGILL RETIREMENT COMMUNITY (615 CHESTNUT AVE)
- THE TRAN. CARE UNIT ST. JOSEPH (7601 OSLER DRIVE)
Dialysis Facilities in Towson:
Home Health Centers in Towson:
Heliports located in Towson:
See details about Heliports located in Towson, MDAmtrak stations near Towson:
- 6 miles: BALTIMORE (1500 N. CHARLES ST.) . Services: ticket office, fully wheelchair accessible, enclosed waiting area, public restrooms, public payphones, full-service food facilities, snack bar, vending machines, ATM, paid short-term parking, paid long-term parking, call for car rental service, taxi stand, public transit connection.
- 15 miles: BWI AIRPORT RAIL STATION (BALTIMORE, AMTRAK WAY) . Services: ticket office, fully wheelchair accessible, enclosed waiting area, public restrooms, public payphones, snack bar, ATM, paid short-term parking, paid long-term parking, call for car rental service, call for taxi service, public transit connection.
Colleges/Universities in Towson:
- Towson University (Full-time enrollment: 19,618; Location: 8000 York Rd; Public; Website: www.towson.edu; Offers Doctor's degree)
- Fortis Institute-Towson (Full-time enrollment: 1,389; Location: 700 York Rd; Private, for-profit; Website: www.fortis.edu)
- TESST College of Technology-Towson (Full-time enrollment: 511; Location: 803 Glen Eagles Ct; Private, for-profit; Website: www.tesst.com/towson-md/)
Other colleges/universities with over 2000 students near Towson:
- Loyola University Maryland (about 4 miles; Baltimore, MD; Full-time enrollment: 5,215)
- Morgan State University (about 4 miles; Baltimore, MD; FT enrollment: 7,113)
- Johns Hopkins University (about 5 miles; Baltimore, MD; FT enrollment: 20,568)
- Stevenson University (about 6 miles; Stevenson, MD; FT enrollment: 3,862)
- Baltimore City Community College (about 6 miles; Baltimore, MD; FT enrollment: 3,560)
- Maryland Institute College of Art (about 6 miles; Baltimore, MD; FT enrollment: 2,267)
- University of Baltimore (about 7 miles; Baltimore, MD; FT enrollment: 3,592)
Public high schools in Towson:
- GEORGE W. CARVER CENTER FOR ARTS & TECHNOLOGY (Location: 938 YORK RD, Grades: 9-12)
- TOWSON HIGH LAW & PUBLIC POLICY (Location: 69 CEDAR AVE, Grades: 9-12)
- BALTIMORE COUNTY DETENTION CENTER (Location: 720 BOSLEY AVENUE, Grades: 9-12)
Private high schools in Towson:
- LOYOLA BLAKEFIELD (Students: 1,004, Location: 500 CHESTNUT AVE, Grades: 6-12, Boys only)
- NOTRE DAME PREPARATORY SCHOOL (Students: 772, Location: 815 HAMPTON LN, Grades: 6-12, Girls only)
- BALTIMORE LUTHERAN SCHOOL (Students: 275, Location: 1145 CONCORDIA DR, Grades: 6-12)
- THE MANN RESIDENTIAL SCHOOL (Students: 59, Location: 6501 N CHARLES ST - A BUILDING, Grades: 7-12)
Public elementary/middle schools in Towson:
- PLEASANT PLAINS ELEMENTARY (Location: 8300 PLEASANT PLAINS RD, Grades: PK-5)
- RIDERWOOD ELEMENTARY (Location: 1711 LANDRAKE RD, Grades: KG-5)
Private elementary/middle schools in Towson:
User-submitted facts and corrections:
- Private High Schools should include Calvert Hall College
- Under "Public Primary/Middle Schools in Towson," you need to add Rodgers Forge Elementary School, Stoneleigh Elementary School and Dumbarton Middle School.
Points of interest:
Notable locations in Towson: Country Club of Maryland (A), Elkridge Hunt Club (B), Rodgers Forge Golf Course (C), Towson Industrial Park (D), Valley Country Club (E), Glen Parking Garage (F), Towsontown Parking Garage (G), Union Parking Garage (H), Baltimore County Courthouse (I), Baltimore County Jail (J), Presbyterian Home of Maryland (K), Baltimore County Fire Department Station 11 Hillendale (L), Baltimore County Fire Department Station 1 Towson (M), Winslow House (N), Welsh Gymnasium (O), Wagner House (P), Von Borries Swimming Pool (Q), Van Meter Hall (R), Tuttle House (S), Todd Dance Studio (T). Display/hide their locations on the map
Shopping Centers: Dulaney Plaza Shopping Center (1), Shops at Kenilworth Shopping Center (2), Loch Raven Plaza Shopping Center (3), Ravenwood Shopping Center (4), Towson Market Place Shopping Center (5), Towson Plaza Shopping Center (6), Towson Town Shopping Center (7), Anneslie Shopping Center (8), York Road Plaza Shopping Center (9). Display/hide their locations on the map
Main business address in Towson include: AMERICASBANK CORP (A), BLACK & DECKER CORP (B). Display/hide their locations on the map
Churches in Towson include: Ascension Evangelical Lutheran Church (A), Calvary Baptist Church (B), Central Presbyterian Church (C), First Lutheran Church (D), Haebler Memorial Church (E), Helpers of the Sacred Heart Mission (F), Holy Cross Lutheran Church (G), Idlewylde United Methodist Church (H), Immaculate Conception Roman Catholic Church (I). Display/hide their locations on the map
Cemeteries: Prospect Hill Park Cemetery (1), Honeysuckle Cemetery (2). Display/hide their locations on the map
Lakes and reservoirs: Cochrans Pond (A), Lake Roland (B). Display/hide their locations on the map
Streams, rivers, and creeks: Towson Run (A), Slaughterhouse Branch (B), Moores Branch (C), Roland Run (D). Display/hide their locations on the map
Parks in Towson include: Jones Falls Park (1), Riverdale Park (2), Robert E Lee Park (3), Beldon Athletic Field (4), Schuerholz Baseball Complex (5), Unitas Stadium (6), Lake Roland Park (7), Glendale Park (8), Riderwood Hills Park (9). Display/hide their locations on the map
Tourist attractions: Baltimore County - Libraries Administration- Woodlawn Branch (Cultural Attractions- Events- & Facilities; 1811 Woodlawn Drive) (1), Baltimore County - Libraries- Branches- Reisterstown (Cultural Attractions- Events- & Facilities; Cockeys Mill Road) (2), Baltimore County - Libraries- Branches- Randallstown (Cultural Attractions- Events- & Facilities; 8604 Liberty Road) (3), Club Room Billiards (Amusement & Theme Parks; Towson Town Centre) (4), Amf Towson Lanes (Amusement & Theme Parks; 701 Southwick Drive) (5), Baltimore County Conference & Visitors Bureau (825 Dulaney Valley Road) (6). Display/hide their approximate locations on the map
Hotels: Comfort Inn Baltimore Towson (Loch Raven Boulevard & 69) (1), Days Hotel Timonium Padonia Ballroom (9615 Deereco Road) (2), Towson East Motel (1507 East Joppa Road) (3), Marriott Conference Center Burkshire (10 West Burke Avenue) (4). Display/hide their approximate locations on the map
Courts: Baltimore County - Orphans Court (401 Bosley Avenue) (1), Pga Court Towers (210 West Pennsylvania Avenue) (2). Display/hide their approximate locations on the map
Birthplace of: Divine (actor) - Dance musician, Kimmie Meissner - Figure skater, Glen Milstead, Kevin Huntley (lacrosse) - Lacrosse player, Andrew Combs - Lacrosse player, Spencer Ford - Lacrosse player, Matt Stevenson - College basketball player (Drexel Dragons), Bill Stromberg - Football player.
| This place: | 2.2 people |
| Maryland: | 2.6 people |
| This place: | 52.9% |
| Whole state: | 67.1% |
| This place: | 4.9% |
| Whole state: | 6.4% |
Likely homosexual households (counted as self-reported same-sex unmarried-partner households)
- Lesbian couples: 0.6% of all households
- Gay men: 0.3% of all households
People in group quarters in Towson in 2010:
- 5,442 people in college/university student housing
- 1,322 people in local jails and other municipal confinement facilities
- 1,262 people in nursing facilities/skilled-nursing facilities
- 77 people in other noninstitutional facilities
- 68 people in residential treatment centers for juveniles (non-correctional)
- 51 people in emergency and transitional shelters (with sleeping facilities) for people experiencing homelessness
- 23 people in in-patient hospice facilities
- 15 people in group homes intended for adults
- 10 people in residential treatment centers for adults
- 7 people in group homes for juveniles (non-correctional)
- 6 people in hospitals with patients who have no usual home elsewhere
People in group quarters in Towson in 2000:
- 3,990 people in college dormitories (includes college quarters off campus)
- 1,179 people in local jails and other confinement facilities (including police lockups)
- 743 people in nursing homes
- 192 people in mental (psychiatric) hospitals or wards
- 71 people in other nonhousehold living situations
- 54 people in religious group quarters
- 23 people in other group homes
- 22 people in homes for the mentally retarded
- 13 people in other noninstitutional group quarters
Banks with most branches in Towson (2011 data):
- Manufacturers and Traders Trust Company: Towson Branch, Towson York Road Branch, Goucher Boulevard Shoppers Branch, Hillendale Branch, Ruxton Branch, Burke Avenue Branch. Info updated 2011/08/08: Bank assets: $76,887.1 mil, Deposits: $60,064.2 mil, headquarters in Buffalo, NY, positive income, Commercial Lending Specialization, 808 total offices, Holding Company: M&T Bank Corporation
- Bank of America, National Association: Towson Town Center Branch, Loch Raven Drive-In Branch, Towson Courthouse Branch, Loch Raven Branch, Towson Drive-In Branch. Info updated 2009/11/18: Bank assets: $1,451,969.3 mil, Deposits: $1,077,176.8 mil, headquarters in Charlotte, NC, positive income, 5782 total offices, Holding Company: Bank Of America Corporation
- Hamilton Bank: 19 W Pennsylvania Ave Branch at 19 West Pennsylvania Avenue, branch established on 1910/01/01; Administrative Office Branch at 501 Fairmount Avenue, Suite 200, branch established on 2011/05/10. Info updated 2012/01/25: Bank assets: $320.5 mil, Deposits: $282.5 mil, headquarters in Baltimore, MD, positive income, Mortgage Lending Specialization, 6 total offices
- PNC Bank, National Association: Towson Branch at 409 Washington Avenue, branch established on 1959/03/06; Towson Drive-In Branch at 21 West Pennsylvania Avenue, branch established on 1952/05/05. Info updated 2012/03/20: Bank assets: $263,309.6 mil, Deposits: $197,343.0 mil, headquarters in Wilmington, DE, positive income, Commercial Lending Specialization, 3085 total offices, Holding Company: Pnc Financial Services Group, Inc., The
- Wells Fargo Bank, National Association: Towson Branch at 25 West Chesapeake Avenue, branch established on 1964/01/27; York-Fairmount Branch at 989 Fairmount Avenue, branch established on 1977/12/08. Info updated 2011/04/05: Bank assets: $1,161,490.0 mil, Deposits: $905,653.0 mil, headquarters in Sioux Falls, SD, positive income, 6395 total offices, Holding Company: Wells Fargo & Company
- The Columbia Bank: Blakehurst Branch at 1055 West Joppa Rd, branch established on 1993/10/05; Edenwald Branch at 800 Southerly Rd, branch established on 1998/12/15. Info updated 2011/10/27: Bank assets: $1,999.5 mil, Deposits: $1,528.6 mil, headquarters in Columbia, MD, positive income, Commercial Lending Specialization, 40 total offices, Holding Company: Fulton Financial Corporation
- Susquehanna Bank: Joppa Road Branch at 1310 East Joppa Road, branch established on 1988/03/25. Info updated 2012/02/28: Bank assets: $14,849.0 mil, Deposits: $10,294.4 mil, headquarters in Lititz, PA, positive income, Commercial Lending Specialization, 308 total offices, Holding Company: Susquehanna Bancshares, Inc.
- Beal Bank, SSB: Baltimore Branch at 806 Dula Ney Valley Rd., branch established on 2011/07/18. Info updated 2011/10/26: Bank assets: $3,750.0 mil, Deposits: $2,445.6 mil, headquarters in Plano, TX, positive income, Mortgage Lending Specialization, 38 total offices
- Branch Banking and Trust Company: Towson Main Branch at 600 Washington Avenue, branch established on 1985/12/19. Info updated 2010/03/29: Bank assets: $168,867.6 mil, Deposits: $127,549.5 mil, headquarters in Winston Salem, NC, positive income, Commercial Lending Specialization, 1793 total offices, Holding Company: Bb&T Corporation
- 4 other banks with 4 local branches
For population 15 years and over in Towson:
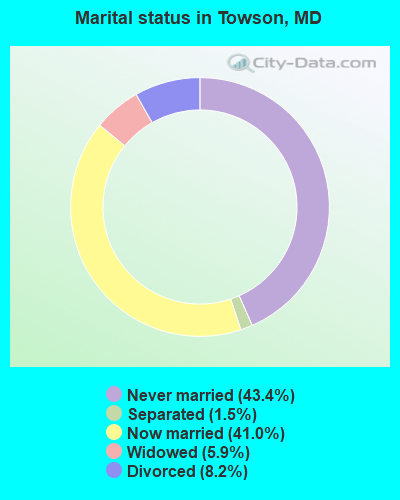
- Never married: 43.4%
- Now married: 41.0%
- Separated: 1.5%
- Widowed: 5.9%
- Divorced: 8.2%
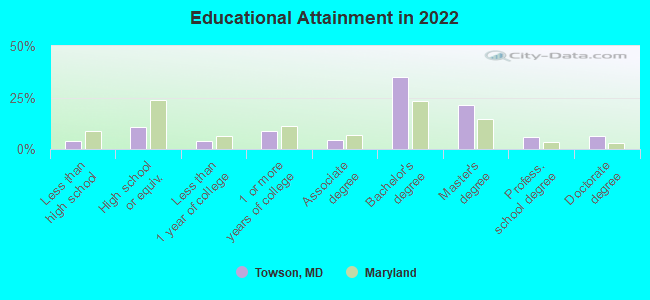
For population 25 years and over in Towson:
- High school or higher: 96.2%
- Bachelor's degree or higher: 66.9%
- Graduate or professional degree: 33.1%
- Unemployed: 3.9%
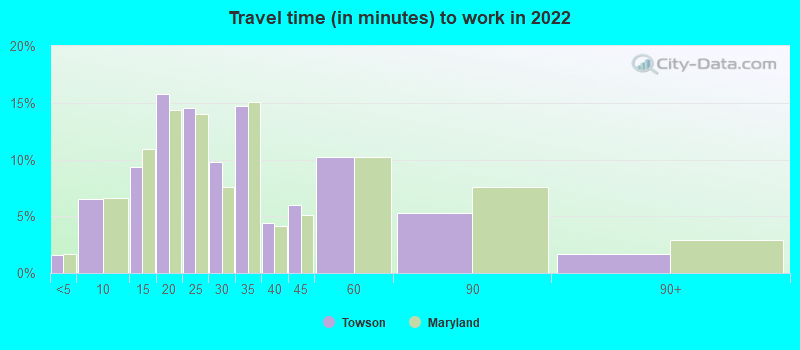
- Mean travel time to work (commute): 19.9 minutes
| Here: | 10.7 |
| Maryland average: | 12.7 |
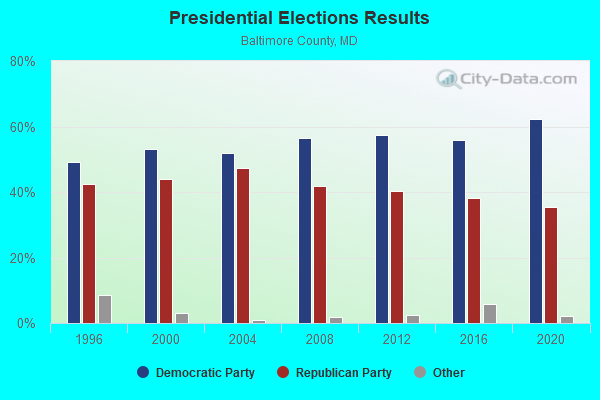
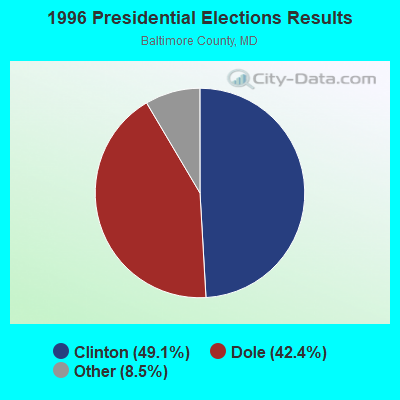
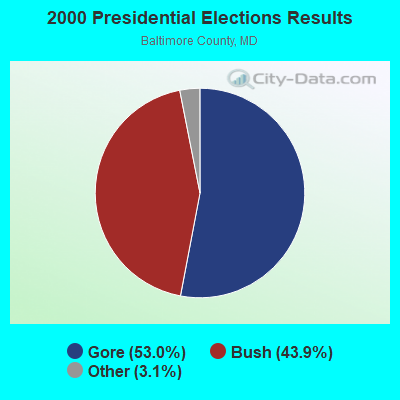
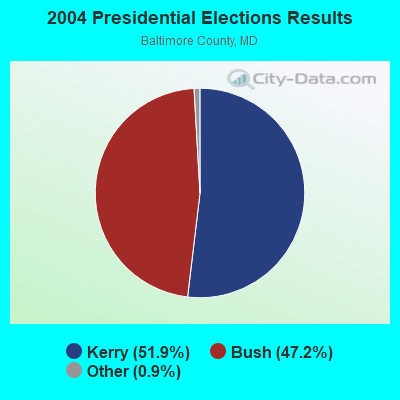

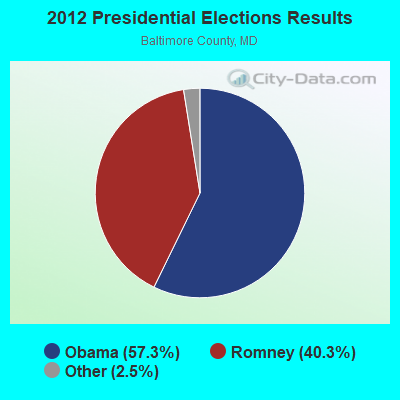
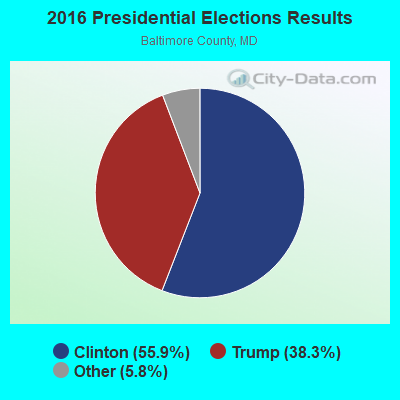
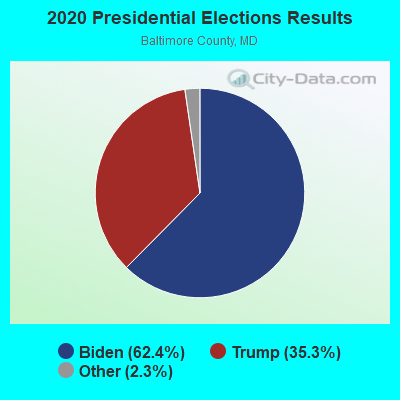
Graphs represent county-level data. Detailed 2008 Election Results
Religion statistics for Towson, MD (based on Baltimore County data)
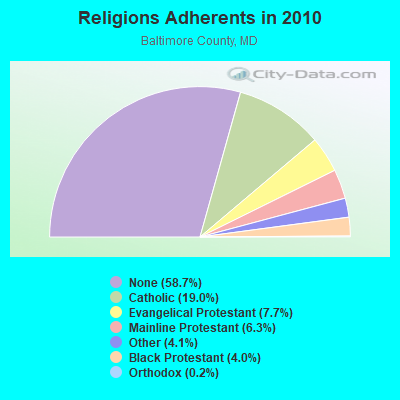
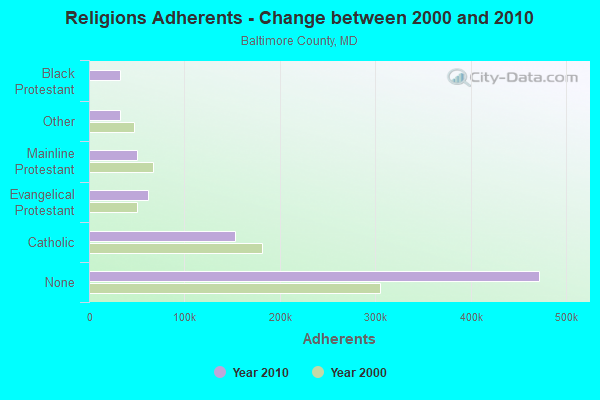
| Religion | Adherents | Congregations |
|---|---|---|
| Catholic | 153,243 | 34 |
| Evangelical Protestant | 62,367 | 232 |
| Mainline Protestant | 50,484 | 167 |
| Other | 32,628 | 54 |
| Black Protestant | 32,442 | 37 |
| Orthodox | 1,663 | 3 |
| None | 472,202 | - |
Food Environment Statistics:
| This county: | 1.74 / 10,000 pop. |
| State: | 1.96 / 10,000 pop. |
| Baltimore County: | 0.09 / 10,000 pop. |
| Maryland: | 0.07 / 10,000 pop. |
| This county: | 1.12 / 10,000 pop. |
| Maryland: | 1.22 / 10,000 pop. |
| Baltimore County: | 1.91 / 10,000 pop. |
| Maryland: | 2.05 / 10,000 pop. |
| This county: | 4.67 / 10,000 pop. |
| Maryland: | 5.40 / 10,000 pop. |
| Baltimore County: | 9.1% |
| Maryland: | 9.1% |
| Here: | 26.4% |
| Maryland: | 26.7% |
| This county: | 12.7% |
| Maryland: | 15.5% |
Health and Nutrition:
| This city: | 55.7% |
| State: | 50.1% |
| Towson: | 55.8% |
| Maryland: | 47.6% |
| This city: | 27.8 |
| Maryland: | 28.8 |
| This city: | 17.8% |
| Maryland: | 20.0% |
| Towson: | 9.8% |
| Maryland: | 11.3% |
| This city: | 7.0 |
| Maryland: | 6.8 |
| Towson: | 32.3% |
| Maryland: | 34.1% |
| This city: | 61.8% |
| Maryland: | 56.5% |
| Here: | 80.3% |
| Maryland: | 80.5% |
More about Health and Nutrition of Towson, MD Residents
6.77% of this county's 2021 resident taxpayers lived in other counties in 2020 ($67,217 average adjusted gross income)
| Here: | 6.77% |
| Maryland average: | 7.42% |
0.01% of residents moved from foreign countries ($84 average AGI)
Baltimore County: 0.01% Maryland average: 0.05%
Top counties from which taxpayers relocated into this county between 2020 and 2021:
| from Baltimore city, MD | |
| from Anne Arundel County, MD | |
| from Harford County, MD |
7.32% of this county's 2020 resident taxpayers moved to other counties in 2021 ($75,485 average adjusted gross income)
| Here: | 7.32% |
| Maryland average: | 7.91% |
0.01% of residents moved to foreign countries ($168 average AGI)
Baltimore County: 0.01% Maryland average: 0.04%
Top counties to which taxpayers relocated from this county between 2020 and 2021:
| to Baltimore city, MD | |
| to Harford County, MD | |
| to Anne Arundel County, MD |
| Businesses in Towson, MD | ||||
| Name | Count | Name | Count | |
|---|---|---|---|---|
| 7-Eleven | 3 | KFC | 1 | |
| ALDO | 1 | Kincaid | 1 | |
| AMF Bowling | 1 | Kroger | 1 | |
| AT&T | 2 | LA Fitness | 1 | |
| Abercrombie & Fitch | 1 | La-Z-Boy | 1 | |
| Abercrombie Kids | 1 | Lane Furniture | 2 | |
| Aeropostale | 1 | LensCrafters | 1 | |
| Aerosoles | 1 | Levi Strauss & Co. | 1 | |
| American Eagle Outfitters | 1 | Macy's | 1 | |
| Ann Taylor | 2 | Marriott | 1 | |
| Apple Store | 1 | Marshalls | 1 | |
| Applebee's | 1 | MasterBrand Cabinets | 1 | |
| Avenue | 1 | McDonald's | 2 | |
| BMW | 1 | Men's Wearhouse | 2 | |
| Bakers | 1 | Motherhood Maternity | 1 | |
| Bally Total Fitness | 1 | New Balance | 2 | |
| Banana Republic | 1 | New York & Co | 1 | |
| Barnes & Noble | 1 | Nike | 5 | |
| Bath & Body Works | 1 | Nordstrom | 2 | |
| Bebe | 1 | Pac Sun | 1 | |
| Bed Bath & Beyond | 1 | Panera Bread | 1 | |
| Best Western | 1 | Payless | 1 | |
| Brookstone | 1 | Penske | 1 | |
| Burger King | 1 | PetSmart | 1 | |
| CVS | 1 | Pier 1 Imports | 1 | |
| Cache | 1 | Plato's Closet | 1 | |
| Casual Male XL | 1 | Pottery Barn | 1 | |
| Chick-Fil-A | 2 | Qdoba Mexican Grill | 1 | |
| Chico's | 1 | Quiznos | 2 | |
| Chipotle | 1 | RadioShack | 1 | |
| Cinnabon | 1 | Ramada | 1 | |
| Cold Stone Creamery | 1 | Red Robin | 1 | |
| Coldwater Creek | 1 | Safeway | 1 | |
| Comfort Inn | 1 | Sephora | 1 | |
| Crate & Barrel | 1 | Soma Intimates | 1 | |
| Cricket Wireless | 1 | Spencer Gifts | 1 | |
| Curves | 1 | Sprint Nextel | 2 | |
| Domino's Pizza | 1 | Staples | 1 | |
| Dunkin Donuts | 3 | Starbucks | 7 | |
| Eddie Bauer | 1 | Subway | 5 | |
| FedEx | 17 | T-Mobile | 5 | |
| Finish Line | 1 | T.G.I. Driday's | 1 | |
| Forever 21 | 1 | T.J.Maxx | 1 | |
| GNC | 1 | Taco Bell | 1 | |
| GameStop | 3 | Talbots | 1 | |
| Gap | 1 | Target | 1 | |
| Giant | 1 | The Cheesecake Factory | 1 | |
| Gymboree | 1 | The Limited | 1 | |
| H&M | 1 | Toys"R"Us | 2 | |
| Hollister Co. | 1 | Trader Joe's | 1 | |
| Honda | 1 | U-Haul | 2 | |
| Hot Topic | 1 | UPS | 25 | |
| Hyundai | 1 | Urban Outfitters | 1 | |
| IHOP | 1 | Vans | 3 | |
| J. Jill | 1 | Verizon Wireless | 1 | |
| J.Crew | 1 | Victoria's Secret | 1 | |
| JoS. A. Bank | 1 | Vons | 1 | |
| Jones New York | 2 | Walmart | 1 | |
| Journeys | 1 | Wet Seal | 1 | |
| Justice | 1 | |||
Strongest AM radio stations in Towson:
- WWLG (1370 AM; 50 kW; BALTIMORE, MD; Owner: M-10 BROADCASTING, INC.)
- WBAL (1090 AM; 50 kW; BALTIMORE, MD; Owner: HEARST RADIO, INC.)
- WCBM (680 AM; 50 kW; BALTIMORE, MD; Owner: WCBM MARYLAND, INC.)
- WNST (1570 AM; 5 kW; TOWSON, MD)
- WGOP (700 AM; daytime; 25 kW; WALKERSVILLE, MD; Owner: BIRACH BROADCASTING CORPORATION)
- WCAO (600 AM; 5 kW; BALTIMORE, MD; Owner: CITICASTERS LICENSES, L.P.)
- WBMD (750 AM; daytime; 1 kW; BALTIMORE, MD; Owner: INFINITY RADIO OPERATIONS INC.)
- WJFK (1300 AM; 5 kW; BALTIMORE, MD; Owner: INFINITY WLIF-AM, INC.)
- WBIS (1190 AM; 50 kW; ANNAPOLIS, MD; Owner: NATIONS RADIO, LLC)
- WTEM (980 AM; 50 kW; WASHINGTON, DC; Owner: AMFM RADIO LICENSES, L.L.C.)
- WBGR (860 AM; 2 kW; BALTIMORE, MD; Owner: INFINITY RADIO OPERATIONS INC.)
- WMET (1150 AM; 50 kW; GAITHERSBURG, MD; Owner: BELTWAY ACQUISITION CORPORATION)
- WWIN (1400 AM; 1 kW; BALTIMORE, MD; Owner: RADIO ONE LICENSES, LLC)
Strongest FM radio stations in Towson:
- WTMD (89.7 FM; TOWSON, MD; Owner: TOWSON UNIVERSITY)
- WLIF (101.9 FM; BALTIMORE, MD; Owner: INFINITY WLIF, INC.)
- WWMX (106.5 FM; BALTIMORE, MD; Owner: INFINITY RADIO OPERATIONS INC.)
- WIYY (97.9 FM; BALTIMORE, MD; Owner: HEARST RADIO, INC.)
- WERQ-FM (92.3 FM; BALTIMORE, MD; Owner: RADIO ONE LICENSES, LLC)
- WYPR (88.1 FM; BALTIMORE, MD; Owner: WYPR LICENSE HOLDING LLC)
- WXYV (105.7 FM; CATONSVILLE, MD; Owner: INFINITY RADIO OPERATIONS INC.)
- WZBA (100.7 FM; WESTMINSTER, MD; Owner: SHAMROCK COMMUNICATIONS, INC.)
- WBJC (91.5 FM; BALTIMORE, MD; Owner: BALTIMORE CITY COMMUNITY COLLEGE)
- WEAA (88.9 FM; BALTIMORE, MD; Owner: MORGAN STATE COLLEGE)
- WPOC (93.1 FM; BALTIMORE, MD; Owner: CITICASTERS LICENSES, L.P.)
- WQSR (102.7 FM; BALTIMORE, MD; Owner: INFINITY OF CHESAPEAKE LICENSEE CORP.)
- WSMJ (104.3 FM; BALTIMORE, MD; Owner: CITICASTERS LICENSES, L.P.)
- WRBS (95.1 FM; BALTIMORE, MD; Owner: PETER & JOHN RADIO FELLOWSHIP, INC.)
- WWIN-FM (95.9 FM; GLEN BURNIE, MD; Owner: RADIO ONE LICENSES, LLC)
- WARM-FM (103.3 FM; YORK, PA; Owner: WSBA LICO, INC.)
- WROZ (101.3 FM; LANCASTER, PA; Owner: HALL COMMUNICATIONS, INC.)
- WSOX (96.1 FM; RED LION, PA; Owner: LANCASTER-YORK BROADCASTING, LLC)
- WYCR (98.5 FM; YORK-HANOVER, PA; Owner: RADIO HANOVER, INC.)
- WGTY (107.7 FM; GETTYSBURG, PA; Owner: TIMES AND NEWS PUBLISHING COMPANY)
TV broadcast stations around Towson:
- WMJF-LP (Channel 16; TOWSON, MD; Owner: TOWSON UNIVERSITY)
- WBFF (Channel 45; BALTIMORE, MD; Owner: CHESAPEAKE TELEVISION LICENSEE, LLC)
- WBAL-TV (Channel 11; BALTIMORE, MD; Owner: WBAL HEARST-ARGYLE TV, INC. (CA CORP.))
- WMAR-TV (Channel 2; BALTIMORE, MD; Owner: SCRIPPS HOWARD BROADCASTING COMPANY)
- WNUV (Channel 54; BALTIMORE, MD; Owner: BALTIMORE (WNUV-TV) LICENSEE, INC.)
- WJZ-TV (Channel 13; BALTIMORE, MD; Owner: VIACOM INC.)
- WMPB (Channel 67; BALTIMORE, MD; Owner: MARYLAND PUBLIC BROADCASTING COMMISSION)
- WUTB (Channel 24; BALTIMORE, MD; Owner: FOX TELEVISION STATIONS, INC.)
- WMPT (Channel 22; ANNAPOLIS, MD; Owner: MARYLAND PUBLIC BROADCASTING COMMISSION)
- WBDC-TV (Channel 50; WASHINGTON, DC; Owner: WBDC BROADCASTING, INC.)
- National Bridge Inventory (NBI) Statistics
- 26Number of bridges
- 118ft / 35.9mTotal length
- $2,515,000Total costs
- 1,122,499Total average daily traffic
- 22,750Total average daily truck traffic
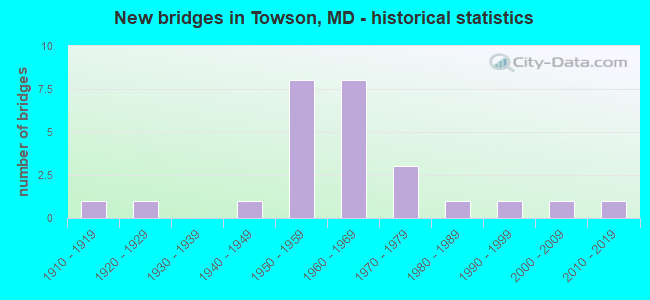
- New bridges - historical statistics
- 11910-1919
- 11920-1929
- 11940-1949
- 81950-1959
- 81960-1969
- 31970-1979
- 11980-1989
- 11990-1999
- 12000-2009
- 12010-2019
FCC Registered Antenna Towers: 36 (See the full list of FCC Registered Antenna Towers)
FCC Registered Private Land Mobile Towers: 10 (See the full list of FCC Registered Private Land Mobile Towers in Towson, MD)
FCC Registered Broadcast Land Mobile Towers: 59 (See the full list of FCC Registered Broadcast Land Mobile Towers)
FCC Registered Microwave Towers: 46 (See the full list of FCC Registered Microwave Towers in this town)
FCC Registered Paging Towers: 17 (See the full list of FCC Registered Paging Towers)
FCC Registered Amateur Radio Licenses: 107 (See the full list of FCC Registered Amateur Radio Licenses in Towson)
FAA Registered Aircraft: 17 (See the full list of FAA Registered Aircraft in Towson)
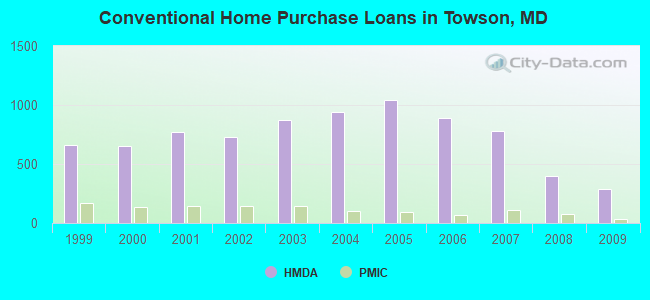
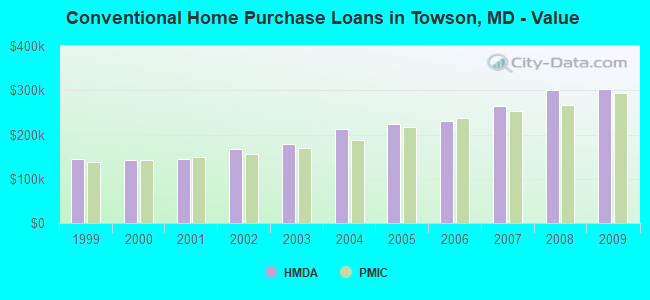
| Home Mortgage Disclosure Act Aggregated Statistics For Year 2009 (Based on 17 full and 3 partial tracts) | ||||||||||||
| A) FHA, FSA/RHS & VA Home Purchase Loans | B) Conventional Home Purchase Loans | C) Refinancings | D) Home Improvement Loans | E) Loans on Dwellings For 5+ Families | F) Non-occupant Loans on < 5 Family Dwellings (A B C & D) | |||||||
|---|---|---|---|---|---|---|---|---|---|---|---|---|
| Number | Average Value | Number | Average Value | Number | Average Value | Number | Average Value | Number | Average Value | Number | Average Value | |
| LOANS ORIGINATED | 207 | $269,597 | 292 | $303,385 | 1,541 | $265,459 | 66 | $182,783 | 4 | $16,728,570 | 65 | $227,630 |
| APPLICATIONS APPROVED, NOT ACCEPTED | 7 | $286,094 | 11 | $336,807 | 107 | $250,437 | 16 | $79,238 | 0 | $0 | 5 | $106,000 |
| APPLICATIONS DENIED | 9 | $224,109 | 12 | $291,568 | 247 | $284,012 | 21 | $74,415 | 0 | $0 | 21 | $167,639 |
| APPLICATIONS WITHDRAWN | 16 | $251,345 | 39 | $355,075 | 271 | $260,195 | 5 | $162,186 | 0 | $0 | 12 | $208,694 |
| FILES CLOSED FOR INCOMPLETENESS | 5 | $260,200 | 8 | $247,078 | 62 | $263,680 | 3 | $161,667 | 0 | $0 | 3 | $102,000 |
Detailed mortgage data for all 20 tracts in Towson, MD
| Private Mortgage Insurance Companies Aggregated Statistics For Year 2009 (Based on 16 full and 3 partial tracts) | ||||
| A) Conventional Home Purchase Loans | B) Refinancings | |||
|---|---|---|---|---|
| Number | Average Value | Number | Average Value | |
| LOANS ORIGINATED | 38 | $294,002 | 20 | $296,338 |
| APPLICATIONS APPROVED, NOT ACCEPTED | 2 | $353,180 | 3 | $282,560 |
| APPLICATIONS DENIED | 5 | $255,142 | 2 | $233,780 |
| APPLICATIONS WITHDRAWN | 0 | $0 | 5 | $242,400 |
| FILES CLOSED FOR INCOMPLETENESS | 0 | $0 | 0 | $0 |
2004 - 2018 National Fire Incident Reporting System (NFIRS) incidents
- Fire incident types reported to NFIRS in Towson, MD
- 76456.3%Outside Fires
- 27620.3%Mobile Property/Vehicle Fires
- 23817.5%Structure Fires
- 795.8%Other
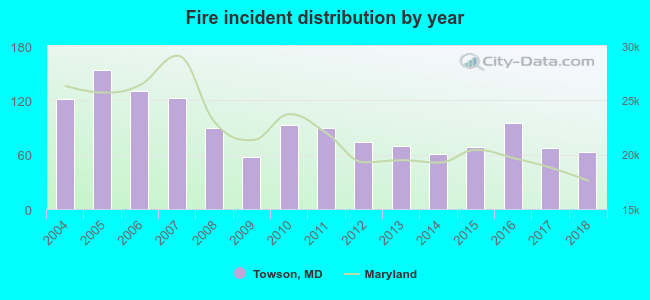 Based on the data from the years 2004 - 2018 the average number of fires per year is 90. The highest number of fires - 154 took place in 2005, and the least - 57 in 2009. The data has a declining trend.
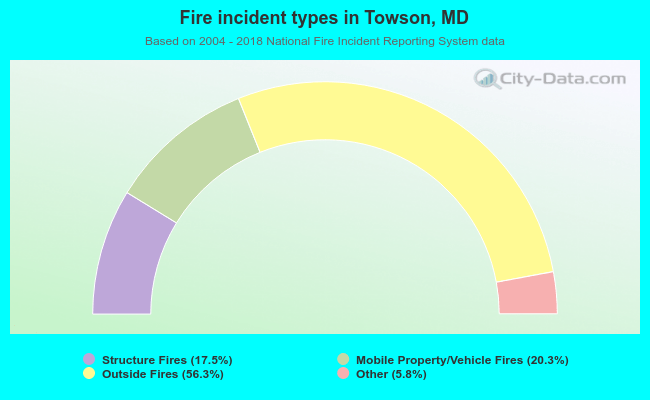 When looking into fire subcategories, the most incidents belonged to: Outside Fires (56.3%), and Mobile Property/Vehicle Fires (20.3%).
Fire-safe hotels and motels in Towson, Maryland:
- Sheraton Baltimore North Hotel, 903 Dulaney Valley Rd, Towson, Maryland 21204 , Phone: (410) 321-7400, Fax: (410) 823-9042
- Comfort Inn Towson, 8801 Loch Raven Blvd, Towson, Maryland 21286 , Phone: (410) 882-0900, Fax: (410) 882-4176
- Best Western Plus Towson Baltimore North Hotel And Suites, 1100 Cromwell Bridge Rd, Towson, Maryland 21286 , Phone: (410) 823-4410, Fax: (410) 296-6618
- Days Inn Towson, 8712 Loch Raven Blvd, Towson, Maryland 21286 , Phone: (410) 823-8750, Fax: (410) 823-8644
| Most common first names in Towson, MD among deceased individuals | ||
| Name | Count | Lived (average) |
|---|---|---|
| Mary | 702 | 83.1 years |
| John | 535 | 77.0 years |
| William | 479 | 77.1 years |
| Margaret | 425 | 82.2 years |
| Charles | 329 | 77.6 years |
| Helen | 322 | 82.6 years |
| James | 291 | 76.2 years |
| Elizabeth | 284 | 81.8 years |
| George | 273 | 77.6 years |
| Robert | 252 | 75.3 years |
| Most common last names in Towson, MD among deceased individuals | ||
| Last name | Count | Lived (average) |
|---|---|---|
| Smith | 174 | 79.4 years |
| Miller | 108 | 79.8 years |
| Jones | 71 | 79.5 years |
| Johnson | 65 | 77.8 years |
| Williams | 64 | 80.1 years |
| Brown | 59 | 82.4 years |
| White | 53 | 77.8 years |
| Moore | 48 | 80.2 years |
| Taylor | 46 | 82.3 years |
| Wilson | 44 | 82.0 years |
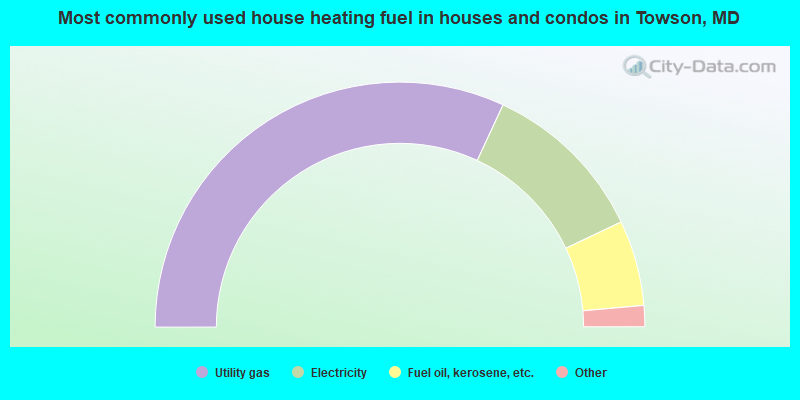
- 63.9%Utility gas
- 22.1%Electricity
- 11.3%Fuel oil, kerosene, etc.
- 1.7%Bottled, tank, or LP gas
- 0.3%Other fuel
- 0.2%Solar energy
- 0.2%Wood
- 0.1%Coal or coke
- 0.1%No fuel used
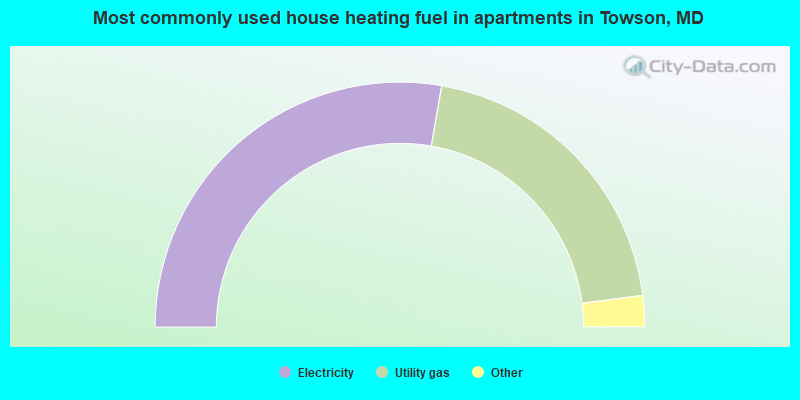
- 55.4%Electricity
- 40.4%Utility gas
- 2.1%Bottled, tank, or LP gas
- 1.0%Fuel oil, kerosene, etc.
- 0.7%Other fuel
- 0.3%No fuel used
Towson compared to Maryland state average:
- Unemployed percentage significantly below state average.
- Hispanic race population percentage below state average.
- Length of stay since moving in above state average.
- Institutionalized population percentage significantly above state average.
- Number of college students above state average.
- Percentage of population with a bachelor's degree or higher above state average.
Towson on our top lists:
- #11 on the list of "Top 100 cities with the largest percentage of females (pop. 50,000+)"
- #16 on the list of "Top 101 cities with the most people having professional degrees (population 50,000+)"
- #18 on the list of "Top 101 cities with largest percentage of males in occupations: legal occupations (population 50,000+)"
- #19 on the list of "Top 100 cities with highest percentage of college students (pop. 50,000+)"
- #23 on the list of "Top 101 cities that people commute into (largest positive percentage daily daytime population change due to commuting) (population 50,000+)"
- #23 on the list of "Top 101 cities with largest percentage of males in occupations: health diagnosing and treating practitioners and other technical occupations (population 50,000+)"
- #23 on the list of "Top 101 cities with the most people having Master's or Doctorate degrees (population 50,000+)"
- #30 on the list of "Top 101 cities with the most people having Doctorate degrees (population 50,000+)"
- #31 on the list of "Top 101 cities with largest percentage of females in occupations: education, training, and library occupations (population 50,000+)"
- #31 on the list of "Top 101 cities with the largest percentage of high school students in private schools (500+ students)"
- #37 on the list of "Top 101 cities with largest percentage of males in occupations: sales and related occupations (population 50,000+)"
- #40 on the list of "Top 100 best educated cities (highest percentage of bachelor degree holding residents) (pop. 50,000+)"
- #44 on the list of "Top 101 cities with largest percentage of females in industries: educational services (population 50,000+)"
- #47 on the list of "Top 101 cities with largest percentage of males in industries: health care and social assistance (population 50,000+)"
- #47 on the list of "Top 100 cities with highest median household income and median resident age less than 35 (pop. 50,000+)"
- #51 on the list of "Top 101 cities with largest percentage of males in occupations: life, physical, and social science occupations (population 50,000+)"
- #56 on the list of "Top 101 cities with largest percentage of females in occupations: health diagnosing and treating practitioners and other technical occupations (population 50,000+)"
- #56 on the list of "Top 101 cities with largest percentage of males in industries: finance and insurance (population 50,000+)"
- #62 on the list of "Top 101 cities with largest percentage of males in industries: educational services (population 50,000+)"
- #66 on the list of "Top 101 cities with the largest percentage of elementary and middle school students in private schools (1,000+ students)"
- #18 (21204) on the list of "Top 101 zip codes with the most offices of physicians in 2005"
- #61 (21204) on the list of "Top 101 zip codes with the most offices of lawyers in 2005"
- #14 on the list of "Top 101 counties with the highest surface withdrawal of fresh water for public supply"
- #15 on the list of "Top 101 counties with the largest increase in the number of births per 1000 residents 2000-2006 to 2007-2013 (pop 50,000+)"
- #22 on the list of "Top 101 counties with the highest total withdrawal of fresh water for public supply"
- #29 on the list of "Top 101 counties with the most Black Protestant adherents"
- #35 on the list of "Top 101 counties with the lowest ground withdrawal of fresh water for public supply (pop. 50,000+)"

|
|
Total of 512 patent applications in 2008-2024.