Crocker: Fire Incidents, Missouri (MO)
Where are fire incidents reported in Crocker, MO
Something went wrong! Please refresh the page.
|
| |||||||||||||||||||||||||||||||||||||||||||||||||||||||||||||||||||||||||||||||||||||||||||||||||||||||||||||
| Other | 69 | |||||||||||||||||||||||||||||||||||||||||||||||||||||||||||||||||||||||||||||||||||||||||||||||||||||||||||||
2002 - 2018 National Fire Incident Reporting System (NFIRS) incidents
- Incident types reported to NFIRS in Crocker, MO
- 50145.8%Fire
- 29727.1%Rescue & EMS
- 14313.1%Hazardous Condition
- 968.8%Good Intent Call
- 222.0%Service Call
- 131.2%False Alarm
- 131.2%Special Incident
- 80.7%Severe Weather
- 20.2%Overpressure Rupture
- Fire incident types reported to NFIRS in Crocker, MO
- 25651.1%Outside Fires
- 20540.9%Structure Fires
- 346.8%Mobile Property/Vehicle Fires
- 61.2%Other
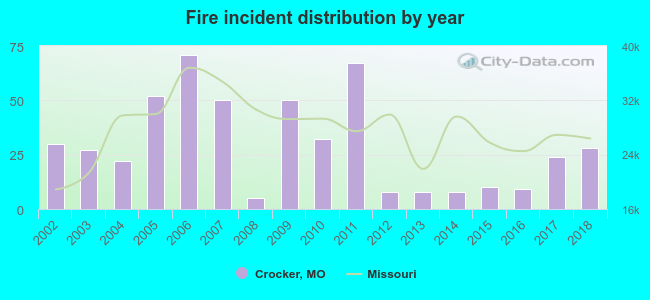 Based on the data from the years 2002 - 2018 the average number of fires per year is 29. The highest number of fire incidents - 71 took place in 2006, and the least - 5 in 2008. The data has a decreasing trend.
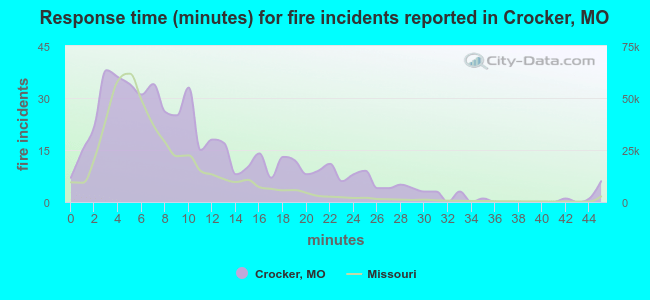 The median response time based on all reported fire incidents is 9 minutes. This is higher than the state median value.
The median response time in Crocker, MO compared to nearest cities:
(Note: Based on data for all years, including only cities with at least 500 fire incidents)
| Crocker: | 9 minutes |
| Waynesville: | 10 minutes |
| Richland: | 11 minutes |
| Dixon: | 12 minutes |
| Osage Beach: | 7 minutes |
| Lake Ozark: | 8 minutes |
| Camdenton: | 11 minutes |
| Rolla: | 7 minutes |
| Lebanon: | 9 minutes |
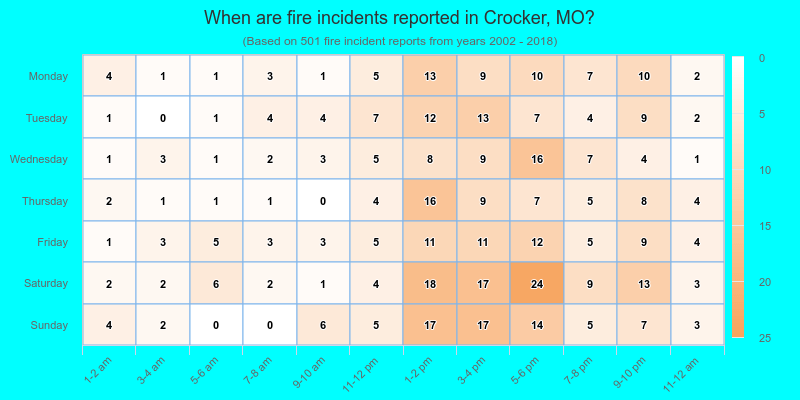
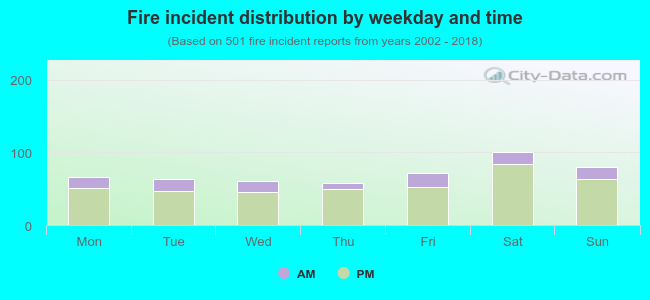 22.0% incidents where reported in the morning and 78.0% in the evening. The most fires (20.2%) took place on Saturday, and the least (11.6%) on Thursday.
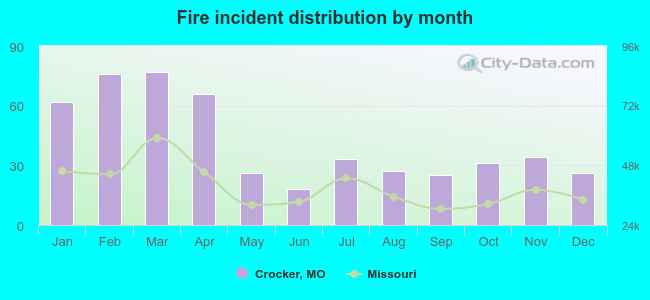 According to the 501 reports from years 2002 - 2018 most fires (15.4%) took place during March, and the least (3.6%) in June.
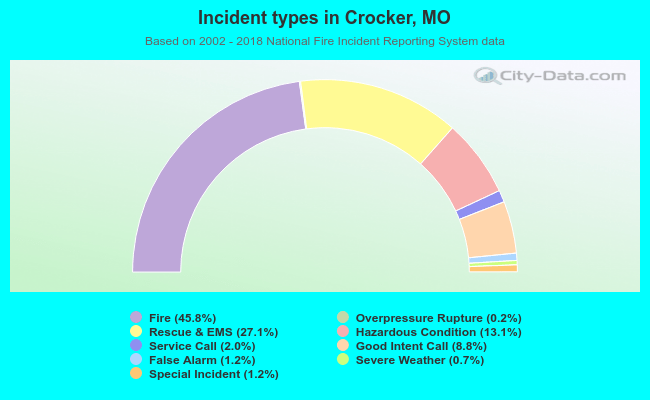 Out of all 1,095 cases reported during the years 2002 - 2018, the most belonged to the categories: Fire (45.8%), Rescue & EMS (27.1%), and Hazardous Condition (13.1%).
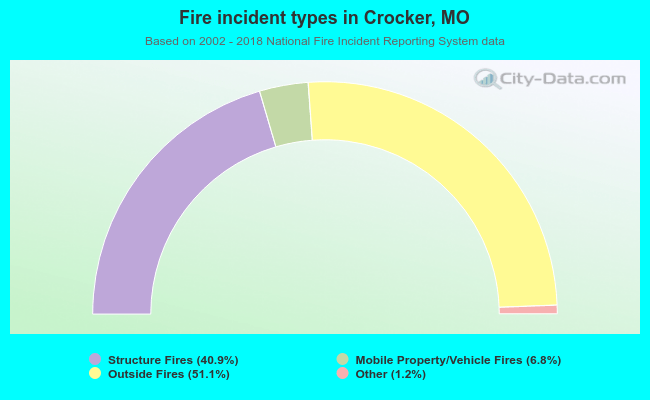 When looking into fire subcategories, the most incidents belonged to: Outside Fires (51.1%), and Structure Fires (40.9%).