Lebanon: Fire Incidents, Missouri (MO)
Where are fire incidents reported in Lebanon, MO
Something went wrong! Please refresh the page.
| Fire incidents reported | |
|---|---|
| Sreet name | Count |
| JEFFERSON AVE | 126 |
| ELM ST | 60 |
| COMMERCIAL ST | 56 |
| ADAMS ST | 54 |
| NEW BUFFALO RD | 54 |
| 32 HWY | 50 |
| MM HWY | 46 |
| 32 OUT HWY | 36 |
| 5 HWY | 36 |
| MADISON AVE | 36 |
| AA HWY | 34 |
| MONROE AVE | 32 |
| TOWER RD | 28 |
| BLAND RD | 26 |
| W HWY | 26 |
| 64 HWY | 24 |
| BLAND AVE | 24 |
| GENTRY RD | 24 |
| GRINDSTONE RD | 24 |
| N HWY | 24 |
| PINE TREE DR | 24 |
| 5 STATE HWY | 22 |
| BRICE ST | 22 |
| HORIZON RD | 22 |
| HWY 5 | 22 |
| MILLCREEK RD | 22 |
| WASHINGTON AVE | 22 |
| 32 - OUT HWY | 20 |
| 66 RT | 20 |
| FALCON RD | 20 |
| Other | 1,506 |
2002 - 2018 National Fire Incident Reporting System (NFIRS) incidents
- Incident types reported to NFIRS in Lebanon, MO
- 2,54237.3%Fire
- 2,50236.7%Rescue & EMS
- 70410.3%Good Intent Call
- 5407.9%Hazardous Condition
- 2974.4%Service Call
- 2133.1%False Alarm
- 70.1%Special Incident
- Fire incident types reported to NFIRS in Lebanon, MO
- 1,13044.5%Structure Fires
- 1,08442.6%Outside Fires
- 2459.6%Mobile Property/Vehicle Fires
- 833.3%Other
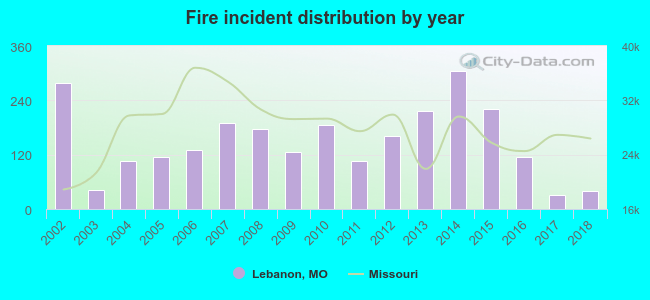 Based on the data from the years 2002 - 2018 the average number of fires per year is 150. The highest number of reported fires - 305 took place in 2014, and the least - 31 in 2017. The data has a decreasing trend.
The average number of yearly fire incidents per 10k residents in Lebanon, MO compared to nearest cities:
(Note: Based on data for the last 3 years, including only cities with population 5,000 and above)
| Lebanon: | 42.1 |
| Waynesville: | 128.0 |
| Marshfield: | 109.9 |
| Bolivar: | 43.2 |
| Springfield: | 62.5 |
| Willard: | 113.1 |
| Rolla: | 34.5 |
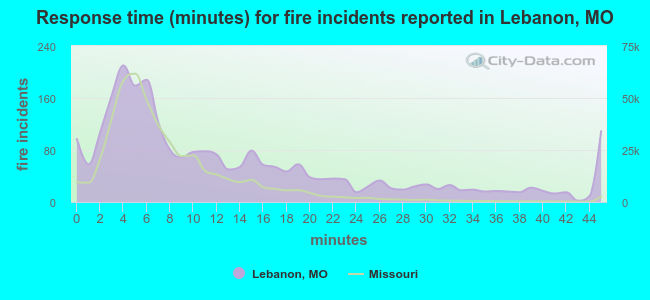 The median response time based on all reported fire incidents is 9 minutes. This is higher compared to the Missouri median value.
The median response time in Lebanon, MO compared to nearest cities:
(Note: Based on data for all years, including only cities with at least 500 fire incidents)
| Lebanon: | 9 minutes |
| Richland: | 11 minutes |
| Camdenton: | 11 minutes |
| Waynesville: | 10 minutes |
| Marshfield: | 10 minutes |
| Crocker: | 9 minutes |
| Osage Beach: | 7 minutes |
| Fair Grove: | 10 minutes |
| Sunrise Beach: | 9 minutes |
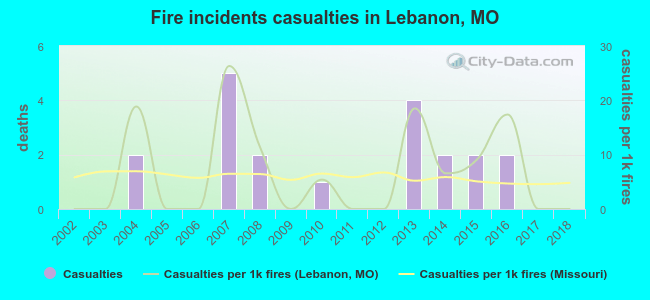 According to the reports from the years 2002 - 2018 the average number of fire-related casualties per year is 1. The highest number of reported injuries - 5 took place in 2007, and the lowest - 0 in 2002. The data has a constant trend.
The average number of casualties per 1,000 fires is 7. This indicator was the highest - 26 in 2007, and the lowest 0 in 2002. The trend for injuries per 1,000 fires is decreasing. Compared to the state value the number of casualties per 1,000 incidents is higher.
According to the reports from the years 2002 - 2018 the average number of fire-related casualties per year is 1. The highest number of reported injuries - 5 took place in 2007, and the lowest - 0 in 2002. The data has a constant trend.
The average number of casualties per 1,000 fires is 7. This indicator was the highest - 26 in 2007, and the lowest 0 in 2002. The trend for injuries per 1,000 fires is decreasing. Compared to the state value the number of casualties per 1,000 incidents is higher.Casualties per 1,000 incidents in Lebanon, MO compared to nearest cities:
(Note: Based on data for all years, including only cities with at least 500 fire incidents)
| Lebanon: | 7.9 |
| Richland: | 3.0 |
| Camdenton: | 1.6 |
| Waynesville: | 0.0 |
| Marshfield: | 1.4 |
| Crocker: | 0.0 |
| Osage Beach: | 3.5 |
| Fair Grove: | 0.0 |
| Sunrise Beach: | 2.8 |
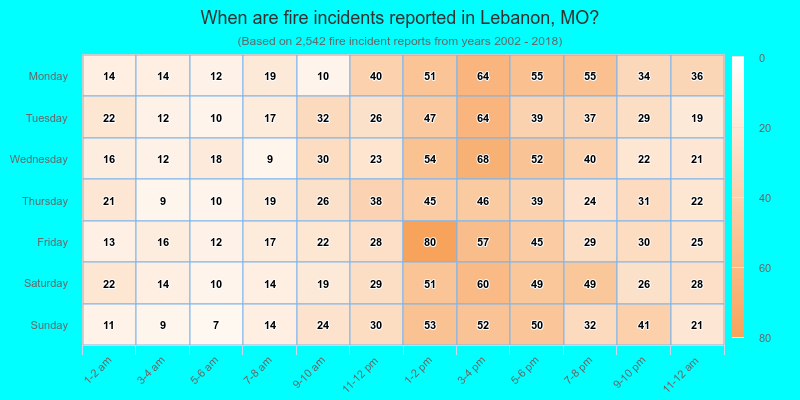
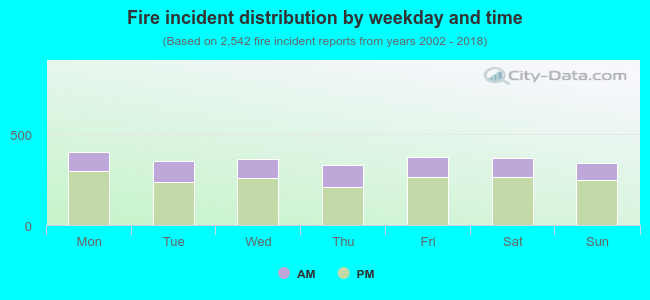 30.3% incidents where reported in the morning and 69.7% in the evening. The most fires (15.9%) took place on Monday, and the least (13.0%) on Thursday.
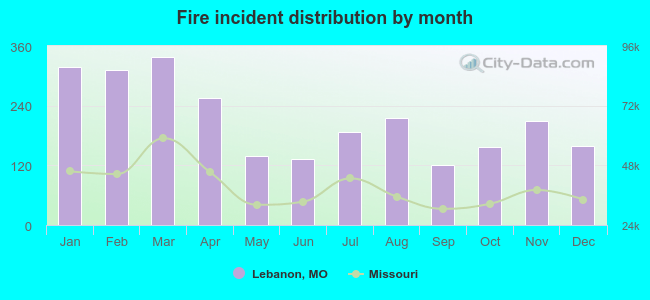 Based on the 2,542 fire incidents from years 2002 - 2018 most fires (13.3%) took place during March, and the least (4.7%) in September.
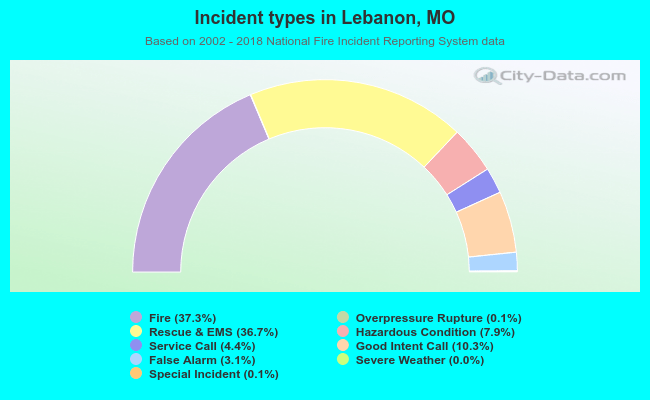 Out of all 6,813 cases reported during the years 2002 - 2018, the most belonged to the categories: Fire (37.3%), Rescue & EMS (36.7%), and Good Intent Call (10.3%).
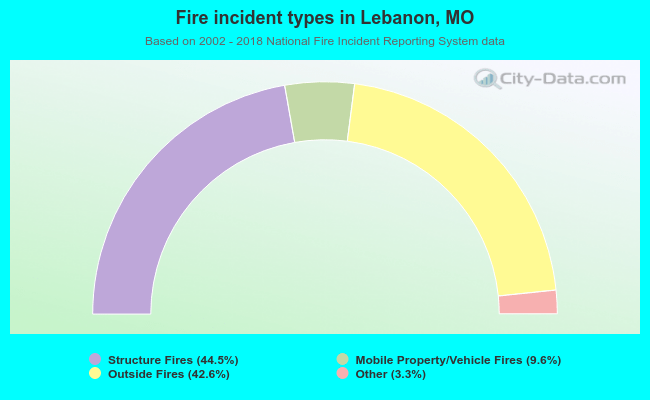 When looking into fire subcategories, the most reports belonged to: Structure Fires (44.5%), and Outside Fires (42.6%).