DeSoto: Fire Incidents, Texas (TX)
Where are fire incidents reported in DeSoto, TX
Something went wrong! Please refresh the page.
| Fire incidents reported | |
|---|---|
| Sreet name | Count |
| HAMPTON RD | 310 |
| PLEASANT RUN RD | 288 |
| WINTERGREEN RD | 278 |
| BELT LINE RD | 218 |
| PARKERVILLE RD | 114 |
| BOLTON BOONE DR | 112 |
| I35E SR | 112 |
| POLK ST | 102 |
| PECAN CROSSING DR | 62 |
| COCKRELL HILL RD | 60 |
| EAGLE DR | 58 |
| I-35 SERVICE RD | 56 |
| WESTMORELAND RD | 52 |
| DAVID AVE | 50 |
| DANIELDALE RD | 48 |
| GILBERT ST | 48 |
| I-35 HWY | 48 |
| CENTRE PARK BLVD | 46 |
| I35 E SR | 46 |
| OLD HICKORY TRL | 44 |
| HONOR DR | 40 |
| I35E | 40 |
| SCOTLAND DR | 40 |
| MOCKINGBIRD LN | 34 |
| WENTWOOD DR | 34 |
| PARKS DR | 32 |
| SHADYBROOK DR | 30 |
| WESTLAKE DR | 30 |
| CHESTNUT LN | 28 |
| CRESENT DR | 28 |
| Other | 705 |
2003 - 2018 National Fire Incident Reporting System (NFIRS) incidents
- Incident types reported to NFIRS in DeSoto, TX
- 25,32159.9%Rescue & EMS
- 4,57510.8%Hazardous Condition
- 3,6658.7%Good Intent Call
- 3,6258.6%Service Call
- 3,1937.6%Fire
- 1,8394.3%False Alarm
- 430.1%Overpressure Rupture
- Fire incident types reported to NFIRS in DeSoto, TX
- 1,56248.9%Structure Fires
- 1,00031.3%Outside Fires
- 46314.5%Mobile Property/Vehicle Fires
- 1685.3%Other
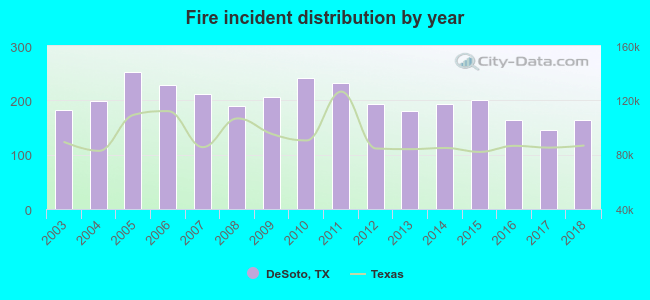 According to the data from the years 2003 - 2018 the average number of fire incidents per year is 199. The highest number of fire incidents - 252 took place in 2005, and the least - 146 in 2017. The data has a decreasing trend.
The average number of yearly fire incidents per 10k residents in DeSoto, TX compared to nearest cities:
(Note: Based on data for the last 3 years, including only cities with population 5,000 and above)
| DeSoto: | 30.4 |
| Glenn Heights: | 40.3 |
| Duncanville: | 46.6 |
| Lancaster: | 43.2 |
| Cedar Hill: | 34.2 |
| Red Oak: | 70.4 |
| Hutchins: | 76.1 |
| Midlothian: | 68.0 |
| Grand Prairie: | 27.7 |
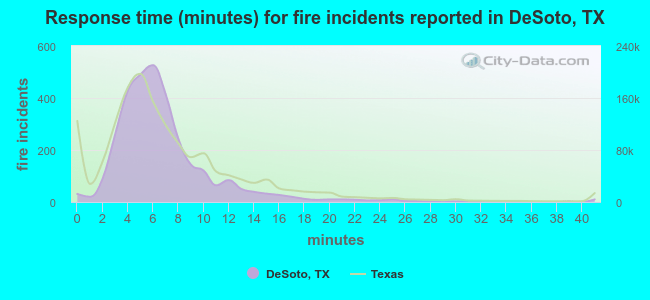 The median response time based on all reported fire incidents is 6 minutes. This is close to the state median value.
The median response time in DeSoto, TX compared to nearest cities:
(Note: Based on data for all years, including only cities with at least 500 fire incidents)
| DeSoto: | 6 minutes |
| Glenn Heights: | 5 minutes |
| Duncanville: | 6 minutes |
| Lancaster: | 6 minutes |
| Cedar Hill: | 6 minutes |
| Red Oak: | 6 minutes |
| Hutchins: | 6 minutes |
| Wilmer: | 6 minutes |
| Midlothian: | 8 minutes |
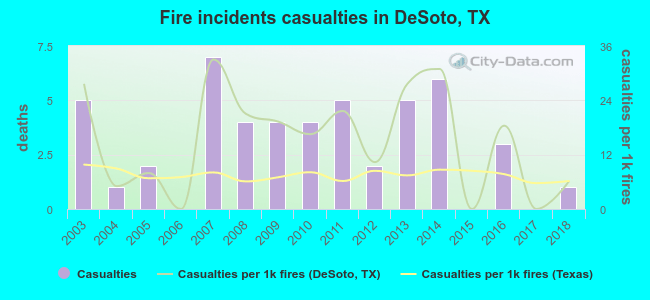 Based on the data from the years 2003 - 2018 the average number of fire-related casualties per year is 3. The highest number of reported casualties - 7 took place in 2007, and the lowest - 0 in 2006. The data has a decreasing trend.
The average number of injuries per 1,000 fires is 15. This indicator was the highest - 33 in 2007, and the lowest 0 in 2006. The trend for casualties per 1,000 incidents is declining. Compared to the state value the number of casualties per 1,000 incidents is much higher.
Based on the data from the years 2003 - 2018 the average number of fire-related casualties per year is 3. The highest number of reported casualties - 7 took place in 2007, and the lowest - 0 in 2006. The data has a decreasing trend.
The average number of injuries per 1,000 fires is 15. This indicator was the highest - 33 in 2007, and the lowest 0 in 2006. The trend for casualties per 1,000 incidents is declining. Compared to the state value the number of casualties per 1,000 incidents is much higher.Casualties per 1,000 incidents in DeSoto, TX compared to nearest cities:
(Note: Based on data for all years, including only cities with at least 500 fire incidents)
| DeSoto: | 15.3 |
| Glenn Heights: | 13.0 |
| Duncanville: | 9.0 |
| Lancaster: | 15.5 |
| Cedar Hill: | 13.7 |
| Red Oak: | 5.3 |
| Hutchins: | 9.0 |
| Wilmer: | 2.1 |
| Midlothian: | 12.3 |
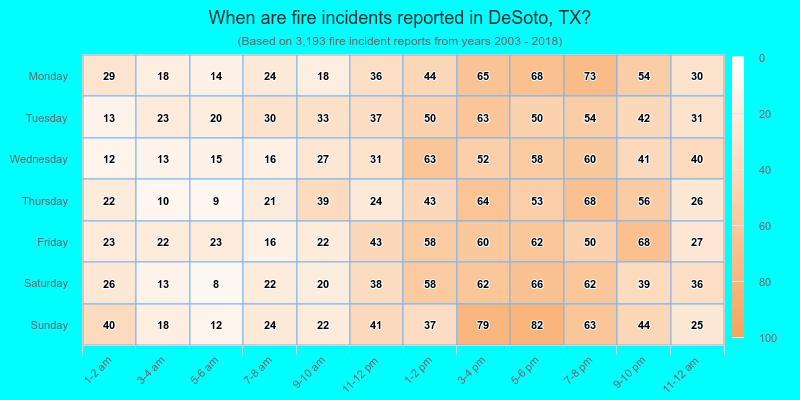
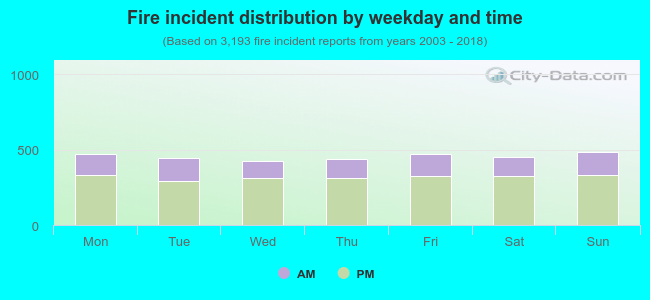 30.3% incidents where reported in the morning and 69.7% in the evening. The most fires (15.3%) took place on Sunday, and the least (13.4%) on Wednesday.
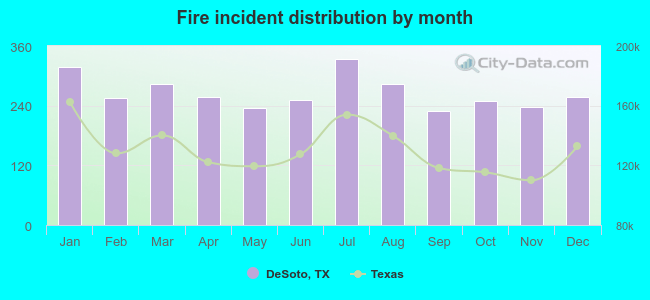 According to the 3,193 fire incidents from years 2003 - 2018 most fires (10.4%) took place during July, and the least (7.2%) in September.
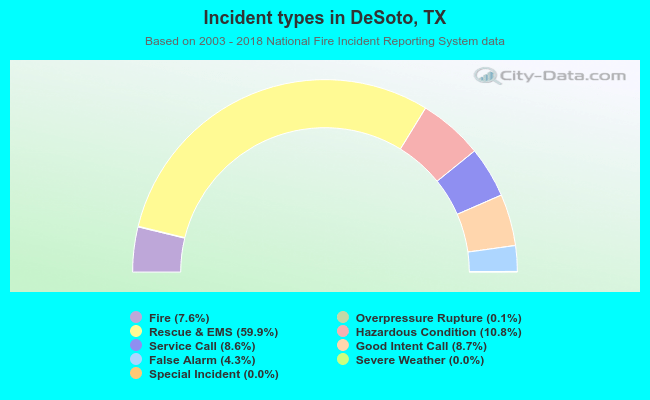 Out of all 42,284 cases reported during the years 2003 - 2018, the most belonged to the categories: Rescue & EMS (59.9%), Hazardous Condition (10.8%), and Good Intent Call (8.7%).
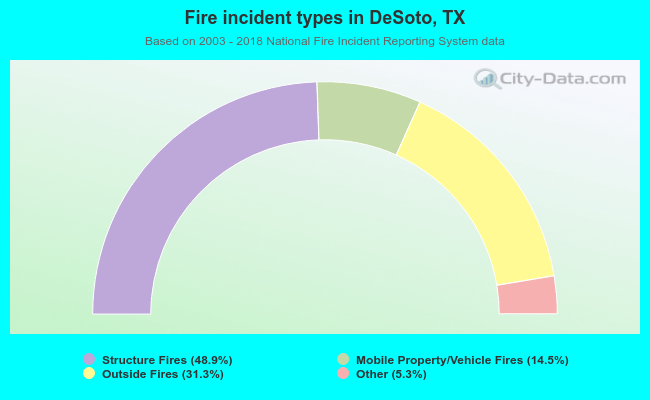 When looking into fire subcategories, the most incidents belonged to: Structure Fires (48.9%), and Outside Fires (31.3%).