Grand Prairie: Fire Incidents, Texas (TX)
Where are fire incidents reported in Grand Prairie, TX
Something went wrong! Please refresh the page.
| Fire incidents reported | |
|---|---|
| Sreet name | Count |
| BELT LINE RD | 198 |
| MAIN ST | 184 |
| TARRANT RD | 174 |
| HWY 360 NB | 144 |
| CARRIER | 102 |
| IH 30 EB | 94 |
| PIONEER | 92 |
| IH 20 EB | 90 |
| IH 20 WB | 84 |
| PIONEER PK | 82 |
| JEFFERSON ST | 80 |
| MARSHALL DR | 78 |
| IH 30 WB | 76 |
| HWY 360 SB | 68 |
| 14TH ST | 56 |
| BARDIN RD | 56 |
| CARRIER PK | 52 |
| ALOUETTE DR | 50 |
| MAYFIELD RD | 50 |
| GREAT SOUTHWEST | 48 |
| DICKEY RD | 46 |
| GREAT SOUTHWEST PK | 46 |
| ROBINSON RD | 44 |
| HWY 161 NB | 42 |
| DALWORTH ST | 38 |
| LAKEVIEW DR | 38 |
| HWY 161 SB | 34 |
| 4TH ST | 32 |
| AVENUE R | 32 |
| CARRIER PKWY | 32 |
| Other | 1,884 |
2003 - 2018 National Fire Incident Reporting System (NFIRS) incidents
- Incident types reported to NFIRS in Grand Prairie, TX
- 53,44869.2%Rescue & EMS
- 5,9837.7%Good Intent Call
- 5,4307.0%Service Call
- 4,2195.5%False Alarm
- 4,1265.3%Fire
- 3,7834.9%Hazardous Condition
- 1300.2%Special Incident
- Fire incident types reported to NFIRS in Grand Prairie, TX
- 1,60638.9%Outside Fires
- 1,45435.2%Structure Fires
- 87321.2%Mobile Property/Vehicle Fires
- 1934.7%Other
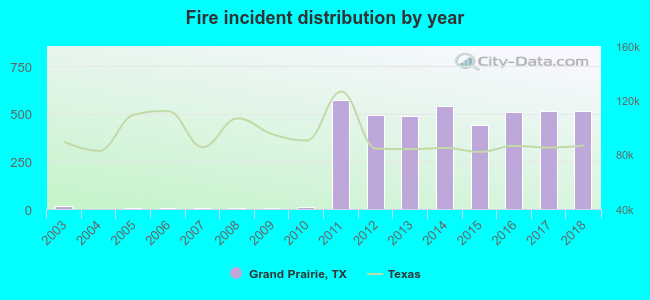 Based on the data from the years 2003 - 2018 the average number of fire incidents per year is 258. The highest number of reported fire incidents - 570 took place in 2011, and the least - 0 in 2004. The data has a rising trend.
The average number of yearly fire incidents per 10k residents in Grand Prairie, TX compared to nearest cities:
(Note: Based on data for the last 3 years, including only cities with population 5,000 and above)
| Grand Prairie: | 27.7 |
| Arlington: | 23.6 |
| Duncanville: | 46.6 |
| Irving: | 21.8 |
| Cedar Hill: | 34.2 |
| Euless: | 29.7 |
| Mansfield: | 22.7 |
| Bedford: | 29.2 |
| DeSoto: | 30.4 |
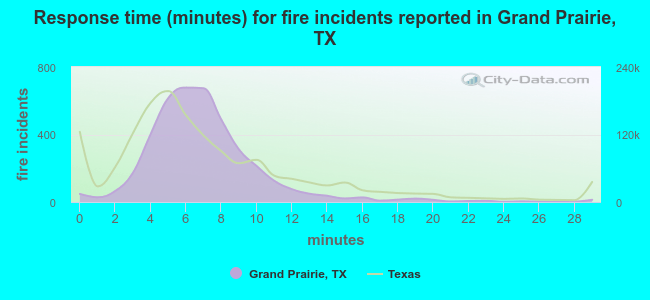 The median response time based on all reported fire incidents is 7 minutes. This is similar to the Texas median value.
The median response time in Grand Prairie, TX compared to nearest cities:
(Note: Based on data for all years, including only cities with at least 500 fire incidents)
| Grand Prairie: | 7 minutes |
| Arlington: | 5 minutes |
| Duncanville: | 6 minutes |
| Irving: | 5 minutes |
| Cedar Hill: | 6 minutes |
| Euless: | 5 minutes |
| Mansfield: | 6 minutes |
| Bedford: | 4 minutes |
| DeSoto: | 6 minutes |
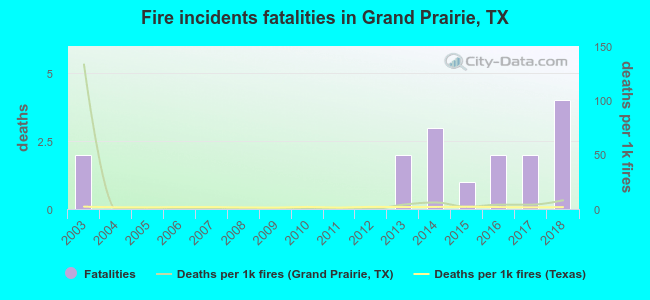 According to the data from the years 2003 - 2018 the average number of fire-related fatalities per year is 1. The highest number of reported deaths - 4 took place in 2018, and the lowest - 0 in 2004. The data has a growing trend.
The average number of deaths per 1,000 fire incidents is 10. This indicator was the highest - 133 in 2003, and the lowest 0 in 2004. The trend for deaths per 1,000 incidents is declining. Compared to the Texas value the number of deaths per 1,000 fire incidents is much higher.
According to the data from the years 2003 - 2018 the average number of fire-related fatalities per year is 1. The highest number of reported deaths - 4 took place in 2018, and the lowest - 0 in 2004. The data has a growing trend.
The average number of deaths per 1,000 fire incidents is 10. This indicator was the highest - 133 in 2003, and the lowest 0 in 2004. The trend for deaths per 1,000 incidents is declining. Compared to the Texas value the number of deaths per 1,000 fire incidents is much higher.Deaths per 1,000 incidents in Grand Prairie, TX compared to nearest cities:
(Note: Based on data for all years, including only cities with at least 2,500 fire incidents)
| Grand Prairie: | 3.9 |
| Arlington: | 1.9 |
| Duncanville: | 0.8 |
| Irving: | 0.7 |
| Cedar Hill: | 1.3 |
| Euless: | 1.3 |
| Mansfield: | 0.7 |
| Bedford: | 1.5 |
| DeSoto: | 0.6 |
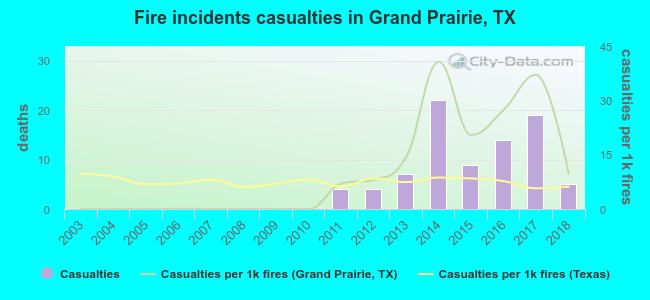 Based on the data from the years 2003 - 2018 the average number of fire-related casualties per year is 5. The highest number of reported casualties - 22 took place in 2014, and the lowest - 0 in 2003. The data has a rising trend.
The average number of injuries per 1,000 fires is 10. This indicator was the highest - 41 in 2014, and the lowest 0 in 2003. The trend for injuries per 1,000 fire incidents is rising. Compared to the Texas value the number of casualties per 1,000 fire incidents is much higher.
Based on the data from the years 2003 - 2018 the average number of fire-related casualties per year is 5. The highest number of reported casualties - 22 took place in 2014, and the lowest - 0 in 2003. The data has a rising trend.
The average number of injuries per 1,000 fires is 10. This indicator was the highest - 41 in 2014, and the lowest 0 in 2003. The trend for injuries per 1,000 fire incidents is rising. Compared to the Texas value the number of casualties per 1,000 fire incidents is much higher.Casualties per 1,000 incidents in Grand Prairie, TX compared to nearest cities:
(Note: Based on data for all years, including only cities with at least 500 fire incidents)
| Grand Prairie: | 20.4 |
| Arlington: | 26.2 |
| Duncanville: | 9.0 |
| Irving: | 7.0 |
| Cedar Hill: | 13.7 |
| Euless: | 35.9 |
| Mansfield: | 18.9 |
| Bedford: | 30.9 |
| DeSoto: | 15.3 |
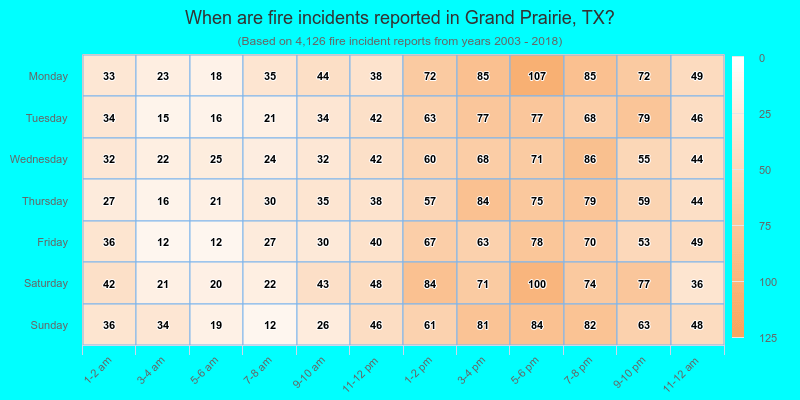
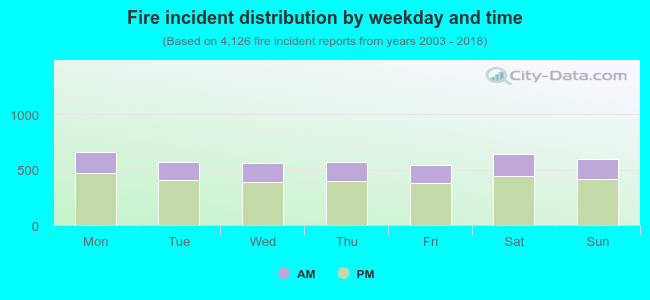 29.6% incidents where reported in the morning and 70.4% in the evening. The most fires (16.0%) took place on Monday, and the least (13.0%) on Friday.
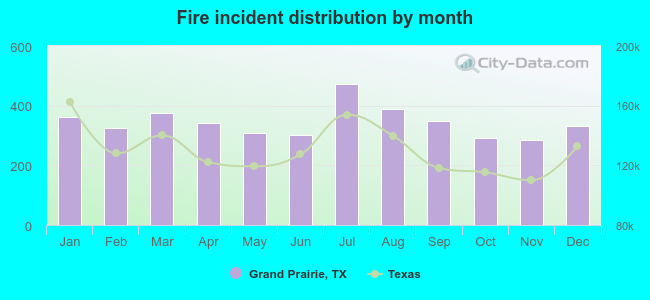 According to the 4,126 fires from years 2003 - 2018 most fires (11.4%) took place during July, and the least (6.9%) in November.
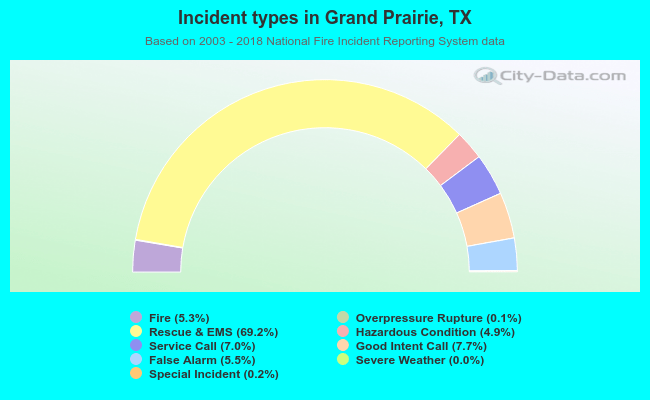 Out of all 77,220 cases reported during the years 2003 - 2018, the most belonged to the categories: Rescue & EMS (69.2%), Good Intent Call (7.7%), and Service Call (7.0%).
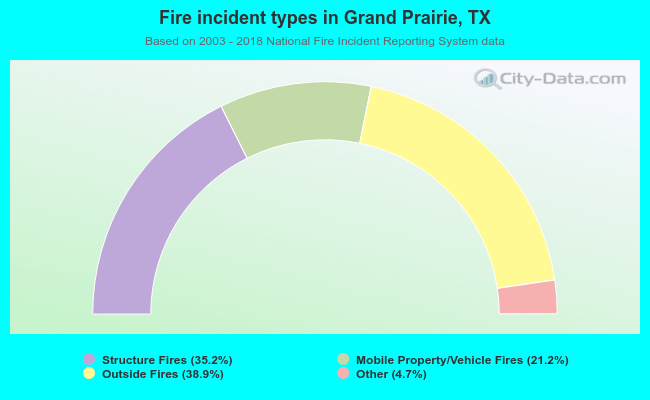 When looking into fire subcategories, the most incidents belonged to: Outside Fires (38.9%), and Structure Fires (35.2%).