Grand Prairie, Texas Submit your own pictures of this city and show them to the world
OSM Map
General Map
Google Map
MSN Map
OSM Map
General Map
Google Map
MSN Map
OSM Map
General Map
Google Map
MSN Map
OSM Map
General Map
Google Map
MSN Map
Please wait while loading the map...
Population in 2022: 201,843 (100% urban, 0% rural). Population change since 2000: +58.4%Males: 100,367 Females: 101,476
March 2022 cost of living index in Grand Prairie: 94.8 (less than average, U.S. average is 100) Percentage of residents living in poverty in 2022: 9.9%for White Non-Hispanic residents , 10.7% for Black residents , 11.3% for Hispanic or Latino residents , 9.0% for American Indian residents , 13.4% for other race residents , 7.5% for two or more races residents )
Profiles of local businesses
Business Search - 14 Million verified businesses
Data:
Median household income ($)
Median household income (% change since 2000)
Household income diversity
Ratio of average income to average house value (%)
Ratio of average income to average rent
Median household income ($) - White
Median household income ($) - Black or African American
Median household income ($) - Asian
Median household income ($) - Hispanic or Latino
Median household income ($) - American Indian and Alaska Native
Median household income ($) - Multirace
Median household income ($) - Other Race
Median household income for houses/condos with a mortgage ($)
Median household income for apartments without a mortgage ($)
Races - White alone (%)
Races - White alone (% change since 2000)
Races - Black alone (%)
Races - Black alone (% change since 2000)
Races - American Indian alone (%)
Races - American Indian alone (% change since 2000)
Races - Asian alone (%)
Races - Asian alone (% change since 2000)
Races - Hispanic (%)
Races - Hispanic (% change since 2000)
Races - Native Hawaiian and Other Pacific Islander alone (%)
Races - Native Hawaiian and Other Pacific Islander alone (% change since 2000)
Races - Two or more races (%)
Races - Two or more races (% change since 2000)
Races - Other race alone (%)
Races - Other race alone (% change since 2000)
Racial diversity
Unemployment (%)
Unemployment (% change since 2000)
Unemployment (%) - White
Unemployment (%) - Black or African American
Unemployment (%) - Asian
Unemployment (%) - Hispanic or Latino
Unemployment (%) - American Indian and Alaska Native
Unemployment (%) - Multirace
Unemployment (%) - Other Race
Population density (people per square mile)
Population - Males (%)
Population - Females (%)
Population - Males (%) - White
Population - Males (%) - Black or African American
Population - Males (%) - Asian
Population - Males (%) - Hispanic or Latino
Population - Males (%) - American Indian and Alaska Native
Population - Males (%) - Multirace
Population - Males (%) - Other Race
Population - Females (%) - White
Population - Females (%) - Black or African American
Population - Females (%) - Asian
Population - Females (%) - Hispanic or Latino
Population - Females (%) - American Indian and Alaska Native
Population - Females (%) - Multirace
Population - Females (%) - Other Race
Coronavirus confirmed cases (Apr 27, 2024)
Deaths caused by coronavirus (Apr 27, 2024)
Coronavirus confirmed cases (per 100k population) (Apr 27, 2024)
Deaths caused by coronavirus (per 100k population) (Apr 27, 2024)
Daily increase in number of cases (Apr 27, 2024)
Weekly increase in number of cases (Apr 27, 2024)
Cases doubled (in days) (Apr 27, 2024)
Hospitalized patients (Apr 18, 2022)
Negative test results (Apr 18, 2022)
Total test results (Apr 18, 2022)
COVID Vaccine doses distributed (per 100k population) (Sep 19, 2023)
COVID Vaccine doses administered (per 100k population) (Sep 19, 2023)
COVID Vaccine doses distributed (Sep 19, 2023)
COVID Vaccine doses administered (Sep 19, 2023)
Likely homosexual households (%)
Likely homosexual households (% change since 2000)
Likely homosexual households - Lesbian couples (%)
Likely homosexual households - Lesbian couples (% change since 2000)
Likely homosexual households - Gay men (%)
Likely homosexual households - Gay men (% change since 2000)
Cost of living index
Median gross rent ($)
Median contract rent ($)
Median monthly housing costs ($)
Median house or condo value ($)
Median house or condo value ($ change since 2000)
Mean house or condo value by units in structure - 1, detached ($)
Mean house or condo value by units in structure - 1, attached ($)
Mean house or condo value by units in structure - 2 ($)
Mean house or condo value by units in structure by units in structure - 3 or 4 ($)
Mean house or condo value by units in structure - 5 or more ($)
Mean house or condo value by units in structure - Boat, RV, van, etc. ($)
Mean house or condo value by units in structure - Mobile home ($)
Median house or condo value ($) - White
Median house or condo value ($) - Black or African American
Median house or condo value ($) - Asian
Median house or condo value ($) - Hispanic or Latino
Median house or condo value ($) - American Indian and Alaska Native
Median house or condo value ($) - Multirace
Median house or condo value ($) - Other Race
Median resident age
Resident age diversity
Median resident age - Males
Median resident age - Females
Median resident age - White
Median resident age - Black or African American
Median resident age - Asian
Median resident age - Hispanic or Latino
Median resident age - American Indian and Alaska Native
Median resident age - Multirace
Median resident age - Other Race
Median resident age - Males - White
Median resident age - Males - Black or African American
Median resident age - Males - Asian
Median resident age - Males - Hispanic or Latino
Median resident age - Males - American Indian and Alaska Native
Median resident age - Males - Multirace
Median resident age - Males - Other Race
Median resident age - Females - White
Median resident age - Females - Black or African American
Median resident age - Females - Asian
Median resident age - Females - Hispanic or Latino
Median resident age - Females - American Indian and Alaska Native
Median resident age - Females - Multirace
Median resident age - Females - Other Race
Commute - mean travel time to work (minutes)
Travel time to work - Less than 5 minutes (%)
Travel time to work - Less than 5 minutes (% change since 2000)
Travel time to work - 5 to 9 minutes (%)
Travel time to work - 5 to 9 minutes (% change since 2000)
Travel time to work - 10 to 19 minutes (%)
Travel time to work - 10 to 19 minutes (% change since 2000)
Travel time to work - 20 to 29 minutes (%)
Travel time to work - 20 to 29 minutes (% change since 2000)
Travel time to work - 30 to 39 minutes (%)
Travel time to work - 30 to 39 minutes (% change since 2000)
Travel time to work - 40 to 59 minutes (%)
Travel time to work - 40 to 59 minutes (% change since 2000)
Travel time to work - 60 to 89 minutes (%)
Travel time to work - 60 to 89 minutes (% change since 2000)
Travel time to work - 90 or more minutes (%)
Travel time to work - 90 or more minutes (% change since 2000)
Marital status - Never married (%)
Marital status - Now married (%)
Marital status - Separated (%)
Marital status - Widowed (%)
Marital status - Divorced (%)
Median family income ($)
Median family income (% change since 2000)
Median non-family income ($)
Median non-family income (% change since 2000)
Median per capita income ($)
Median per capita income (% change since 2000)
Median family income ($) - White
Median family income ($) - Black or African American
Median family income ($) - Asian
Median family income ($) - Hispanic or Latino
Median family income ($) - American Indian and Alaska Native
Median family income ($) - Multirace
Median family income ($) - Other Race
Median year house/condo built
Median year apartment built
Year house built - Built 2005 or later (%)
Year house built - Built 2000 to 2004 (%)
Year house built - Built 1990 to 1999 (%)
Year house built - Built 1980 to 1989 (%)
Year house built - Built 1970 to 1979 (%)
Year house built - Built 1960 to 1969 (%)
Year house built - Built 1950 to 1959 (%)
Year house built - Built 1940 to 1949 (%)
Year house built - Built 1939 or earlier (%)
Average household size
Household density (households per square mile)
Average household size - White
Average household size - Black or African American
Average household size - Asian
Average household size - Hispanic or Latino
Average household size - American Indian and Alaska Native
Average household size - Multirace
Average household size - Other Race
Occupied housing units (%)
Vacant housing units (%)
Owner occupied housing units (%)
Renter occupied housing units (%)
Vacancy status - For rent (%)
Vacancy status - For sale only (%)
Vacancy status - Rented or sold, not occupied (%)
Vacancy status - For seasonal, recreational, or occasional use (%)
Vacancy status - For migrant workers (%)
Vacancy status - Other vacant (%)
Residents with income below the poverty level (%)
Residents with income below 50% of the poverty level (%)
Children below poverty level (%)
Poor families by family type - Married-couple family (%)
Poor families by family type - Male, no wife present (%)
Poor families by family type - Female, no husband present (%)
Poverty status for native-born residents (%)
Poverty status for foreign-born residents (%)
Poverty among high school graduates not in families (%)
Poverty among people who did not graduate high school not in families (%)
Residents with income below the poverty level (%) - White
Residents with income below the poverty level (%) - Black or African American
Residents with income below the poverty level (%) - Asian
Residents with income below the poverty level (%) - Hispanic or Latino
Residents with income below the poverty level (%) - American Indian and Alaska Native
Residents with income below the poverty level (%) - Multirace
Residents with income below the poverty level (%) - Other Race
Air pollution - Air Quality Index (AQI)
Air pollution - CO
Air pollution - NO2
Air pollution - SO2
Air pollution - Ozone
Air pollution - PM10
Air pollution - PM25
Air pollution - Pb
Crime - Murders per 100,000 population
Crime - Rapes per 100,000 population
Crime - Robberies per 100,000 population
Crime - Assaults per 100,000 population
Crime - Burglaries per 100,000 population
Crime - Thefts per 100,000 population
Crime - Auto thefts per 100,000 population
Crime - Arson per 100,000 population
Crime - City-data.com crime index
Crime - Violent crime index
Crime - Property crime index
Crime - Murders per 100,000 population (5 year average)
Crime - Rapes per 100,000 population (5 year average)
Crime - Robberies per 100,000 population (5 year average)
Crime - Assaults per 100,000 population (5 year average)
Crime - Burglaries per 100,000 population (5 year average)
Crime - Thefts per 100,000 population (5 year average)
Crime - Auto thefts per 100,000 population (5 year average)
Crime - Arson per 100,000 population (5 year average)
Crime - City-data.com crime index (5 year average)
Crime - Violent crime index (5 year average)
Crime - Property crime index (5 year average)
1996 Presidential Elections Results (%) - Democratic Party (Clinton)
1996 Presidential Elections Results (%) - Republican Party (Dole)
1996 Presidential Elections Results (%) - Other
2000 Presidential Elections Results (%) - Democratic Party (Gore)
2000 Presidential Elections Results (%) - Republican Party (Bush)
2000 Presidential Elections Results (%) - Other
2004 Presidential Elections Results (%) - Democratic Party (Kerry)
2004 Presidential Elections Results (%) - Republican Party (Bush)
2004 Presidential Elections Results (%) - Other
2008 Presidential Elections Results (%) - Democratic Party (Obama)
2008 Presidential Elections Results (%) - Republican Party (McCain)
2008 Presidential Elections Results (%) - Other
2012 Presidential Elections Results (%) - Democratic Party (Obama)
2012 Presidential Elections Results (%) - Republican Party (Romney)
2012 Presidential Elections Results (%) - Other
2016 Presidential Elections Results (%) - Democratic Party (Clinton)
2016 Presidential Elections Results (%) - Republican Party (Trump)
2016 Presidential Elections Results (%) - Other
2020 Presidential Elections Results (%) - Democratic Party (Biden)
2020 Presidential Elections Results (%) - Republican Party (Trump)
2020 Presidential Elections Results (%) - Other
Ancestries Reported - Arab (%)
Ancestries Reported - Czech (%)
Ancestries Reported - Danish (%)
Ancestries Reported - Dutch (%)
Ancestries Reported - English (%)
Ancestries Reported - French (%)
Ancestries Reported - French Canadian (%)
Ancestries Reported - German (%)
Ancestries Reported - Greek (%)
Ancestries Reported - Hungarian (%)
Ancestries Reported - Irish (%)
Ancestries Reported - Italian (%)
Ancestries Reported - Lithuanian (%)
Ancestries Reported - Norwegian (%)
Ancestries Reported - Polish (%)
Ancestries Reported - Portuguese (%)
Ancestries Reported - Russian (%)
Ancestries Reported - Scotch-Irish (%)
Ancestries Reported - Scottish (%)
Ancestries Reported - Slovak (%)
Ancestries Reported - Subsaharan African (%)
Ancestries Reported - Swedish (%)
Ancestries Reported - Swiss (%)
Ancestries Reported - Ukrainian (%)
Ancestries Reported - United States (%)
Ancestries Reported - Welsh (%)
Ancestries Reported - West Indian (%)
Ancestries Reported - Other (%)
Educational Attainment - No schooling completed (%)
Educational Attainment - Less than high school (%)
Educational Attainment - High school or equivalent (%)
Educational Attainment - Less than 1 year of college (%)
Educational Attainment - 1 or more years of college (%)
Educational Attainment - Associate degree (%)
Educational Attainment - Bachelor's degree (%)
Educational Attainment - Master's degree (%)
Educational Attainment - Professional school degree (%)
Educational Attainment - Doctorate degree (%)
School Enrollment - Nursery, preschool (%)
School Enrollment - Kindergarten (%)
School Enrollment - Grade 1 to 4 (%)
School Enrollment - Grade 5 to 8 (%)
School Enrollment - Grade 9 to 12 (%)
School Enrollment - College undergrad (%)
School Enrollment - Graduate or professional (%)
School Enrollment - Not enrolled in school (%)
School enrollment - Public schools (%)
School enrollment - Private schools (%)
School enrollment - Not enrolled (%)
Median number of rooms in houses and condos
Median number of rooms in apartments
Housing units lacking complete plumbing facilities (%)
Housing units lacking complete kitchen facilities (%)
Density of houses
Urban houses (%)
Rural houses (%)
Households with people 60 years and over (%)
Households with people 65 years and over (%)
Households with people 75 years and over (%)
Households with one or more nonrelatives (%)
Households with no nonrelatives (%)
Population in households (%)
Family households (%)
Nonfamily households (%)
Population in families (%)
Family households with own children (%)
Median number of bedrooms in owner occupied houses
Mean number of bedrooms in owner occupied houses
Median number of bedrooms in renter occupied houses
Mean number of bedrooms in renter occupied houses
Median number of vehichles in owner occupied houses
Mean number of vehichles in owner occupied houses
Median number of vehichles in renter occupied houses
Mean number of vehichles in renter occupied houses
Mortgage status - with mortgage (%)
Mortgage status - with second mortgage (%)
Mortgage status - with home equity loan (%)
Mortgage status - with both second mortgage and home equity loan (%)
Mortgage status - without a mortgage (%)
Average family size
Average family size - White
Average family size - Black or African American
Average family size - Asian
Average family size - Hispanic or Latino
Average family size - American Indian and Alaska Native
Average family size - Multirace
Average family size - Other Race
Geographical mobility - Same house 1 year ago (%)
Geographical mobility - Moved within same county (%)
Geographical mobility - Moved from different county within same state (%)
Geographical mobility - Moved from different state (%)
Geographical mobility - Moved from abroad (%)
Place of birth - Born in state of residence (%)
Place of birth - Born in other state (%)
Place of birth - Native, outside of US (%)
Place of birth - Foreign born (%)
Housing units in structures - 1, detached (%)
Housing units in structures - 1, attached (%)
Housing units in structures - 2 (%)
Housing units in structures - 3 or 4 (%)
Housing units in structures - 5 to 9 (%)
Housing units in structures - 10 to 19 (%)
Housing units in structures - 20 to 49 (%)
Housing units in structures - 50 or more (%)
Housing units in structures - Mobile home (%)
Housing units in structures - Boat, RV, van, etc. (%)
House/condo owner moved in on average (years ago)
Renter moved in on average (years ago)
Year householder moved into unit - Moved in 1999 to March 2000 (%)
Year householder moved into unit - Moved in 1995 to 1998 (%)
Year householder moved into unit - Moved in 1990 to 1994 (%)
Year householder moved into unit - Moved in 1980 to 1989 (%)
Year householder moved into unit - Moved in 1970 to 1979 (%)
Year householder moved into unit - Moved in 1969 or earlier (%)
Means of transportation to work - Drove car alone (%)
Means of transportation to work - Carpooled (%)
Means of transportation to work - Public transportation (%)
Means of transportation to work - Bus or trolley bus (%)
Means of transportation to work - Streetcar or trolley car (%)
Means of transportation to work - Subway or elevated (%)
Means of transportation to work - Railroad (%)
Means of transportation to work - Ferryboat (%)
Means of transportation to work - Taxicab (%)
Means of transportation to work - Motorcycle (%)
Means of transportation to work - Bicycle (%)
Means of transportation to work - Walked (%)
Means of transportation to work - Other means (%)
Working at home (%)
Industry diversity
Most Common Industries - Agriculture, forestry, fishing and hunting, and mining (%)
Most Common Industries - Agriculture, forestry, fishing and hunting (%)
Most Common Industries - Mining, quarrying, and oil and gas extraction (%)
Most Common Industries - Construction (%)
Most Common Industries - Manufacturing (%)
Most Common Industries - Wholesale trade (%)
Most Common Industries - Retail trade (%)
Most Common Industries - Transportation and warehousing, and utilities (%)
Most Common Industries - Transportation and warehousing (%)
Most Common Industries - Utilities (%)
Most Common Industries - Information (%)
Most Common Industries - Finance and insurance, and real estate and rental and leasing (%)
Most Common Industries - Finance and insurance (%)
Most Common Industries - Real estate and rental and leasing (%)
Most Common Industries - Professional, scientific, and management, and administrative and waste management services (%)
Most Common Industries - Professional, scientific, and technical services (%)
Most Common Industries - Management of companies and enterprises (%)
Most Common Industries - Administrative and support and waste management services (%)
Most Common Industries - Educational services, and health care and social assistance (%)
Most Common Industries - Educational services (%)
Most Common Industries - Health care and social assistance (%)
Most Common Industries - Arts, entertainment, and recreation, and accommodation and food services (%)
Most Common Industries - Arts, entertainment, and recreation (%)
Most Common Industries - Accommodation and food services (%)
Most Common Industries - Other services, except public administration (%)
Most Common Industries - Public administration (%)
Occupation diversity
Most Common Occupations - Management, business, science, and arts occupations (%)
Most Common Occupations - Management, business, and financial occupations (%)
Most Common Occupations - Management occupations (%)
Most Common Occupations - Business and financial operations occupations (%)
Most Common Occupations - Computer, engineering, and science occupations (%)
Most Common Occupations - Computer and mathematical occupations (%)
Most Common Occupations - Architecture and engineering occupations (%)
Most Common Occupations - Life, physical, and social science occupations (%)
Most Common Occupations - Education, legal, community service, arts, and media occupations (%)
Most Common Occupations - Community and social service occupations (%)
Most Common Occupations - Legal occupations (%)
Most Common Occupations - Education, training, and library occupations (%)
Most Common Occupations - Arts, design, entertainment, sports, and media occupations (%)
Most Common Occupations - Healthcare practitioners and technical occupations (%)
Most Common Occupations - Health diagnosing and treating practitioners and other technical occupations (%)
Most Common Occupations - Health technologists and technicians (%)
Most Common Occupations - Service occupations (%)
Most Common Occupations - Healthcare support occupations (%)
Most Common Occupations - Protective service occupations (%)
Most Common Occupations - Fire fighting and prevention, and other protective service workers including supervisors (%)
Most Common Occupations - Law enforcement workers including supervisors (%)
Most Common Occupations - Food preparation and serving related occupations (%)
Most Common Occupations - Building and grounds cleaning and maintenance occupations (%)
Most Common Occupations - Personal care and service occupations (%)
Most Common Occupations - Sales and office occupations (%)
Most Common Occupations - Sales and related occupations (%)
Most Common Occupations - Office and administrative support occupations (%)
Most Common Occupations - Natural resources, construction, and maintenance occupations (%)
Most Common Occupations - Farming, fishing, and forestry occupations (%)
Most Common Occupations - Construction and extraction occupations (%)
Most Common Occupations - Installation, maintenance, and repair occupations (%)
Most Common Occupations - Production, transportation, and material moving occupations (%)
Most Common Occupations - Production occupations (%)
Most Common Occupations - Transportation occupations (%)
Most Common Occupations - Material moving occupations (%)
People in Group quarters - Institutionalized population (%)
People in Group quarters - Correctional institutions (%)
People in Group quarters - Federal prisons and detention centers (%)
People in Group quarters - Halfway houses (%)
People in Group quarters - Local jails and other confinement facilities (including police lockups) (%)
People in Group quarters - Military disciplinary barracks (%)
People in Group quarters - State prisons (%)
People in Group quarters - Other types of correctional institutions (%)
People in Group quarters - Nursing homes (%)
People in Group quarters - Hospitals/wards, hospices, and schools for the handicapped (%)
People in Group quarters - Hospitals/wards and hospices for chronically ill (%)
People in Group quarters - Hospices or homes for chronically ill (%)
People in Group quarters - Military hospitals or wards for chronically ill (%)
People in Group quarters - Other hospitals or wards for chronically ill (%)
People in Group quarters - Hospitals or wards for drug/alcohol abuse (%)
People in Group quarters - Mental (Psychiatric) hospitals or wards (%)
People in Group quarters - Schools, hospitals, or wards for the mentally retarded (%)
People in Group quarters - Schools, hospitals, or wards for the physically handicapped (%)
People in Group quarters - Institutions for the deaf (%)
People in Group quarters - Institutions for the blind (%)
People in Group quarters - Orthopedic wards and institutions for the physically handicapped (%)
People in Group quarters - Wards in general hospitals for patients who have no usual home elsewhere (%)
People in Group quarters - Wards in military hospitals for patients who have no usual home elsewhere (%)
People in Group quarters - Juvenile institutions (%)
People in Group quarters - Long-term care (%)
People in Group quarters - Homes for abused, dependent, and neglected children (%)
People in Group quarters - Residential treatment centers for emotionally disturbed children (%)
People in Group quarters - Training schools for juvenile delinquents (%)
People in Group quarters - Short-term care, detention or diagnostic centers for delinquent children (%)
People in Group quarters - Type of juvenile institution unknown (%)
People in Group quarters - Noninstitutionalized population (%)
People in Group quarters - College dormitories (includes college quarters off campus) (%)
People in Group quarters - Military quarters (%)
People in Group quarters - On base (%)
People in Group quarters - Barracks, unaccompanied personnel housing (UPH), (Enlisted/Officer), ;and similar group living quarters for military personnel (%)
People in Group quarters - Transient quarters for temporary residents (%)
People in Group quarters - Military ships (%)
People in Group quarters - Group homes (%)
People in Group quarters - Homes or halfway houses for drug/alcohol abuse (%)
People in Group quarters - Homes for the mentally ill (%)
People in Group quarters - Homes for the mentally retarded (%)
People in Group quarters - Homes for the physically handicapped (%)
People in Group quarters - Other group homes (%)
People in Group quarters - Religious group quarters (%)
People in Group quarters - Dormitories (%)
People in Group quarters - Agriculture workers' dormitories on farms (%)
People in Group quarters - Job Corps and vocational training facilities (%)
People in Group quarters - Other workers' dormitories (%)
People in Group quarters - Crews of maritime vessels (%)
People in Group quarters - Other nonhousehold living situations (%)
People in Group quarters - Other noninstitutional group quarters (%)
Residents speaking English at home (%)
Residents speaking English at home - Born in the United States (%)
Residents speaking English at home - Native, born elsewhere (%)
Residents speaking English at home - Foreign born (%)
Residents speaking Spanish at home (%)
Residents speaking Spanish at home - Born in the United States (%)
Residents speaking Spanish at home - Native, born elsewhere (%)
Residents speaking Spanish at home - Foreign born (%)
Residents speaking other language at home (%)
Residents speaking other language at home - Born in the United States (%)
Residents speaking other language at home - Native, born elsewhere (%)
Residents speaking other language at home - Foreign born (%)
Class of Workers - Employee of private company (%)
Class of Workers - Self-employed in own incorporated business (%)
Class of Workers - Private not-for-profit wage and salary workers (%)
Class of Workers - Local government workers (%)
Class of Workers - State government workers (%)
Class of Workers - Federal government workers (%)
Class of Workers - Self-employed workers in own not incorporated business and Unpaid family workers (%)
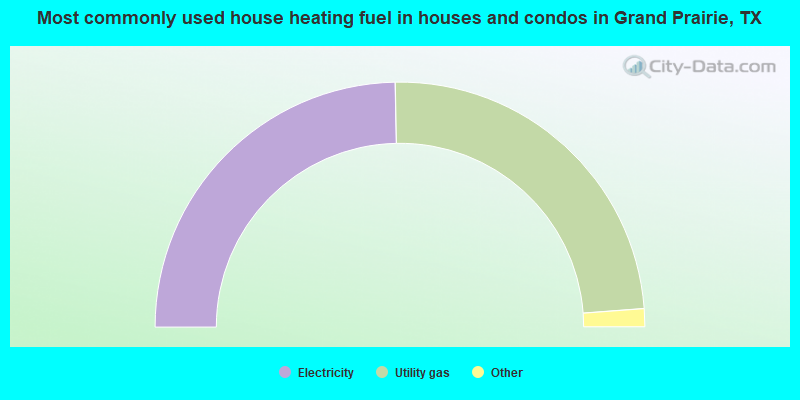
House heating fuel used in houses and condos - Utility gas (%)
House heating fuel used in houses and condos - Bottled, tank, or LP gas (%)
House heating fuel used in houses and condos - Electricity (%)
House heating fuel used in houses and condos - Fuel oil, kerosene, etc. (%)
House heating fuel used in houses and condos - Coal or coke (%)
House heating fuel used in houses and condos - Wood (%)
House heating fuel used in houses and condos - Solar energy (%)
House heating fuel used in houses and condos - Other fuel (%)
House heating fuel used in houses and condos - No fuel used (%)
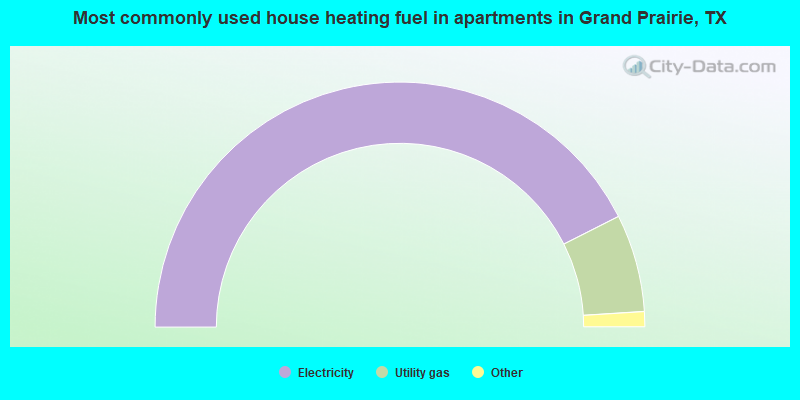
House heating fuel used in apartments - Utility gas (%)
House heating fuel used in apartments - Bottled, tank, or LP gas (%)
House heating fuel used in apartments - Electricity (%)
House heating fuel used in apartments - Fuel oil, kerosene, etc. (%)
House heating fuel used in apartments - Coal or coke (%)
House heating fuel used in apartments - Wood (%)
House heating fuel used in apartments - Solar energy (%)
House heating fuel used in apartments - Other fuel (%)
House heating fuel used in apartments - No fuel used (%)
Armed forces status - In Armed Forces (%)
Armed forces status - Civilian (%)
Armed forces status - Civilian - Veteran (%)
Armed forces status - Civilian - Nonveteran (%)
Fatal accidents locations in years 2005-2021
Fatal accidents locations in 2005
Fatal accidents locations in 2006
Fatal accidents locations in 2007
Fatal accidents locations in 2008
Fatal accidents locations in 2009
Fatal accidents locations in 2010
Fatal accidents locations in 2011
Fatal accidents locations in 2012
Fatal accidents locations in 2013
Fatal accidents locations in 2014
Fatal accidents locations in 2015
Fatal accidents locations in 2016
Fatal accidents locations in 2017
Fatal accidents locations in 2018
Fatal accidents locations in 2019
Fatal accidents locations in 2020
Fatal accidents locations in 2021
Alcohol use - People drinking some alcohol every month (%)
Alcohol use - People not drinking at all (%)
Alcohol use - Average days/month drinking alcohol
Alcohol use - Average drinks/week
Alcohol use - Average days/year people drink much
Audiometry - Average condition of hearing (%)
Audiometry - People that can hear a whisper from across a quiet room (%)
Audiometry - People that can hear normal voice from across a quiet room (%)
Audiometry - Ears ringing, roaring, buzzing (%)
Audiometry - Had a job exposure to loud noise (%)
Audiometry - Had off-work exposure to loud noise (%)
Blood Pressure & Cholesterol - Has high blood pressure (%)
Blood Pressure & Cholesterol - Checking blood pressure at home (%)
Blood Pressure & Cholesterol - Frequently checking blood cholesterol (%)
Blood Pressure & Cholesterol - Has high cholesterol level (%)
Consumer Behavior - Money monthly spent on food at supermarket/grocery store
Consumer Behavior - Money monthly spent on food at other stores
Consumer Behavior - Money monthly spent on eating out
Consumer Behavior - Money monthly spent on carryout/delivered foods
Consumer Behavior - Income spent on food at supermarket/grocery store (%)
Consumer Behavior - Income spent on food at other stores (%)
Consumer Behavior - Income spent on eating out (%)
Consumer Behavior - Income spent on carryout/delivered foods (%)
Current Health Status - General health condition (%)
Current Health Status - Blood donors (%)
Current Health Status - Has blood ever tested for HIV virus (%)
Current Health Status - Left-handed people (%)
Dermatology - People using sunscreen (%)
Diabetes - Diabetics (%)
Diabetes - Had a blood test for high blood sugar (%)
Diabetes - People taking insulin (%)
Diet Behavior & Nutrition - Diet health (%)
Diet Behavior & Nutrition - Milk product consumption (# of products/month)
Diet Behavior & Nutrition - Meals not home prepared (#/week)
Diet Behavior & Nutrition - Meals from fast food or pizza place (#/week)
Diet Behavior & Nutrition - Ready-to-eat foods (#/month)
Diet Behavior & Nutrition - Frozen meals/pizza (#/month)
Drug Use - People that ever used marijuana or hashish (%)
Drug Use - Ever used hard drugs (%)
Drug Use - Ever used any form of cocaine (%)
Drug Use - Ever used heroin (%)
Drug Use - Ever used methamphetamine (%)
Health Insurance - People covered by health insurance (%)
Kidney Conditions-Urology - Avg. # of times urinating at night
Medical Conditions - People with asthma (%)
Medical Conditions - People with anemia (%)
Medical Conditions - People with psoriasis (%)
Medical Conditions - People with overweight (%)
Medical Conditions - Elderly people having difficulties in thinking or remembering (%)
Medical Conditions - People who ever received blood transfusion (%)
Medical Conditions - People having trouble seeing even with glass/contacts (%)
Medical Conditions - People with arthritis (%)
Medical Conditions - People with gout (%)
Medical Conditions - People with congestive heart failure (%)
Medical Conditions - People with coronary heart disease (%)
Medical Conditions - People with angina pectoris (%)
Medical Conditions - People who ever had heart attack (%)
Medical Conditions - People who ever had stroke (%)
Medical Conditions - People with emphysema (%)
Medical Conditions - People with thyroid problem (%)
Medical Conditions - People with chronic bronchitis (%)
Medical Conditions - People with any liver condition (%)
Medical Conditions - People who ever had cancer or malignancy (%)
Mental Health - People who have little interest in doing things (%)
Mental Health - People feeling down, depressed, or hopeless (%)
Mental Health - People who have trouble sleeping or sleeping too much (%)
Mental Health - People feeling tired or having little energy (%)
Mental Health - People with poor appetite or overeating (%)
Mental Health - People feeling bad about themself (%)
Mental Health - People who have trouble concentrating on things (%)
Mental Health - People moving or speaking slowly or too fast (%)
Mental Health - People having thoughts they would be better off dead (%)
Oral Health - Average years since last visit a dentist
Oral Health - People embarrassed because of mouth (%)
Oral Health - People with gum disease (%)
Oral Health - General health of teeth and gums (%)
Oral Health - Average days a week using dental floss/device
Oral Health - Average days a week using mouthwash for dental problem
Oral Health - Average number of teeth
Pesticide Use - Households using pesticides to control insects (%)
Pesticide Use - Households using pesticides to kill weeds (%)
Physical Activity - People doing vigorous-intensity work activities (%)
Physical Activity - People doing moderate-intensity work activities (%)
Physical Activity - People walking or bicycling (%)
Physical Activity - People doing vigorous-intensity recreational activities (%)
Physical Activity - People doing moderate-intensity recreational activities (%)
Physical Activity - Average hours a day doing sedentary activities
Physical Activity - Average hours a day watching TV or videos
Physical Activity - Average hours a day using computer
Physical Functioning - People having limitations keeping them from working (%)
Physical Functioning - People limited in amount of work they can do (%)
Physical Functioning - People that need special equipment to walk (%)
Physical Functioning - People experiencing confusion/memory problems (%)
Physical Functioning - People requiring special healthcare equipment (%)
Prescription Medications - Average number of prescription medicines taking
Preventive Aspirin Use - Adults 40+ taking low-dose aspirin (%)
Reproductive Health - Vaginal deliveries (%)
Reproductive Health - Cesarean deliveries (%)
Reproductive Health - Deliveries resulted in a live birth (%)
Reproductive Health - Pregnancies resulted in a delivery (%)
Reproductive Health - Women breastfeeding newborns (%)
Reproductive Health - Women that had a hysterectomy (%)
Reproductive Health - Women that had both ovaries removed (%)
Reproductive Health - Women that have ever taken birth control pills (%)
Reproductive Health - Women taking birth control pills (%)
Reproductive Health - Women that have ever used Depo-Provera or injectables (%)
Reproductive Health - Women that have ever used female hormones (%)
Sexual Behavior - People 18+ that ever had sex (vaginal, anal, or oral) (%)
Sexual Behavior - Males 18+ that ever had vaginal sex with a woman (%)
Sexual Behavior - Males 18+ that ever performed oral sex on a woman (%)
Sexual Behavior - Males 18+ that ever had anal sex with a woman (%)
Sexual Behavior - Males 18+ that ever had any sex with a man (%)
Sexual Behavior - Females 18+ that ever had vaginal sex with a man (%)
Sexual Behavior - Females 18+ that ever performed oral sex on a man (%)
Sexual Behavior - Females 18+ that ever had anal sex with a man (%)
Sexual Behavior - Females 18+ that ever had any kind of sex with a woman (%)
Sexual Behavior - Average age people first had sex
Sexual Behavior - Average number of female sex partners in lifetime (males 18+)
Sexual Behavior - Average number of female vaginal sex partners in lifetime (males 18+)
Sexual Behavior - Average age people first performed oral sex on a woman (18+)
Sexual Behavior - Average number of woman performed oral sex on in lifetime (18+)
Sexual Behavior - Average number of male sex partners in lifetime (males 18+)
Sexual Behavior - Average number of male anal sex partners in lifetime (males 18+)
Sexual Behavior - Average age people first performed oral sex on a man (18+)
Sexual Behavior - Average number of male oral sex partners in lifetime (18+)
Sexual Behavior - People using protection when performing oral sex (%)
Sexual Behavior - Average number of times people have vaginal or anal sex a year
Sexual Behavior - People having sex without condom (%)
Sexual Behavior - Average number of male sex partners in lifetime (females 18+)
Sexual Behavior - Average number of male vaginal sex partners in lifetime (females 18+)
Sexual Behavior - Average number of female sex partners in lifetime (females 18+)
Sexual Behavior - Circumcised males 18+ (%)
Sleep Disorders - Average hours sleeping at night
Sleep Disorders - People that has trouble sleeping (%)
Smoking-Cigarette Use - People smoking cigarettes (%)
Taste & Smell - People 40+ having problems with smell (%)
Taste & Smell - People 40+ having problems with taste (%)
Taste & Smell - People 40+ that ever had wisdom teeth removed (%)
Taste & Smell - People 40+ that ever had tonsils teeth removed (%)
Taste & Smell - People 40+ that ever had a loss of consciousness because of a head injury (%)
Taste & Smell - People 40+ that ever had a broken nose or other serious injury to face or skull (%)
Taste & Smell - People 40+ that ever had two or more sinus infections (%)
Weight - Average height (inches)
Weight - Average weight (pounds)
Weight - Average BMI
Weight - People that are obese (%)
Weight - People that ever were obese (%)
Weight - People trying to lose weight (%)
According to our research of Texas and other state lists, there were 258 registered sex offenders living in Grand Prairie, Texas as of April 27, 2024 . The ratio of all residents to sex offenders in Grand Prairie is 739 to 1.The ratio of registered sex offenders to all residents in this city is lower than the state average.
The City-Data.com crime index weighs serious crimes and violent crimes more heavily. Higher means more crime, U.S. average is 246.1. It adjusts for the number of visitors and daily workers commuting into cities.
- means the value is smaller than the state average.
- means the value is about the same as the state average.
- means the value is bigger than the state average.
- means the value is much bigger than the state average.
Crime rate in Grand Prairie detailed stats: murders, rapes, robberies, assaults, burglaries, thefts, arson Officers per 1,000 residents here:
1.42Texas average:
2.07
Latest news from Grand Prairie, TX collected exclusively by city-data.com from local newspapers, TV, and radio stations
Grand Prairie, TX City Guides: Ancestries: American (3.1%), English (2.5%), Nigerian (2.0%), African (1.8%), German (1.6%), Irish (1.4%).
Current Local Time:
Land area: 71.4 square miles.
Population density: 2,827 people per square mile (average).
49,449 residents are foreign born (16.0% Latin America , 4.6% Asia , 2.8% Africa ).
This city:
25.1%Texas:
17.1%
Median real estate property taxes paid for housing units with mortgages in 2022: $5,273 (1.7%)Median real estate property taxes paid for housing units with no mortgage in 2022: $3,539 (1.4%)
Nearest city with pop. 200,000+: Arlington, TX
Nearest city with pop. 1,000,000+: Dallas, TX
Nearest cities:
Latitude: 32.72 N, Longitude: 97.02 W
Daytime population change due to commuting: -11,831 (-5.9%)Workers who live and work in this city: 32,659 (30.7%)
Area codes: 972, 214, 469
Property values in Grand Prairie, TX
Grand Prairie tourist attractions:
Single-family new house construction building permits:
2022: 335 buildings , average cost: $249,1002021: 1233 buildings , average cost: $239,2002020: 418 buildings , average cost: $233,6002019: 208 buildings , average cost: $237,1002018: 111 buildings , average cost: $236,4002017: 257 buildings , average cost: $230,3002016: 392 buildings , average cost: $234,0002015: 473 buildings , average cost: $283,7002014: 394 buildings , average cost: $212,8002013: 400 buildings , average cost: $201,2002012: 351 buildings , average cost: $191,9002011: 346 buildings , average cost: $180,9002010: 387 buildings , average cost: $174,9002009: 318 buildings , average cost: $179,6002008: 544 buildings , average cost: $174,2002007: 1058 buildings , average cost: $165,0002006: 1942 buildings , average cost: $160,8002005: 2551 buildings , average cost: $154,2002004: 1595 buildings , average cost: $146,7002003: 1447 buildings , average cost: $149,9002002: 1007 buildings , average cost: $140,1002001: 871 buildings , average cost: $127,0002000: 896 buildings , average cost: $128,4001999: 920 buildings , average cost: $123,3001998: 741 buildings , average cost: $110,2001997: 560 buildings , average cost: $115,400Unemployment in December 2023:
Population change in the 1990s: +27,493 (+27.5%).
Most common occupations in Grand Prairie, TX (%)
Both Males Females
Other management occupations, except farmers and farm managers (5.4%)
Cooks and food preparation workers (4.6%)
Driver/sales workers and truck drivers (3.9%)
Building and grounds cleaning and maintenance occupations (3.6%)
Customer service representatives (3.4%)
Material recording, scheduling, dispatching, and distributing workers (3.4%)
Other office and administrative support workers, including supervisors (3.2%)
Driver/sales workers and truck drivers (6.5%)
Other management occupations, except farmers and farm managers (5.2%)
Material recording, scheduling, dispatching, and distributing workers (4.5%)
Building and grounds cleaning and maintenance occupations (4.1%)
Cooks and food preparation workers (3.9%)
Laborers and material movers, hand (3.7%)
Electrical equipment mechanics and other installation, maintenance, and repair workers, including supervisors (3.5%)
Customer service representatives (5.8%)
Other management occupations, except farmers and farm managers (5.6%)
Cooks and food preparation workers (5.4%)
Other office and administrative support workers, including supervisors (5.0%)
Registered nurses (4.0%)
Cashiers (3.8%)
Secretaries and administrative assistants (3.7%)
Tornado activity:
Grand Prairie-area historical tornado activity is above Texas state average. It is 155% greater than the overall U.S. average.
On 4/25/1994, a category F4 (max. wind speeds 207-260 mph) tornado 17.5 miles away from the Grand Prairie city center killed 3 people and injured 48 people and caused between $50,000,000 and $500,000,000 in damages.
On 3/28/2000, a category F3 (max. wind speeds 158-206 mph) tornado 3.2 miles away from the city center .
Earthquake activity:
Grand Prairie-area historical earthquake activity is significantly above Texas state average. It is 459% greater than the overall U.S. average. On 11/6/2011 at 03:53:10, a magnitude 5.7 (5.7 MW, Depth: 3.2 mi, Class: Moderate, Intensity: VI - VII) earthquake occurred 195.4 miles away from the city center On 9/3/2016 at 12:02:44, a magnitude 5.8 (5.8 MW, Depth: 3.5 mi) earthquake occurred 256.6 miles away from Grand Prairie center On 6/16/1978 at 11:46:54, a magnitude 5.3 (4.4 MB, 4.6 UK, 5.3 ML) earthquake occurred 218.9 miles away from Grand Prairie center On 5/17/2012 at 08:12:00, a magnitude 4.8 (4.8 MW, Depth: 3.1 mi, Class: Light, Intensity: IV - V) earthquake occurred 164.1 miles away from Grand Prairie center On 5/7/2015 at 22:58:05, a magnitude 4.0 (4.0 MW, Depth: 1.6 mi) earthquake occurred 16.9 miles away from the city center On 11/7/2016 at 01:44:24, a magnitude 5.0 (5.0 MW, Depth: 2.8 mi) earthquake occurred 226.9 miles away from Grand Prairie center Magnitude types: body-wave magnitude (MB), local magnitude (ML), moment magnitude (MW) Natural disasters: The number of natural disasters in Dallas County (21) is greater than the US average (15).Major Disasters (Presidential) Declared: 9Emergencies Declared: 10Hurricanes: 7, Storms: 7, Floods: 5, Tornadoes: 5, Fires: 4, Winds: 2, Flash Flood: 1, Winter Storm: 1, Other: 2 (Note: some incidents may be assigned to more than one category). Main business address for: PRECIS INC SERVICES-BUSINESS SERVICES, NEC ), 3CI COMPLETE COMPLIANCE CORP HAZARDOUS WASTE MANAGEMENT ).
Hospitals in Grand Prairie: 1102 FORT SCOTT TRAIL (1102 FORT SCOTT TRAIL) 3502 GLENDA (3502 GLENDA) AMICUS AT WOODSIDE (2213 WOODSIDE DR) ANOINTED CAREGIVERS (838 SOUTH CARRIER PARKWAY) COVENTRY HOUSE (4333 COVENTRY) DALLAS/FORT WORTH MEDICAL CENTER (provides emergency services, 2709 HOSPITAL BLVD) EMBERS TRAIL HOUSE (4925 EMBERS TRAIL) PHOENIX HOSPICE LP (2080 NORTH HIGHWAY 360 SUITE 330) TEXAS GENERAL HOSPITAL (Proprietary, provides emergency services, 2709 HOSPITAL BLVD) Nursing Homes in Grand Prairie: GRAND PRAIRIE HEALTHCARE CENTER (820 SMALL ST) GREAT SOUTHWEST CONV CTR (2337 DOREEN ST) KERN PLACE (820 SMALL STREET) METROPLEX CARE CENTER (658 THIRD S W STREET) METROPLEX NURSING AND REHABILITATION LP (658 SW 3RD ST) PRAIRIE BREEZE CONVALESCENT CENTER (820 SMALL STREET) PRAIRIE MEADOWS (2337 DOREEN STREET) ROYAL MANOR CARE CENTER (2337 DOREEN STREET) Dialysis Facilities in Grand Prairie: FRESENIUS MEDICAL CARE GRAND PRAIRIE (825 DALWORTH STREET) GRAND PRAIRIE DIALYSIS CENTER INC (550 S CARRIER PARKWAY) TARRANT DIALYSIS CENTER - GRAND PRAIRIE (1006 NORTH CARRIER PARKWAY) Home Health Centers in Grand Prairie: 1ST PRECIOUS HOME HEALTHCARE AGENCY (5928 SUMMERWOOD DRIVE) ANGEL CARE HOME HEALTH SERVICES INC (1839 SOUTH CARRIER PARKWAY) BLESSED TOUCH HOME HEALTH AGENCY INC (5804 WEATHERED TRAIL) COVENANT PLUS HEALTH CARE INC (537 ESTATE DR) GIFTED HEALTHCARE INC (2454 FRONTIER DRIVE) INTEGRITY HOME HEALTH CARE SERVICES (1106 N HIGHWAY 360 SUITE 300) KEYSTONE HEALTHCARE INC (524 TERESA LANE) METROCREST HEALTH INC (2304 OAK LANE SUITE 100) SAFEWAY HEALTHCARE SERVICES INC (2772 PORTSIDE DR) SPLENDOR CARE HEALTH SERVICES INC (2467 HARBOUR DRIVE) Amtrak stations near Grand Prairie: 13 miles: DALLAS (400 S. HOUSTON ST.) Services: ticket office, fully wheelchair accessible, enclosed waiting area, public restrooms, public payphones, vending machines, paid short-term parking, paid long-term parking, call for car rental service, taxi stand, public transit connection.
19 miles: FORT WORTH (1501 JONES ST.) Services: ticket office, fully wheelchair accessible, enclosed waiting area, public restrooms, public payphones, vending machines, free short-term parking, paid long-term parking, call for car rental service, call for taxi service, public transit connection.
Colleges/Universities in Grand Prairie: Lincoln College of Technology-Grand Prairie Full-time enrollment: 965; Location: 2915 Alouette Drive; Private, for-profit; Website: lincolntech.com)
Concorde Career College-Grand Prairie Full-time enrollment: 725; Location: 305 W. Interstate 20; Private, for-profit; Website: www.concorde.edu)
Fortis Institute-Grand Prairie Full-time enrollment: 535; Location: 401 E Palace Pkwy Ste 100; Private, for-profit; Website: www.fortis.edu/)
Arlington Career Institute Full-time enrollment: 248; Location: 901 Ave K; Private, for-profit; Website: www.arlingtonci.com)
Tint School of Makeup and Cosmetology-Grand Prairie Full-time enrollment: 78; Location: 311-A East Highway 303; Private, for-profit; Website: tintschoolofmakeupandcosmetology.com/)
M T Training Center Full-time enrollment: 63; Location: 1801 S. Great Southwest Parkway; Private, for-profit; Website: mttrainingcenter.org)
Colleges/universities with over 2000 students nearest to Grand Prairie:
Dallas Baptist University (about 5 miles; Dallas, TX ; Full-time enrollment: 4,280)
The University of Texas at Arlington (about 6 miles; Arlington, TX ; FT enrollment: 27,453)
Mountain View College (about 7 miles; Dallas, TX ; FT enrollment: 4,988)
University of Dallas (about 11 miles; Irving, TX ; FT enrollment: 2,192)
North Lake College (about 12 miles; Irving, TX ; FT enrollment: 6,191)
El Centro College (about 14 miles; Dallas, TX ; FT enrollment: 6,086)
DeVry University-Texas (about 16 miles; Irving, TX ; FT enrollment: 4,098)
Biggest public high schools in Grand Prairie: SOUTH GRAND PRAIRIE H S Students: 2,416, Location: 301 W WARRIOR TRL, Grades: 9-12)GRAND PRAIRIE H S Students: 2,049, Location: 101 HIGH SCHOOL DR, Grades: 9-12)SOUTH GRAND PRAIRIE HIGH 9TH GRADE CTR Students: 849, Location: 305 W WARRIOR TRL, Grades: 9-11)JOHN A DUBISKI CAREER H S Students: 781, Location: 2990 S HWY 161, Grades: 9-12)RONALD W REAGAN MIDDLE Students: 768, Location: 4616 E BARDIN RD, Grades: 6-9)JOHN ADAMS MIDDLE Students: 387, Location: 833 W TARRANT RD, Grades: 6-9)CROSSWINDS H S Students: 368, Location: 1100 N CARRIER PKWY, Grades: 9-12)LYNDON B JOHNSON DAEP Students: 268, Location: 650 STONEWALL DR, Grades: 6-12)ADVANTAGE ACADEMY Location: 955 FREETOWN RD, Grades: PK-12, Charter school )
WINFREE ACADEMY CHARTER SCHOOL - GRAND PRAIRIE Location: 2985 S STATE HWY 360 STE 160, Grades: 9-12, Charter school )
Biggest public elementary/middle schools in Grand Prairie: CROUCH EL Students: 1,024, Location: 2810 PRAIRIE HILL LN, Grades: PK-6)FARRELL EL Students: 863, Location: 3410 PALADIUM DR, Grades: PK-6)LARSON EL Students: 759, Location: 2620 AVE K, Grades: PK-6)STARRETT EL Students: 716, Location: 2675 FAIRMONT DR, Grades: PK-6)HARRY S TRUMAN MIDDLE Students: 697, Location: 1501 COFFEYVILLE TRL, Grades: 6-8)ANNA MAY DAULTON EL Students: 673, Location: 2607 N GRAND PENINSULA DR, Grades: PK-4)JUAN N SEGUIN EL Students: 653, Location: 1450 S E FOURTH ST, Grades: KG-5)SALLYE R MOORE EL Students: 632, Location: 3150 WATERWOOD DR, Grades: PK-5)MIKE MOSELEY EL Students: 573, Location: 1851 CAMP WISDOM RD, Grades: PK-5)ERVIN C WHITT EL Students: 571, Location: 3320 S EDELWEISS, Grades: PK-5)Private elementary/middle schools in Grand Prairie: IMMACULATE CONCEPTION SCHOOL Students: 125, Location: 400 NE 17TH ST, Grades: PK-8)
CALVARY BAPTIST SCHOOL Students: 52, Location: 428 W CHURCH ST, Grades: PK-1)
See full list of schools located in Grand Prairie Library in Grand Prairie: GRAND PRAIRIE PUBLIC LIBRARY SYSTEM Operating income: $2,565,083; Location: 901 CONOVER DR; 184,539 books ; 29 e-books ; 9,503 audio materials ; 7,465 video materials ; 20 local licensed databases ; 59 state licensed databases ; 462 print serial subscriptions )
Notable locations in Grand Prairie: (A) , Central Regional Wastewater System (B) , Trinity River Water Authority (C) , Grand Prairie Fire Department Station 1 (D) , Grand Prairie Fire Department Station 5 (E) , Grand Prairie Fire Department Station 4 (F) , Grand Prairie Fire Department Station 3 (G) , Grand Prairie Fire Department Station 2 (H) , Grand Prairie Fire Department Station 8 (I) , Grand Prairie Fire Department Station 9 (J) , Grand Prairie Fire Department Station 6 (K) , Grand Prairie Fire Department Station 7 (L) . Display/hide their locations on the map
Shopping Center: (1) . Display/hide its location on the map
Main business address in Grand Prairie include: (A) , 3CI COMPLETE COMPLIANCE CORP (B) . Display/hide their locations on the map
Churches in Grand Prairie include: (A) , Saint Joseph Church (B) , Iglesia Pentacostal Misionera Church (C) , First United Pentecostal Church (D) , Calvary Tabernacle Pentecostal Church of God (E) , The Church of Jesus Christ of Latter Day Saints (F) , Seventh Day Adventist Church (G) , Grand Prairie Spanish Seventh Day Adventist Church (H) , Trinity Presbyterian Church (I) . Display/hide their locations on the map
Cemeteries: (1) , Southland Memorial Park (2) , Estes Cemetery (3) , Ford Cemetery (4) . Display/hide their locations on the map
Lakes and reservoirs: (A) , Bluebonnet Lakes (B) , Soil Conservation Service Site 11 Reservoir (C) , Joe Pool Lake (D) . Display/hide their locations on the map
Streams, rivers, and creeks: (A) , Soap Creek (B) , Newton Branch (C) , Lynn Creek (D) , Low Branch (E) , Hollings Branch (F) , Johnson Creek (G) , Kirby Creek (H) , Cottonwood Creek (I) . Display/hide their locations on the map
Parks in Grand Prairie include: (1) , Lamar Park (2) , Kirby Creek Park (3) , L T V Park (4) , Holland Street Park (5) , Hendrix Park (6) , Hill Street Park (7) , Turner Park (8) , Peppermint Park (9) . Display/hide their locations on the map
Hotels: (1) , Amerisuites (1542 North State Highway 360) (2) , Comfort Inn (4020 South Great Southwest Parkway) (3) , Best Value Inn & Suites (1108 North State Highway 360) (4) , Budget Suites Of America-Gr Prairie (2770 N State Highway 360) (5) , Budget Suites of America (1050 North State Highway 360) (6) , Ace Textiles Products (2109 Galveston Street) (7) , Comfort Inn Grand Prairie (4020 Great Southwest Parkway) (8) . Display/hide their approximate locations on the map
Birthplace of: Selena Gomez - Actress, T. Michael Moseley - General, Andre Akpan - Association football player, Charley Taylor - Football player, Michael Choice - Baseball player, Wesley Duke - 2005 NFL player (Denver Broncos, born : Jun 21, 1981), Chase Wileman - Soccer player, Julie Stepan - Female model, Nikki McKibbin, Aaron Curtis - College basketball player (TCU Horned Frogs).
Dallas County has a predicted average indoor radon screening level less than 2 pCi/L (pico curies per liter) - Low Potential Drinking water stations with addresses in Grand Prairie and their reported violations in the past:
LONDON PROPERTY LLC (Serves IL, Population served: 35, Groundwater):
Past health violations:
MCL, Monthly (TCR) - Between JAN-2007 and DEC-2007, Contaminant: Coliform. Follow-up actions: St Violation/Reminder Notice (JUL-10-2007), St Compliance achieved (NOV-29-2007)
MCL, Monthly (TCR) - Between JAN-2006 and DEC-2006, Contaminant: Coliform. Follow-up actions: St Boil Water Order (OCT-05-2006), St Compliance achieved (NOV-20-2006)
Past monitoring violations:
Follow-up Or Routine LCR Tap M/R - In JUL-01-2006, Contaminant: Lead and Copper Rule. Follow-up actions: St Public Notif requested (AUG-15-2006), St Violation/Reminder Notice (AUG-15-2006), St Compliance achieved (APR-04-2007)
112 regular monitoring violations
Drinking water stations with addresses in Grand Prairie that have no violations reported:
SUNSET GOLF CLUB (Population served: 47, Primary Water Source Type: Groundwater)
Average household size: This city:
3.0 peopleTexas:
2.8 people
Percentage of family households: This city:
74.1%Whole state:
69.9%
Percentage of households with unmarried partners: This city:
6.7%Whole state:
6.0%
Likely homosexual households (counted as self-reported same-sex unmarried-partner households)
Lesbian couples: 0.4% of all households Gay men: 0.3% of all households
People in group quarters in Grand Prairie in 2010:
188 people in nursing facilities/skilled-nursing facilities
45 people in other noninstitutional facilities
18 people in group homes intended for adults
6 people in workers' group living quarters and job corps centers
People in group quarters in Grand Prairie in 2000:
377 people in nursing homes
30 people in religious group quarters
8 people in homes for the mentally retarded
5 people in other noninstitutional group quarters
Banks with most branches in Grand Prairie (2011 data):
JPMorgan Chase Bank, National Association: 3980 South Carrier Parkway Branch, South Carrier Parkway Branch, Grand Prairie Branch, Post & Paddock Branch, Camp Wisdom And 360 Branch. Info updated 2011/11/10: Bank assets: $1,811,678.0 mil, Deposits: $1,190,738.0 mil, headquarters in Columbus, OH, positive income , International Specialization, 5577 total offices , Holding Company: Jpmorgan Chase & Co.
First National Bank Texas: Carrier Parkway Banking Center - Rc, Grand Prairie Banking Center - Rc 83, Pioneer Parkway Banking Center - Rc. Info updated 2006/11/03: Bank assets: $944.3 mil, Deposits: $815.9 mil, headquarters in Killeen, TX, positive income , Mortgage Lending Specialization, 250 total offices , Holding Company: First Community Bancshares, Inc.
Bank of America, National Association: Grand Prairie Branch, Grand Prairie Motor Branch, Ih-20 & Grand Southwest Parkway Bran. Info updated 2009/11/18: Bank assets: $1,451,969.3 mil, Deposits: $1,077,176.8 mil, headquarters in Charlotte, NC, positive income , 5782 total offices , Holding Company: Bank Of America Corporation
Wells Fargo Bank, National Association: Grand Prairie Branch, Grand Prairie Towne Crossing Branch, Carrier And I-20 Branch. Info updated 2011/04/05: Bank assets: $1,161,490.0 mil, Deposits: $905,653.0 mil, headquarters in Sioux Falls, SD, positive income , 6395 total offices , Holding Company: Wells Fargo & Company
Grand Bank of Texas: Carrier Parkway Branch at 530 S. Carrier Parkway, branch established on 1999/08/16; Grand Bank Of Texas at 2341 South Belt Line Road, branch established on 1975/06/13. Info updated 2006/11/03: Bank assets: $126.1 mil, Deposits: $116.9 mil, local headquarters , negative income in the last year , Commercial Lending Specialization, 5 total offices , Holding Company: Casey Bancorp, Inc
ViewPoint Bank, National Association: Grand Prairie Is Branch at 215 North Carrier Parkway, branch established on 2006/01/01. Info updated 2012/01/06: Bank assets: $3,179.7 mil, Deposits: $2,050.8 mil, headquarters in Plano, TX, positive income , Mortgage Lending Specialization, 24 total offices , Holding Company: Viewpoint Financial Group, Inc.
City Bank: Grand Prairie Branch at 2615 W. Pioneer Parkway Suite #101, branch established on 2007/10/29. Info updated 2010/10/28: Bank assets: $2,020.1 mil, Deposits: $1,776.1 mil, headquarters in Lubbock, TX, positive income , Commercial Lending Specialization, 25 total offices , Holding Company: South Plains Financial, Inc. Employee Stock Ownership Plan
Woodforest National Bank: Grand Prairie Wal-Mart Branch at 2225 W. Interstate 20, branch established on 2001/06/20. Info updated 2011/05/10: Bank assets: $3,488.9 mil, Deposits: $3,097.6 mil, headquarters in Houston, TX, positive income , Commercial Lending Specialization, 766 total offices , Holding Company: Woodforest Financial Group Employee Stock Ownership Plan (With 401(K) Provisions)
Herring Bank: Grand Prairie Branch at 2317 S. Beltline Road, branch established on 2010/03/24. Info updated 2009/08/03: Bank assets: $562.6 mil, Deposits: $493.9 mil, headquarters in Amarillo, TX, positive income , Commercial Lending Specialization, 16 total offices , Holding Company: Herring Bancorp, Inc.
For population 15 years and over in Grand Prairie:
Never married: 32.8%Now married: 52.6%Separated: 2.1%Widowed: 3.5%Divorced: 9.0% For population 25 years and over in Grand Prairie:
High school or higher: 83.0%Bachelor's degree or higher: 28.7%Graduate or professional degree: 9.9%Unemployed: 5.4%Mean travel time to work (commute): 26.8 minutes
Education Gini index (Inequality in education) Here:
14.6Texas average:
14.0
Religion statistics for Grand Prairie, TX (based on Dallas County data)
Religion Adherents Congregations Evangelical Protestant 615,849 1,672 Catholic 446,996 57 Mainline Protestant 166,224 240 Other 147,445 174 Black Protestant 69,831 174 Orthodox 8,813 19 None 912,981 -
Source: Clifford Grammich, Kirk Hadaway, Richard Houseal, Dale E.Jones, Alexei Krindatch, Richie Stanley and Richard H.Taylor. 2012. 2010 U.S.Religion Census: Religious Congregations & Membership Study. Association of Statisticians of American Religious Bodies. Jones, Dale E., et al. 2002. Congregations and Membership in the United States 2000. Nashville, TN: Glenmary Research Center. Graphs represent county-level data
Food Environment Statistics: Number of grocery stores : 392Dallas County :
1.64 / 10,000 pop.Texas :
1.47 / 10,000 pop.
Number of supercenters and club stores : 25Dallas County :
0.10 / 10,000 pop.Texas :
0.14 / 10,000 pop.
Number of convenience stores (no gas) : 275Dallas County :
1.15 / 10,000 pop.State :
1.11 / 10,000 pop.
Number of convenience stores (with gas) : 673Here :
2.82 / 10,000 pop.Texas :
3.95 / 10,000 pop.
Number of full-service restaurants : 1,603Dallas County :
6.73 / 10,000 pop.Texas :
6.13 / 10,000 pop.
Adult obesity rate : This county :
27.1%State :
26.6%
Low-income preschool obesity rate : Health and Nutrition: Healthy diet rate : This city:
47.9%State:
48.6%
Average overall health of teeth and gums : Grand Prairie:
46.9%Texas:
47.4%
Average BMI : Grand Prairie:
28.6Texas:
28.5
People feeling badly about themselves : This city:
20.8%Texas:
20.6%
People not drinking alcohol at all : This city:
10.6%Texas:
10.3%
Average hours sleeping at night : Grand Prairie:
6.7Texas:
6.8
Overweight people : This city:
32.4%Texas:
33.1%
General health condition : Grand Prairie:
56.2%Texas:
56.2%
Average condition of hearing : This city:
81.6%State:
80.7%
More about Health and Nutrition of Grand Prairie, TX Residents
Local government employment and payroll (March 2022)
Function
Full-time employees
Monthly full-time payroll
Average yearly full-time wage
Part-time employees
Monthly part-time payroll
Police Protection - Officers
269 $2,054,385 $91,645 3 $4,851 Firefighters
220 $1,847,952 $100,797 0 $0 Other and Unallocable
148 $806,485 $65,391 9 $14,384 Parks and Recreation
145 $600,353 $49,684 143 $128,647 Police - Other
131 $994,052 $91,058 7 $11,937 Financial Administration
62 $449,809 $87,060 1 $1,334 Streets and Highways
59 $264,171 $53,730 0 $0 Health
45 $195,143 $52,038 6 $5,513 Water Supply
43 $192,932 $53,841 0 $0 Welfare
39 $183,454 $56,447 3 $4,271 Judicial and Legal
35 $210,989 $72,339 8 $18,284 Fire - Other
34 $279,816 $98,759 4 $8,564 Other Government Administration
34 $295,796 $104,399 3 $4,655 Solid Waste Management
30 $129,210 $51,684 2 $2,122 Sewerage
27 $113,479 $50,435 0 $0 Local Libraries
25 $110,343 $52,965 19 $21,824 Housing and Community Development (Local)
20 $101,122 $60,673 0 $0 Airports
5 $29,543 $70,903 0 $0 Natural Resources
2 $12,391 $74,346 0 $0
Totals for Government
1,373 $8,871,425 $77,536 208 $226,387
Grand Prairie government finances - Expenditure in 2021 (per resident):
Construction - Regular Highways: $36,792,000 ($182.28)
General Public Buildings: $22,794,000 ($112.93)Parks and Recreation: $13,003,000 ($64.42)Water Utilities: $4,723,000 ($23.40)Natural Resources - Other: $4,234,000 ($20.98)Local Fire Protection: $4,124,000 ($20.43)Sewerage: $2,531,000 ($12.54)Libraries: $1,638,000 ($8.12)Solid Waste Management: $619,000 ($3.07)Air Transportation: $510,000 ($2.53)Transit Utilities: $333,000 ($1.65)Police Protection: $150,000 ($0.74)Current Operations - Police Protection: $64,151,000 ($317.83)
Local Fire Protection: $36,913,000 ($182.88)General - Other: $30,594,000 ($151.57)Regular Highways: $30,102,000 ($149.14)Sewerage: $25,123,000 ($124.47)Central Staff Services: $21,656,000 ($107.29)Solid Waste Management: $12,636,000 ($62.60)Financial Administration: $11,826,000 ($58.59)Parks and Recreation: $11,690,000 ($57.92)Water Utilities: $11,502,000 ($56.98)Health - Other: $5,452,000 ($27.01)Judicial and Legal Services: $4,595,000 ($22.77)General Public Buildings: $4,300,000 ($21.30)Miscellaneous Commercial Activities - Other: $4,148,000 ($20.55)Libraries: $3,310,000 ($16.40)Correctional Institutions: $3,187,000 ($15.79)Natural Resources - Other: $2,743,000 ($13.59)Air Transportation: $2,035,000 ($10.08)Transit Utilities: $633,000 ($3.14)Public Welfare - Other: $19,000 ($0.09)General - Interest on Debt: $14,009,000 ($69.41)
Intergovernmental to Local - Other - Regular Highways: $3,263,000 ($16.17)
Other - Health - Other: $39,000 ($0.19)Other Capital Outlay - Solid Waste Management: $1,635,000 ($8.10)
Local Fire Protection: $1,502,000 ($7.44)Sewerage: $919,000 ($4.55)Police Protection: $785,000 ($3.89)Regular Highways: $764,000 ($3.79)Water Utilities: $643,000 ($3.19)General - Other: $350,000 ($1.73)Parks and Recreation: $287,000 ($1.42)Central Staff Services: $42,000 ($0.21)Health - Other: $24,000 ($0.12)Total Salaries and Wages: $103,875,000 ($514.63)
Water Utilities - Interest on Debt: $1,605,000 ($7.95)
Grand Prairie government finances - Revenue in 2021 (per resident):
Charges - Sewerage: $29,795,000 ($147.61)
Parks and Recreation: $14,531,000 ($71.99)Solid Waste Management: $14,150,000 ($70.10)Other: $6,530,000 ($32.35)Air Transportation: $1,996,000 ($9.89)Miscellaneous Commercial Activities: $1,602,000 ($7.94)Federal Intergovernmental - Housing and Community Development: $40,138,000 ($198.86)
Public Welfare: $564,000 ($2.79)Transit Utilities: $402,000 ($1.99)Air Transportation: $206,000 ($1.02)Local Intergovernmental - Highways: $3,843,000 ($19.04)
Other: $2,025,000 ($10.03)Transit Utilities: $286,000 ($1.42)Miscellaneous - Special Assessments: $10,876,000 ($53.88)
Fines and Forfeits: $8,271,000 ($40.98)Interest Earnings: $6,693,000 ($33.16)Rents: $1,753,000 ($8.68)Sale of Property: $1,190,000 ($5.90)General Revenue - Other: $1,149,000 ($5.69)Royalties: $706,000 ($3.50)Donations From Private Sources: $190,000 ($0.94)Revenue - Water Utilities: $48,160,000 ($238.60)
Transit Utilities: $1,000 ($0.00)State Intergovernmental - Highways: $15,670,000 ($77.63)
Other: $991,000 ($4.91)General Local Government Support: $264,000 ($1.31)Transit Utilities: $133,000 ($0.66)Tax - Property: $110,142,000 ($545.68)
General Sales and Gross Receipts: $72,136,000 ($357.39)Public Utilities Sales: $15,699,000 ($77.78)Other License: $2,793,000 ($13.84)Occupation and Business License - Other: $514,000 ($2.55)Alcoholic Beverage License: $32,000 ($0.16)
Grand Prairie government finances - Debt in 2021 (per resident):
Long Term Debt - Beginning Outstanding - Unspecified Public Purpose: $511,670,000 ($2534.99)
Outstanding Unspecified Public Purpose: $473,074,000 ($2343.77)Retired Unspecified Public Purpose: $38,596,000 ($191.22)Beginning Outstanding - Public Debt for Private Purpose: $488,000 ($2.42)Outstanding Nonguaranteed - Industrial Revenue: $373,000 ($1.85)Retired Nonguaranteed - Public Debt for Private Purpose: $115,000 ($0.57)
Grand Prairie government finances - Cash and Securities in 2021 (per resident):
Bond Funds - Cash and Securities: $58,946,000 ($292.04)
Other Funds - Cash and Securities: $337,548,000 ($1672.33)
Sinking Funds - Cash and Securities: $9,319,000 ($46.17)
7.50% of this county's 2021 resident taxpayers lived in other counties in 2020 ($78,710 average adjusted gross income )
Here:
7.50%Texas average:
8.12%
0.01% of residents moved from foreign countries ($115 average AGI )Dallas County:
0.01%Texas average:
0.04%
Top counties from which taxpayers relocated into this county between 2020 and 2021:
8.56% of this county's 2020 resident taxpayers moved to other counties in 2021 ($74,660 average adjusted gross income )
Here:
8.56%Texas average:
7.40%
0.02% of residents moved to foreign countries ($227 average AGI )Dallas County:
0.02%Texas average:
0.03%
Top counties to which taxpayers relocated from this county between 2020 and 2021:
Businesses in Grand Prairie, TX
Name Count Name Count
24 Hour Fitness 1 LA Fitness 1 7-Eleven 5 La Quinta 2 ALDI 1 Lane Furniture 1 AT&T 3 Little Caesars Pizza 4 Ace Hardware 1 Long John Silver's 1 Albertsons 2 Marshalls 1 Alco Stores 1 MasterBrand Cabinets 2 Applebee's 1 Maurices 1 Arby's 2 McDonald's 7 AutoZone 4 Nike 1 Baskin-Robbins 1 Office Depot 1 Blockbuster 2 On The Border 1 Burger King 4 Papa John's Pizza 1 CVS 4 Payless 3 Chevrolet 1 Penske 1 Chick-Fil-A 2 PetSmart 1 Chuck E. Cheese's 1 Pizza Hut 3 Church's Chicken 4 Popeyes 2 Cinnabon 2 Quality 1 Circle K 2 Quiznos 2 Comfort Suites 1 RadioShack 2 Curves 1 Rooms To Go 1 DHL 1 Ryder Rental & Truck Leasing 1 Dennys 2 SONIC Drive-In 6 Discount Tire 2 Safeway 1 Domino's Pizza 2 Sam's Club 1 Famous Footwear 2 Sprint Nextel 2 FedEx 17 Starbucks 6 Firestone Complete Auto Care 1 Studio 6 1 Ford 1 Super 8 2 GNC 1 T-Mobile 3 GameStop 2 Taco Bell 4 H&R Block 4 Target 2 Hilton 1 The Room Place 3 Holiday Inn 1 U-Haul 8 Home Depot 2 UPS 11 IHOP 2 Vons 1 Jamba Juice 1 Waffle House 3 Jones New York 1 Walgreens 4 Justice 1 Walmart 1 KFC 3 Wendy's 2 Kohl's 1 YMCA 1 Kroger 3
Strongest AM radio stations in Grand Prairie:
KZMP (1540 AM; 50 kW; UNIVERSITY PARK, TX; Owner: ENTRAVISION HOLDINGS, LLC)
WBAP (820 AM; 50 kW; FORT WORTH, TX; Owner: WBAP-KSCS OPERATING, LTD.)
KESS (1270 AM; 50 kW; FORT WORTH, TX; Owner: KESS-AM LICENSE CORP.)
KBIS (1150 AM; 25 kW; HIGHLAND PARK, TX; Owner: DALLAS AM RADIO PARTNERS, L.P.)
KSKY (660 AM; 20 kW; BALCH SPRINGS, TX; Owner: BISON MEDIA, INC.)
KNAX (1630 AM; 10 kW; FT. WORTH, TX; Owner: MORTENSON BROADCASTING COMPANY)
KRLD (1080 AM; 50 kW; DALLAS, TX; Owner: TEXAS INFINITY BROADCASTING L.P.)
KAHZ (1360 AM; 50 kW; HURST, TX)
KKDA (730 AM; 0 kW; GRAND PRAIRIE, TX; Owner: SERVICE BROADCASTING I, LTD.)
KHVN (970 AM; 10 kW; FORT WORTH, TX; Owner: MORTENSON BROADCASTING COMPANY)
KLIF (570 AM; 5 kW; DALLAS, TX; Owner: KLIF LICO, INC.)
KFXR (1190 AM; 50 kW; DALLAS, TX; Owner: CLEAR CHANNEL BROADCASTING LICENSES, INC.)
KTCK (1310 AM; 9 kW; DALLAS, TX; Owner: KRBE LICO, INC.)
Strongest FM radio stations in Grand Prairie:
KLLI (105.3 FM; DALLAS, TX; Owner: INFINITY BROADCASTING CORPORATION OF DALLAS)
KZPS (92.5 FM; DALLAS, TX; Owner: AMFM TEXAS LICENSES LIMITED PARTNERSHIP)
KKDA-FM (104.5 FM; DALLAS, TX; Owner: SERVICE BROADCASTING I, LTD.)
KHKS (106.1 FM; DENTON, TX; Owner: AMFM TEXAS LICENSES LIMITED PARTNERSHIP)
KVIL-FM (103.7 FM; HIGHLAND PARK-DALLAS, TX; Owner: INFINITY BROADCASTING CORPORATION OF TEXAS)
KLUV-FM (98.7 FM; DALLAS, TX; Owner: INFINITY BROADCASTING CORPORATION OF DALLAS)
KLNO (94.1 FM; FORT WORTH, TX; Owner: HBC LICENSE CORPORATION)
KOAI (107.5 FM; FORT WORTH, TX; Owner: INFINITY KOAI-FM, INC.)
KBFB (97.9 FM; DALLAS, TX; Owner: RADIO ONE LICENSES, LLC)
KSCS (96.3 FM; FORT WORTH, TX; Owner: WBAP-KSCS OPERATING, LTD.)
KCBI (90.9 FM; DALLAS, TX; Owner: CRISWELL CENTER FOR BIBLICAL STUDIES)
KEGL (97.1 FM; FORT WORTH, TX; Owner: CITICASTERS LICENSES, L.P.)
KDGE (102.1 FM; FORT WORTH-DALLAS, TX; Owner: CAPSTAR TX LIMITED PARTNERSHIP)
KDMX (102.9 FM; DALLAS, TX; Owner: CITICASTERS LICENSES, L.P.)
KRBV (100.3 FM; DALLAS, TX; Owner: INFINITY BROADCASTING CORP. OF FORT WORTH)
KVTT (91.7 FM; DALLAS, TX; Owner: RESEARCH EDUCATIONAL FOUNDATION, INC)
KERA (90.1 FM; DALLAS, TX; Owner: NORTH TEXAS PUBLIC BROADCASTING, INC.)
KNON (89.3 FM; DALLAS, TX; Owner: AGAPE BROADCASTING FOUNDATION, INC.)
WRR (101.1 FM; DALLAS, TX; Owner: CITY OF DALLAS, TEXAS)
KPLX (99.5 FM; FORT WORTH, TX; Owner: KPLX LICO, INC.)
TV broadcast stations around Grand Prairie:
KDTN (Channel 2; DENTON, TX; Owner: NORTH TEXAS PUBLIC BROADCASTING, INC.)
KXAS-TV (Channel 5; FORT WORTH, TX; Owner: STATION VENTURE OPERATIONS, LP)
KTVT (Channel 11; FORT WORTH, TX; Owner: CBS STATIONS GROUP OF TEXAS L.P.)
KSTR-TV (Channel 49; IRVING, TX; Owner: TELEFUTURA DALLAS LLC)
KPXD (Channel 68; ARLINGTON, TX; Owner: PAXSON DALLAS LICENSE, INC.)
KTXA (Channel 21; FORT WORTH, TX; Owner: VIACOM TELEVISION STATIONS GROUP OF DALLAS/FORT WORTH L.P.)
KUVN (Channel 23; GARLAND, TX; Owner: KUVN LICENSE PARTNERSHIP, L.P.)
KMPX (Channel 29; DECATUR, TX; Owner: WORD OF GOD FELLOWSHIP, INC.)
WFAA-TV (Channel 8; DALLAS, TX; Owner: WFAA-TV, L.P.)
KDTX-TV (Channel 58; DALLAS, TX; Owner: TRINITY BROADCASTING OF TEXAS, INC.)
KDFW (Channel 4; DALLAS, TX; Owner: KDFW LICENSE, INC.)
KXTX-TV (Channel 39; DALLAS, TX; Owner: TELEMUNDO OF TEXAS PARTNERSHIP, LP)
KERA-TV (Channel 13; DALLAS, TX; Owner: NORTH TEXAS PUBLIC BROADCASTING, INC.)
KDAF (Channel 33; DALLAS, TX; Owner: TRIBUNE TELEVISION COMPANY)
K26HF (Channel 26; BRITTON, TX; Owner: MAKO COMMUNICATIONS, LLC)
KHPK-LP (Channel 28; DE SOTO, TX; Owner: MAKO COMMUNICATIONS, LLC)
KDFI (Channel 27; DALLAS, TX; Owner: NEW DMIC, INC.)
KLDT (Channel 55; LAKE DALLAS, TX; Owner: JOHNSON BROADCASTING OF DALLAS, INC.)
K25FW (Channel 25; CORSICANA, TX; Owner: VENTANA TELEVISION, INC.)
KATA-LP (Channel 60; MESQUITE, TX; Owner: JANE McGINNIS)
KVFW-LP (Channel 65; FORT WORTH, TX; Owner: GERALD BENAVIDES)
KLEG-LP (Channel 44; DALLAS, TX; Owner: DILIP VISWANATH)
KFWD (Channel 52; FORT WORTH, TX; Owner: HIC BROADCAST, INC.)
KJJM-LP (Channel 46; DALLAS/MESQUITE, TX; Owner: JANE McGINNIS)
KUVN-CA (Channel 31; FORT WORTH, TX; Owner: KUVN LICENSE PARTNERSHIP, L.P.)
National Bridge Inventory (NBI) Statistics 346 Number of bridges11,932ft / 3,637m Total length $667,000 Total costs7,358,092 Total average daily traffic407,803 Total average daily truck traffic
New bridges - historical statistics
5 1930-1939 4 1940-1949 7 1950-1959 14 1960-1969 31 1970-1979 28 1980-1989 27 1990-1999 97 2000-2009 119 2010-2019 14 2020-2022
See full National Bridge Inventory statistics for Grand Prairie, TX
Home Mortgage Disclosure Act Aggregated Statistics For Year 2009(Based on 22 full and 14 partial tracts) A) FHA, FSA/RHS & VA B) Conventional C) Refinancings D) Home Improvement Loans E) Loans on Dwellings For 5+ Families F) Non-occupant Loans on G) Loans On Manufactured Number Average Value Number Average Value Number Average Value Number Average Value Number Average Value Number Average Value Number Average Value
LOANS ORIGINATED 938 $140,094 524 $130,575 1,362 $135,510 66 $33,756 4 $3,147,675 133 $94,600 27 $48,015 APPLICATIONS APPROVED, NOT ACCEPTED 45 $141,253 62 $109,371 184 $130,117 18 $18,923 0 $0 19 $79,418 12 $38,342 APPLICATIONS DENIED 207 $138,683 147 $118,464 851 $130,708 182 $30,106 0 $0 73 $94,723 16 $48,199 APPLICATIONS WITHDRAWN 157 $140,866 109 $140,435 474 $137,183 30 $58,762 1 $15,921,600 35 $83,475 6 $43,713 FILES CLOSED FOR INCOMPLETENESS 29 $133,697 26 $133,900 132 $122,976 12 $41,961 0 $0 17 $69,794 0 $0
Aggregated Statistics For Year 2008(Based on 22 full and 14 partial tracts) A) FHA, FSA/RHS & VA B) Conventional C) Refinancings D) Home Improvement Loans E) Loans on Dwellings For 5+ Families F) Non-occupant Loans on G) Loans On Manufactured Number Average Value Number Average Value Number Average Value Number Average Value Number Average Value Number Average Value Number Average Value
LOANS ORIGINATED 891 $147,386 1,115 $128,472 925 $122,507 192 $30,047 4 $5,003,750 260 $94,183 85 $40,983 APPLICATIONS APPROVED, NOT ACCEPTED 61 $137,533 181 $107,025 175 $124,349 62 $26,499 0 $0 29 $102,245 75 $42,070 APPLICATIONS DENIED 254 $141,159 377 $146,126 1,375 $119,736 454 $32,254 0 $0 170 $109,451 41 $44,164 APPLICATIONS WITHDRAWN 143 $149,024 217 $151,013 419 $133,942 29 $65,865 0 $0 62 $99,963 8 $39,171 FILES CLOSED FOR INCOMPLETENESS 46 $131,552 58 $141,637 113 $129,006 21 $42,270 0 $0 14 $106,009 1 $35,350
Aggregated Statistics For Year 2007(Based on 22 full and 14 partial tracts) A) FHA, FSA/RHS & VA B) Conventional C) Refinancings D) Home Improvement Loans E) Loans on Dwellings For 5+ Families F) Non-occupant Loans on G) Loans On Manufactured Number Average Value Number Average Value Number Average Value Number Average Value Number Average Value Number Average Value Number Average Value
LOANS ORIGINATED 620 $136,875 2,862 $123,743 1,083 $117,799 257 $37,455 12 $6,652,171 437 $98,169 53 $32,325 APPLICATIONS APPROVED, NOT ACCEPTED 55 $125,520 506 $118,704 305 $119,886 98 $34,247 0 $0 87 $92,155 48 $35,095 APPLICATIONS DENIED 159 $135,778 1,022 $152,286 1,807 $122,337 567 $33,177 0 $0 295 $101,516 55 $45,525 APPLICATIONS WITHDRAWN 124 $153,158 569 $149,673 638 $121,866 41 $47,616 2 $781,950 75 $121,618 7 $55,546 FILES CLOSED FOR INCOMPLETENESS 11 $155,962 172 $138,679 253 $136,124 16 $46,118 0 $0 38 $106,642 0 $0
Aggregated Statistics For Year 2006(Based on 22 full and 14 partial tracts) A) FHA, FSA/RHS & VA B) Conventional C) Refinancings D) Home Improvement Loans E) Loans on Dwellings For 5+ Families F) Non-occupant Loans on G) Loans On Manufactured Number Average Value Number Average Value Number Average Value Number Average Value Number Average Value Number Average Value Number Average Value
LOANS ORIGINATED 627 $138,380 4,880 $103,139 1,252 $105,321 281 $39,231 3 $11,956,743 833 $83,434 25 $49,365 APPLICATIONS APPROVED, NOT ACCEPTED 30 $130,779 806 $109,586 326 $104,631 97 $30,200 0 $0 155 $87,642 18 $44,306 APPLICATIONS DENIED 105 $134,602 1,510 $114,788 1,700 $112,023 519 $31,334 1 $1,428,200 346 $85,094 39 $43,336 APPLICATIONS WITHDRAWN 147 $143,096 998 $122,428 955 $114,919 70 $51,628 0 $0 161 $111,037 3 $59,400 FILES CLOSED FOR INCOMPLETENESS 6 $121,273 172 $140,517 402 $116,228 7 $85,121 2 $1,649,500 37 $92,607 0 $0
Aggregated Statistics For Year 2005(Based on 22 full and 14 partial tracts) A) FHA, FSA/RHS & VA B) Conventional C) Refinancings D) Home Improvement Loans E) Loans on Dwellings For 5+ Families F) Non-occupant Loans on G) Loans On Manufactured Number Average Value Number Average Value Number Average Value Number Average Value Number Average Value Number Average Value Number Average Value
LOANS ORIGINATED 695 $130,033 4,439 $95,763 1,771 $99,373 295 $61,016 6 $6,064,657 704 $79,602 49 $28,061 APPLICATIONS APPROVED, NOT ACCEPTED 15 $160,029 700 $99,199 347 $99,787 84 $39,623 0 $0 99 $87,729 18 $41,598 APPLICATIONS DENIED 164 $134,639 1,569 $96,028 2,269 $104,644 492 $33,374 1 $150,000 316 $91,918 112 $32,967 APPLICATIONS WITHDRAWN 159 $138,038 957 $109,764 1,016 $120,691 217 $161,828 0 $0 135 $100,069 3 $40,940 FILES CLOSED FOR INCOMPLETENESS 10 $135,718 177 $103,867 812 $111,413 10 $34,846 0 $0 49 $87,333 6 $36,260
Aggregated Statistics For Year 2004(Based on 22 full and 14 partial tracts) A) FHA, FSA/RHS & VA B) Conventional C) Refinancings D) Home Improvement Loans E) Loans on Dwellings For 5+ Families F) Non-occupant Loans on G) Loans On Manufactured Number Average Value Number Average Value Number Average Value Number Average Value Number Average Value Number Average Value Number Average Value
LOANS ORIGINATED 871 $124,521 3,159 $98,780 2,586 $97,403 270 $44,653 9 $3,038,041 495 $80,995 38 $33,699 APPLICATIONS APPROVED, NOT ACCEPTED 42 $123,343 551 $101,843 511 $98,778 75 $31,927 0 $0 94 $83,699 8 $32,580 APPLICATIONS DENIED 272 $127,633 981 $101,211 2,320 $97,998 412 $35,487 3 $5,092,417 202 $82,867 70 $37,573 APPLICATIONS WITHDRAWN 181 $131,154 569 $115,577 1,119 $103,464 56 $49,100 1 $15,310,200 79 $80,246 8 $37,751 FILES CLOSED FOR INCOMPLETENESS 29 $119,891 185 $100,992 901 $104,862 13 $40,181 0 $0 33 $81,738 12 $26,453
Aggregated Statistics For Year 2003(Based on 22 full and 14 partial tracts) A) FHA, FSA/RHS & VA B) Conventional C) Refinancings D) Home Improvement Loans E) Loans on Dwellings For 5+ Families F) Non-occupant Loans on Number Average Value Number Average Value Number Average Value Number Average Value Number Average Value Number Average Value
LOANS ORIGINATED 987 $120,141 2,242 $103,244 5,253 $97,893 222 $29,353 4 $4,557,405 437 $74,149 APPLICATIONS APPROVED, NOT ACCEPTED 32 $123,254 389 $95,292 742 $93,077 107 $45,682 0 $0 82 $80,016 APPLICATIONS DENIED 235 $129,826 621 $95,978 2,835 $86,927 325 $23,361 1 $2,342,440 194 $75,575 APPLICATIONS WITHDRAWN 231 $127,759 449 $121,194 1,298 $94,749 20 $50,780 0 $0 68 $76,542 FILES CLOSED FOR INCOMPLETENESS 21 $129,160 157 $111,443 285 $98,924 7 $33,961 0 $0 20 $79,964
Aggregated Statistics For Year 2002(Based on 7 full and 8 partial tracts) A) FHA, FSA/RHS & VA B) Conventional C) Refinancings D) Home Improvement Loans E) Loans on Dwellings For 5+ Families F) Non-occupant Loans on Number Average Value Number Average Value Number Average Value Number Average Value Number Average Value Number Average Value
LOANS ORIGINATED 626 $125,577 856 $108,461 1,169 $101,535 98 $28,383 4 $626,780 79 $89,103 APPLICATIONS APPROVED, NOT ACCEPTED 19 $117,888 100 $104,803 196 $97,117 40 $31,177 0 $0 16 $69,794 APPLICATIONS DENIED 105 $128,343 246 $95,870 407 $80,927 139 $18,984 0 $0 19 $54,116 APPLICATIONS WITHDRAWN 125 $137,329 158 $120,459 339 $97,234 13 $26,144 0 $0 16 $78,818 FILES CLOSED FOR INCOMPLETENESS 28 $125,453 82 $109,580 138 $103,671 3 $20,870 0 $0 3 $155,553
Aggregated Statistics For Year 2001(Based on 7 full and 8 partial tracts) A) FHA, FSA/RHS & VA B) Conventional C) Refinancings D) Home Improvement Loans E) Loans on Dwellings For 5+ Families F) Non-occupant Loans on Number Average Value Number Average Value Number Average Value Number Average Value Number Average Value Number Average Value
LOANS ORIGINATED 629 $117,594 729 $106,175 812 $100,954 129 $26,160 2 $3,137,190 63 $79,502 APPLICATIONS APPROVED, NOT ACCEPTED 25 $111,653 108 $91,242 138 $84,392 50 $20,886 0 $0 9 $75,541 APPLICATIONS DENIED 57 $117,899 181 $80,813 344 $85,636 142 $16,684 2 $604,055 23 $51,270 APPLICATIONS WITHDRAWN 130 $121,379 109 $130,158 235 $88,689 23 $24,034 0 $0 6 $78,630 FILES CLOSED FOR INCOMPLETENESS 13 $116,187 47 $83,332 70 $105,115 6 $14,320 0 $0 3 $70,843
Aggregated Statistics For Year 2000(Based on 7 full and 8 partial tracts) A) FHA, FSA/RHS & VA B) Conventional C) Refinancings D) Home Improvement Loans E) Loans on Dwellings For 5+ Families F) Non-occupant Loans on Number Average Value Number Average Value Number Average Value Number Average Value Number Average Value Number Average Value
LOANS ORIGINATED 475 $106,456 611 $97,676 166 $76,789 146 $26,447 2 $1,672,260 40 $63,612 APPLICATIONS APPROVED, NOT ACCEPTED 24 $79,807 83 $83,581 37 $65,987 61 $18,603 0 $0 5 $55,340 APPLICATIONS DENIED 39 $101,326 293 $62,345 147 $73,018 134 $16,088 0 $0 22 $45,958 APPLICATIONS WITHDRAWN 76 $109,287 92 $109,072 96 $76,426 5 $21,060 0 $0 12 $56,014 FILES CLOSED FOR INCOMPLETENESS 6 $102,058 47 $77,246 45 $90,135 0 $0 0 $0 3 $47,697
Aggregated Statistics For Year 1999(Based on 16 full and 9 partial tracts) A) FHA, FSA/RHS & VA B) Conventional C) Refinancings D) Home Improvement Loans E) Loans on Dwellings For 5+ Families F) Non-occupant Loans on Number Average Value Number Average Value Number Average Value Number Average Value Number Average Value Number Average Value
LOANS ORIGINATED 1,168 $92,894 1,352 $92,367 955 $71,880 336 $21,000 3 $5,409,317 119 $50,850 APPLICATIONS APPROVED, NOT ACCEPTED 25 $84,880 305 $71,149 249 $64,638 174 $68,495 0 $0 39 $50,678 APPLICATIONS DENIED 111 $97,774 759 $78,889 473 $67,018 463 $15,039 2 $2,040,000 70 $48,638 APPLICATIONS WITHDRAWN 128 $102,416 235 $107,240 528 $69,658 43 $19,504 0 $0 23 $63,389 FILES CLOSED FOR INCOMPLETENESS 17 $78,701 50 $106,710 167 $68,784 11 $19,087 0 $0 11 $44,294
Detailed mortgage data for all 36 tracts in Grand Prairie, TX
Private Mortgage Insurance Companies Aggregated Statistics For Year 2009(Based on 16 full and 13 partial tracts) A) Conventional B) Refinancings C) Non-occupant Loans on Number Average Value Number Average Value Number Average Value
LOANS ORIGINATED 127 $163,563 71 $164,911 1 $145,970 APPLICATIONS APPROVED, NOT ACCEPTED 50 $187,344 39 $176,045 6 $117,210 APPLICATIONS DENIED 16 $164,411 14 $154,915 0 $0 APPLICATIONS WITHDRAWN 9 $147,658 10 $158,680 1 $101,570 FILES CLOSED FOR INCOMPLETENESS 7 $64,841 3 $197,977 3 $50,127
Aggregated Statistics For Year 2008(Based on 22 full and 14 partial tracts) A) Conventional B) Refinancings C) Non-occupant Loans on Number Average Value Number Average Value Number Average Value
LOANS ORIGINATED 557 $156,305 128 $154,696 70 $112,423 APPLICATIONS APPROVED, NOT ACCEPTED 205 $175,285 81 $161,392 19 $168,781 APPLICATIONS DENIED 62 $141,886 10 $125,357 24 $126,451 APPLICATIONS WITHDRAWN 24 $184,942 7 $162,609 4 $86,848 FILES CLOSED FOR INCOMPLETENESS 24 $151,009 7 $113,883 6 $168,872
Aggregated Statistics For Year 2007(Based on 22 full and 14 partial tracts) A) Conventional B) Refinancings C) Non-occupant Loans on Number Average Value Number Average Value Number Average Value
LOANS ORIGINATED 918 $146,849 139 $158,600 83 $108,687 APPLICATIONS APPROVED, NOT ACCEPTED 153 $152,118 46 $153,520 14 $130,842 APPLICATIONS DENIED 40 $155,327 1 $471,620 14 $124,039 APPLICATIONS WITHDRAWN 54 $144,590 10 $136,814 9 $109,544 FILES CLOSED FOR INCOMPLETENESS 7 $127,923 1 $193,420 3 $71,907
Aggregated Statistics For Year 2006(Based on 22 full and 14 partial tracts) A) Conventional B) Refinancings C) Non-occupant Loans on Number Average Value Number Average Value Number Average Value
LOANS ORIGINATED 469 $128,965 70 $130,174 67 $98,599 APPLICATIONS APPROVED, NOT ACCEPTED 68 $153,830 26 $134,971 8 $101,149 APPLICATIONS DENIED 13 $175,216 0 $0 3 $76,623 APPLICATIONS WITHDRAWN 22 $151,008 7 $144,196 7 $87,277 FILES CLOSED FOR INCOMPLETENESS 2 $128,800 0 $0 0 $0
Aggregated Statistics For Year 2005(Based on 21 full and 14 partial tracts) A) Conventional B) Refinancings C) Non-occupant Loans on Number Average Value Number Average Value Number Average Value
LOANS ORIGINATED 372 $129,324 111 $138,770 54 $96,327 APPLICATIONS APPROVED, NOT ACCEPTED 72 $138,361 33 $176,049 10 $103,435 APPLICATIONS DENIED 6 $115,858 3 $109,607 2 $70,250 APPLICATIONS WITHDRAWN 20 $121,434 13 $144,460 6 $99,343 FILES CLOSED FOR INCOMPLETENESS 17 $161,488 2 $137,745 0 $0
Aggregated Statistics For Year 2004(Based on 22 full and 14 partial tracts) A) Conventional B) Refinancings C) Non-occupant Loans on Number Average Value Number Average Value Number Average Value
LOANS ORIGINATED 516 $123,949 175 $129,199 91 $90,232 APPLICATIONS APPROVED, NOT ACCEPTED 95 $135,252 88 $138,787 14 $90,771 APPLICATIONS DENIED 13 $110,153 5 $128,838 2 $96,960 APPLICATIONS WITHDRAWN 33 $128,879 12 $134,088 10 $97,525 FILES CLOSED FOR INCOMPLETENESS 16 $126,007 3 $148,617 4 $110,095
Aggregated Statistics For Year 2003(Based on 22 full and 14 partial tracts) A) Conventional B) Refinancings C) Non-occupant Loans on Number Average Value Number Average Value Number Average Value
LOANS ORIGINATED 586 $129,821 417 $134,650 68 $95,806 APPLICATIONS APPROVED, NOT ACCEPTED 83 $136,066 114 $138,860 13 $92,330 APPLICATIONS DENIED 17 $128,015 4 $143,755 7 $95,626 APPLICATIONS WITHDRAWN 35 $133,167 31 $135,653 3 $94,987 FILES CLOSED FOR INCOMPLETENESS 6 $76,780 4 $111,482 0 $0
Aggregated Statistics For Year 2002(Based on 7 full and 8 partial tracts) A) Conventional B) Refinancings C) Non-occupant Loans on Number Average Value Number Average Value Number Average Value
LOANS ORIGINATED 208 $130,558 92 $134,360 24 $93,341 APPLICATIONS APPROVED, NOT ACCEPTED 37 $133,011 25 $138,512 3 $91,970 APPLICATIONS DENIED 7 $125,656 2 $150,915 2 $123,950 APPLICATIONS WITHDRAWN 12 $133,352 7 $134,720 1 $211,260 FILES CLOSED FOR INCOMPLETENESS 1 $80,680 0 $0 0 $0
Aggregated Statistics For Year 2001(Based on 7 full and 8 partial tracts) A) Conventional B) Refinancings C) Non-occupant Loans on Number Average Value Number Average Value Number Average Value
LOANS ORIGINATED 219 $131,744 62 $133,020 13 $102,206 APPLICATIONS APPROVED, NOT ACCEPTED 39 $124,888 8 $156,494 6 $71,553 APPLICATIONS DENIED 9 $147,979 3 $140,003 1 $125,930 APPLICATIONS WITHDRAWN 7 $97,011 2 $86,915 1 $149,260 FILES CLOSED FOR INCOMPLETENESS 4 $108,810 1 $106,760 0 $0
Aggregated Statistics For Year 2000(Based on 7 full and 8 partial tracts) A) Conventional B) Refinancings C) Non-occupant Loans on Number Average Value Number Average Value Number Average Value
LOANS ORIGINATED 183 $122,008 16 $116,226 11 $94,134 APPLICATIONS APPROVED, NOT ACCEPTED 26 $124,857 4 $123,122 0 $0 APPLICATIONS DENIED 9 $90,806 2 $104,000 2 $78,795 APPLICATIONS WITHDRAWN 12 $104,389 3 $135,130 1 $106,040 FILES CLOSED FOR INCOMPLETENESS 2 $160,105 0 $0 0 $0
Aggregated Statistics For Year 1999(Based on 16 full and 9 partial tracts) A) Conventional B) Refinancings C) Non-occupant Loans on Number Average Value Number Average Value Number Average Value
LOANS ORIGINATED 444 $114,908 121 $104,069 16 $59,788 APPLICATIONS APPROVED, NOT ACCEPTED 36 $125,154 23 $98,070 3 $77,583 APPLICATIONS DENIED 32 $114,180 5 $87,090 2 $86,525 APPLICATIONS WITHDRAWN 14 $118,766 3 $99,277 0 $0 FILES CLOSED FOR INCOMPLETENESS 15 $102,754 2 $144,920 1 $89,460
Fire-safe hotels and motels in Grand Prairie, Texas:
La Quinta Inn, 1410 NW 19TH St, Grand Prairie, Texas 75050 Phone: (972) 641-3021, Fax: (972) 660-3041
Country Inn & Suites Grand Prairie, 2050 N State Hwy 360, Grand Prairie, Texas 75050 Phone: (972) 988-8989, Fax: (972) 623-0003
Americas Best Value Inn, 1108 N Hwy 360, Grand Prairie, Texas 75050 Phone: (972) 975-0000, Fax: (972) 975-3033
Best Western Plus - Arlington North, 2075 N Hwy 360, Grand Prairie, Texas 75050 Phone: (817) 633-6311, Fax: (817) 633-1082
Hyatt Place Dallas/North Arlington/Grand Prairie, 1542 N Hwy 360, Grand Prairie, Texas 75050 Phone: (972) 988-6800, Fax: (972) 988-6822
Ramada LTD, 402 E Palace Pkwy, Grand Prairie, Texas 75050 Phone: (972) 263-4421, Fax: (972) 264-4763
Holiday Inn Express Hotel & Suites, 4112 S Carrier Pkwy, Grand Prairie, Texas 75052 Phone: (972) 264-4002, Fax: (972) 264-4002
Candlewood Suites, 2504 W I-20, Grand Prairie, Texas 75052 Phone: (214) 412-1022, Fax: (214) 412-1029
8 other hotels and motels
All 16 fire-safe hotels and motels in Grand Prairie, Texas
Most common first names in Grand Prairie, TX among deceased individuals Name Count Lived (average)
Mary 365 76.2 years James 327 69.1 years John 279 71.2 years William 259 71.9 years Robert 236 69.4 years Charles 162 70.0 years George 127 74.0 years Thomas 105 68.3 years Dorothy 102 76.2 years Willie 98 75.1 years
Most common last names in Grand Prairie, TX among deceased individuals Last name Count Lived (average)
Smith 175 73.9 years Williams 155 71.2 years Johnson 135 72.7 years Jones 113 71.7 years Brown 111 74.1 years Moore 82 74.8 years White 71 75.1 years Davis 68 72.3 years Miller 68 74.5 years Wilson 65 68.2 years
Grand Prairie compared to Texas state average:
Unemployed percentage below state average. Black race population percentage significantly above state average. Hispanic race population percentage above state average. Foreign-born population percentage significantly above state average. Grand Prairie, TX compared to other similar cities: Grand Prairie on our top lists :
#2 on the list of "Top 101 cities with the largest city-data.com crime index decrease from 2011 to 2012 (population 50,000+)"
#25 on the list of "Top 101 cities with largest percentage of females in occupations: law enforcement workers including supervisors (population 50,000+)"
#32 on the list of "Top 101 cities with the smallest percentages of current college students (population 100,000+)"
#39 on the list of "Top 101 cities with the largest city-data.com crime index decrease from 2002 to 2012 (population 50,000+)"
#41 on the list of "Top 101 cities with the hottest summers (population 50,000+)"
#46 on the list of "Top 101 cities with largest percentage of males in industries: wholesale trade (population 50,000+)"
#50 on the list of "Top 101 cities with largest percentage of males in industries: transportation and warehousing (population 50,000+)"
#53 on the list of "Top 101 cities with largest percentage of females in occupations: office and administrative support occupations (population 50,000+)"
#59 on the list of "Top 100 cities with lowest ratio of median house value to median household income (pop. 50,000+)"
#69 on the list of "Top 101 cities with largest percentage of males in occupations: construction and extraction occupations (population 50,000+)"
#74 on the list of "Top 101 cities with the highest percentage of family households, population 100,000+"
#74 on the list of "Top 100 high-educated but low-earning cities (pop. 50,000+)"
#80 on the list of "Top 101 cities with the highest daily high temperatures (population 50,000+)"
#80 on the list of "Top 101 cities with largest percentage of males in industries: construction (population 50,000+)"
#80 on the list of "Top 101 cities with largest percentage of females in industries: information (population 50,000+)"
#90 on the list of "Top 101 cities with the largest percentage population increase from 2000 (population 50,000+)"
#92 on the list of "Top 101 cities with largest percentage of males in occupations: transportation occupations (population 50,000+)"
#97 on the list of "Top 100 most racially diverse cities (pop. 50,000+)"
#101 on the list of "Top 101 cities with largest percentage of females in occupations: installation, maintenance, and repair occupations (population 50,000+)"
#3 on the list of "Top 101 counties with the most Evangelical Protestant adherents"
#3 on the list of "Top 101 counties with the most Evangelical Protestant congregations"
#5 on the list of "Top 101 counties with the highest average weight of females"
#6 on the list of "Top 101 counties with the most Mainline Protestant adherents"
#7 on the list of "Top 101 counties with the most Black Protestant congregations"
Top Patent Applicants
Iok-Hou Pang (20)
Duc Quang Bui (19)
Tsz S. Cheng (16)
Thanh Le (11)
James Brandon Roach (9)
Christopher B. Barley (9)
Ivan E. Danhof (9)
Richard A. Bergs (9)
Andy Quang Tran (9)
Dale E. Redford (8)
Total of 380 patent applications in 2008-2024.


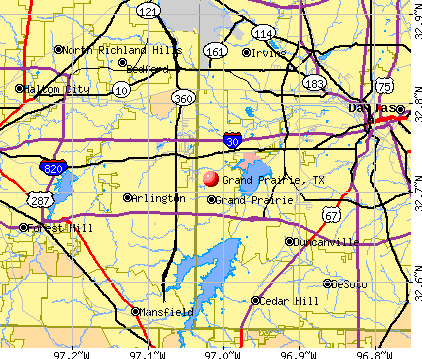


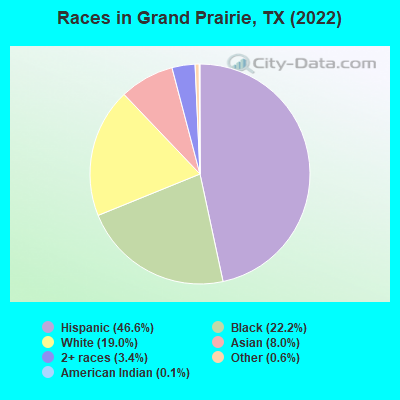
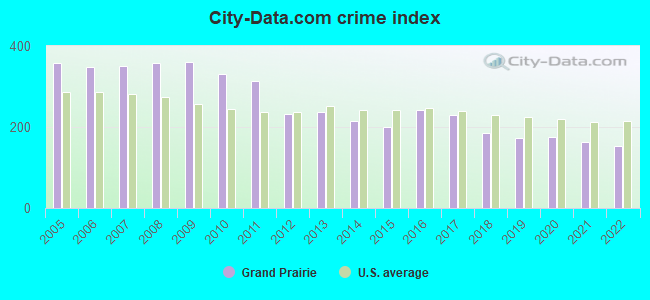
 Recent articles from our blog. Our writers, many of them Ph.D. graduates or candidates, create easy-to-read articles on a wide variety of topics.

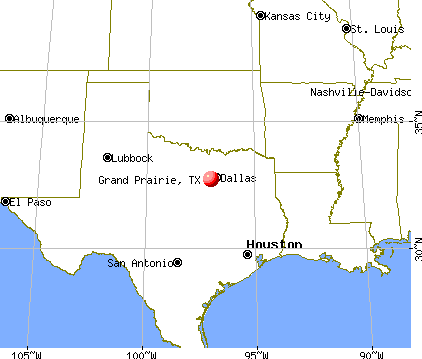
 (6.2 miles
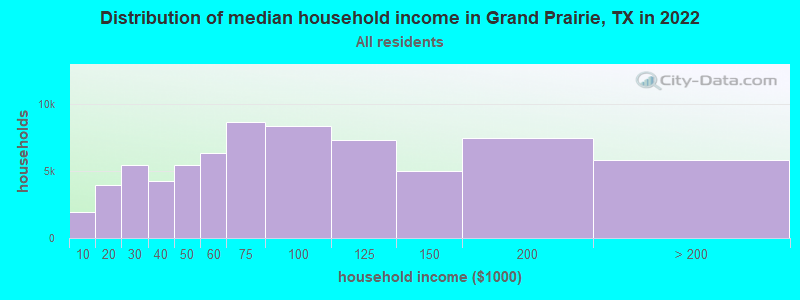
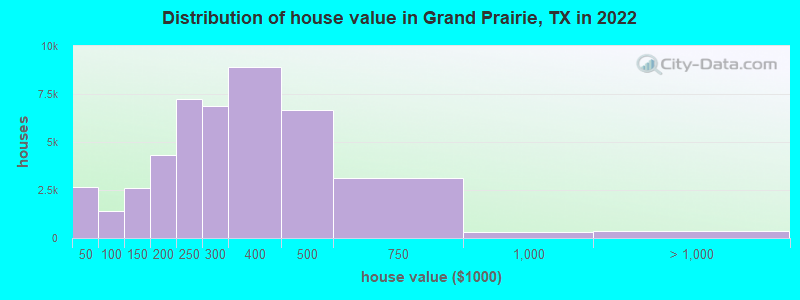
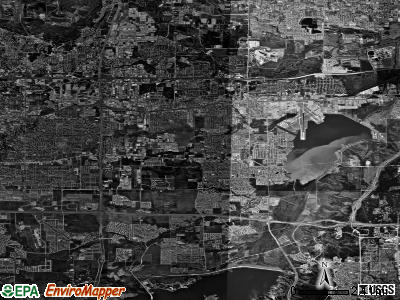
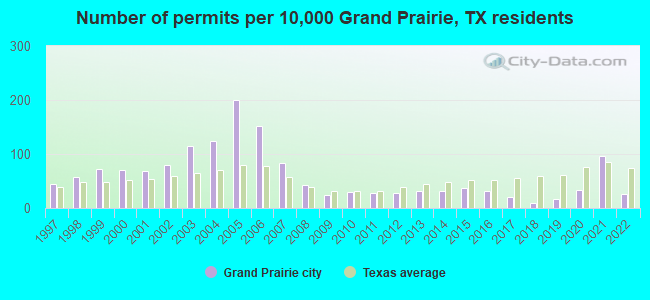
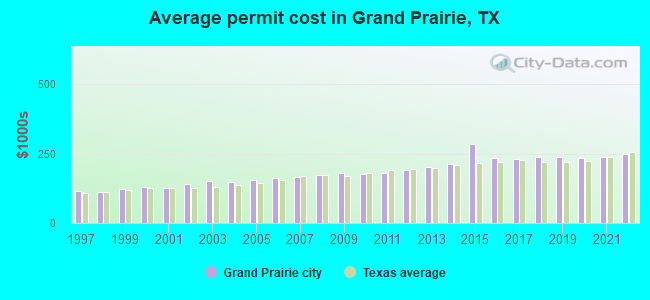
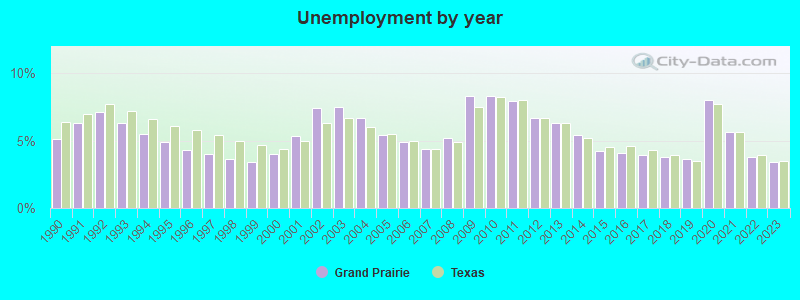
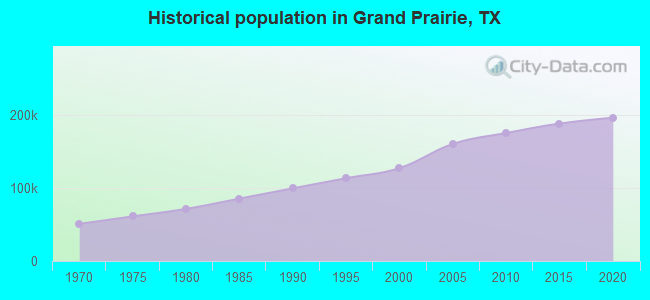
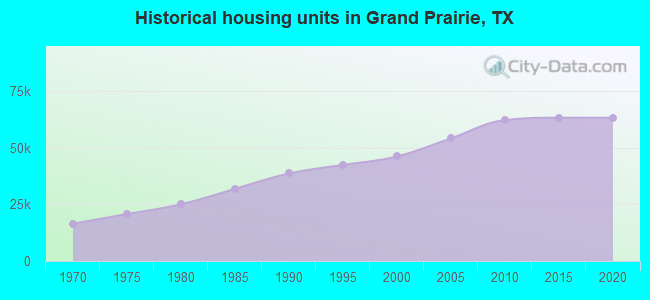
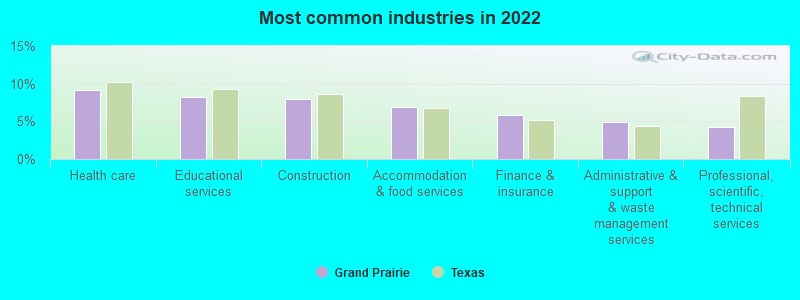
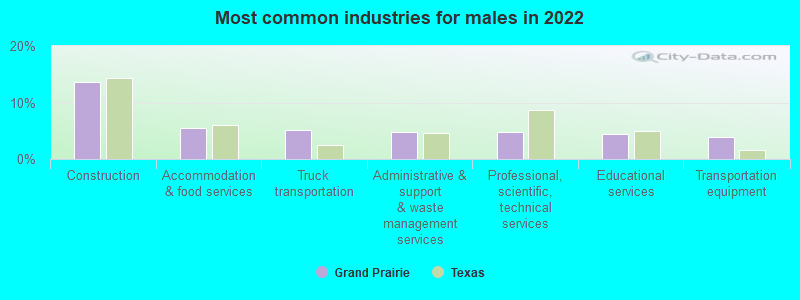
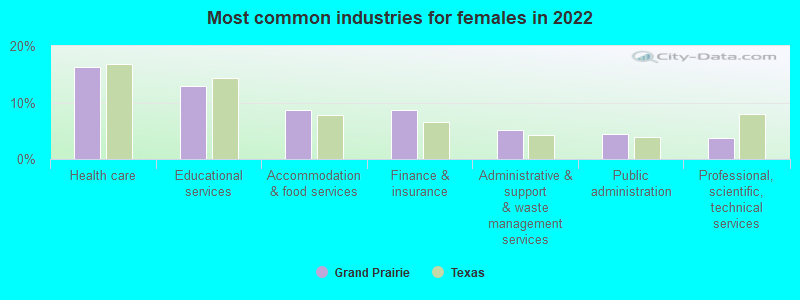
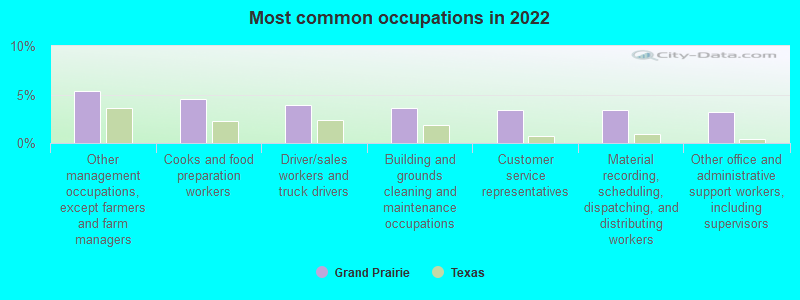
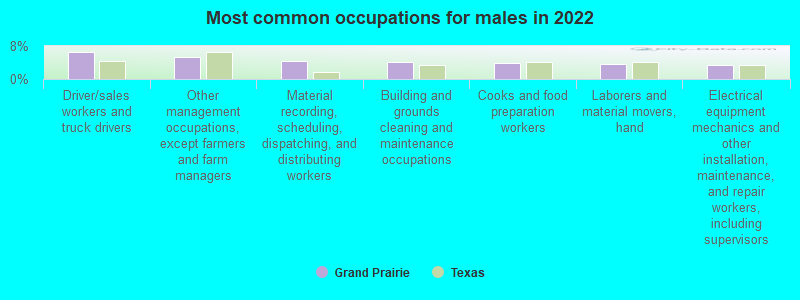
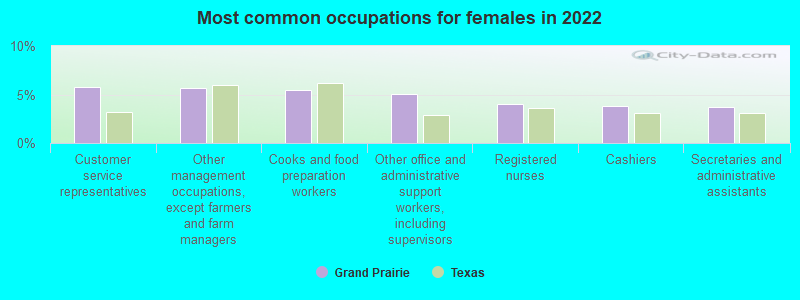
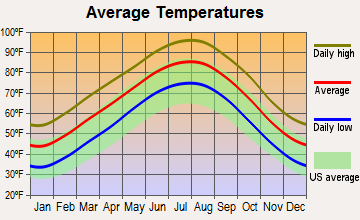

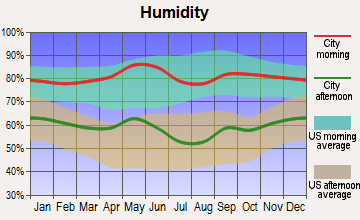
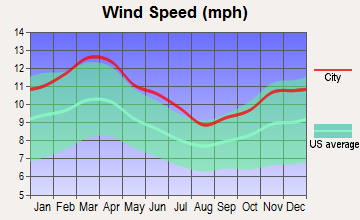
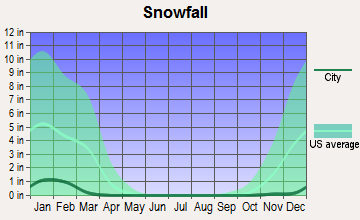
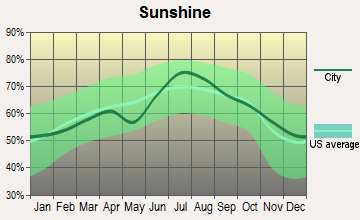
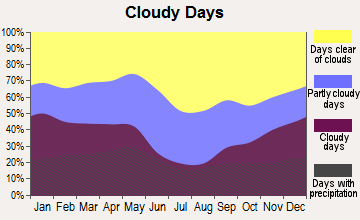
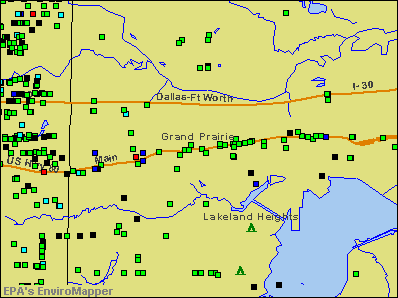

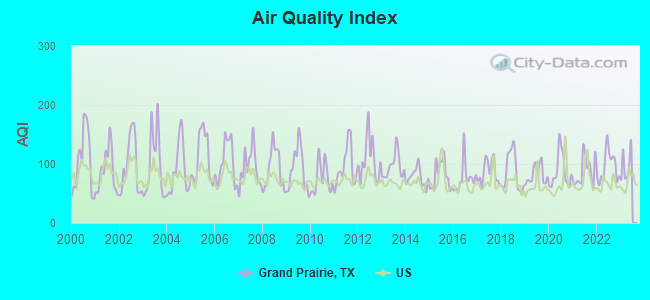
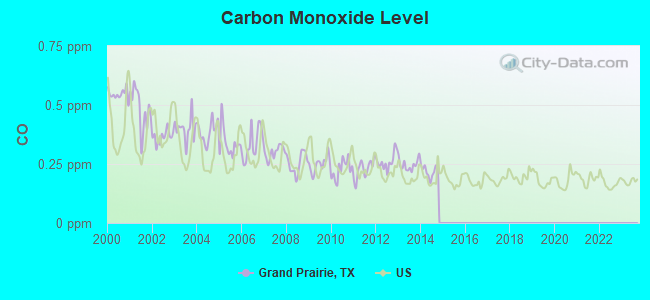
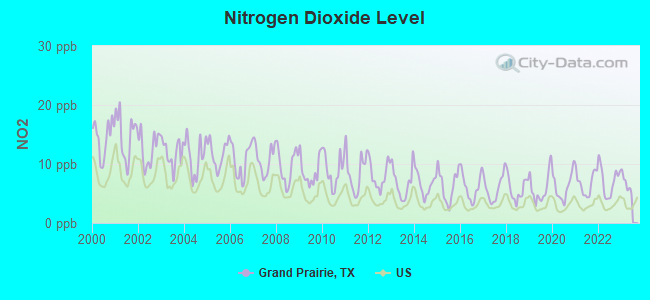
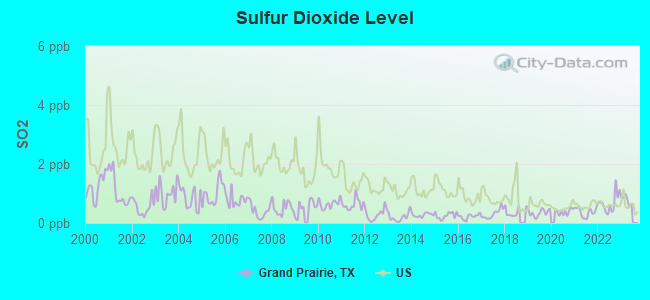
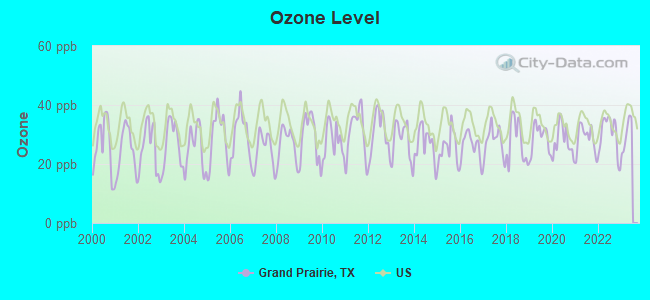
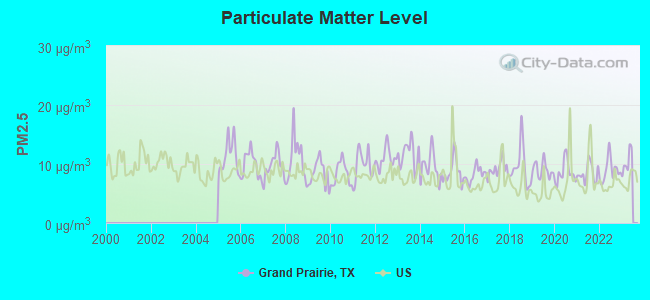

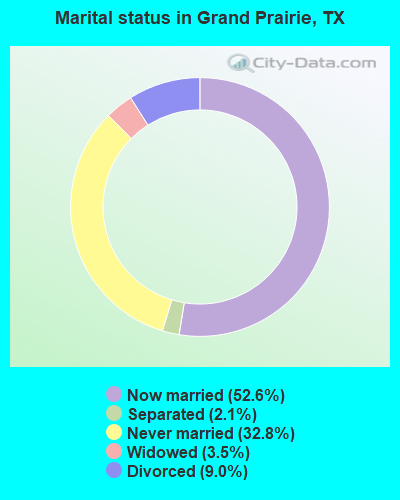
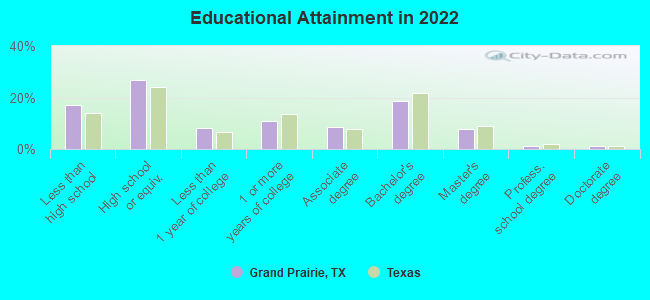
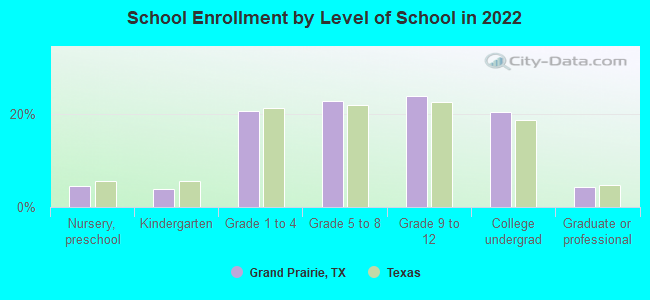
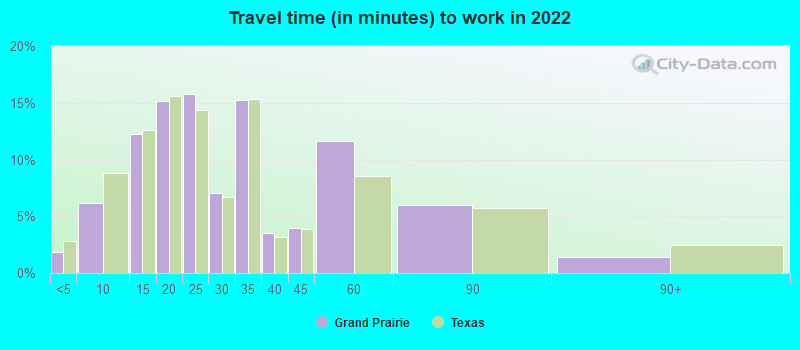
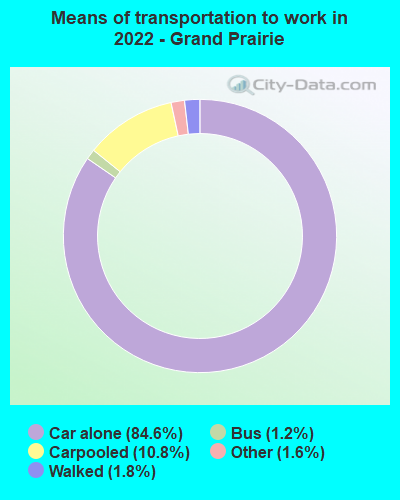
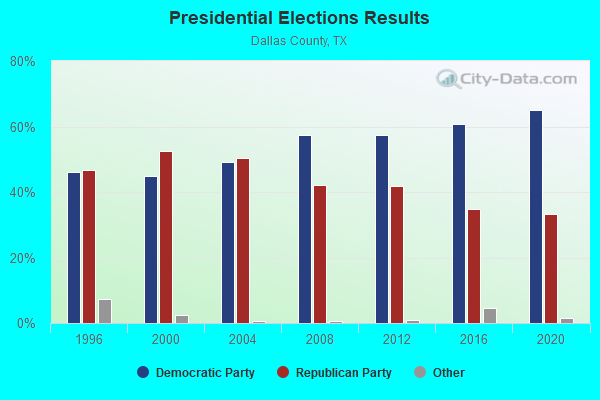
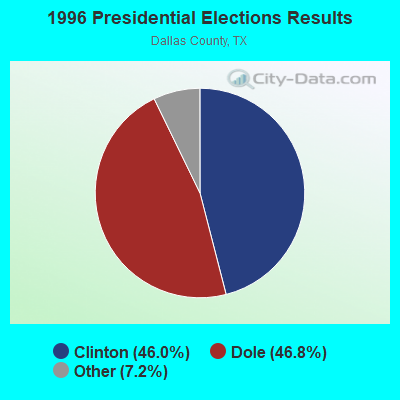
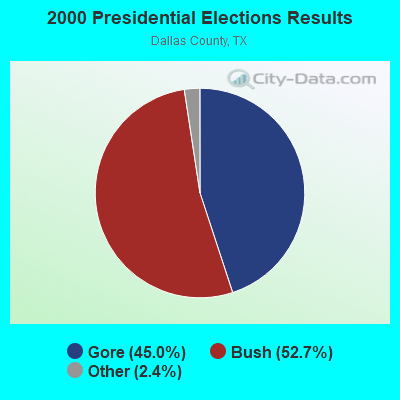
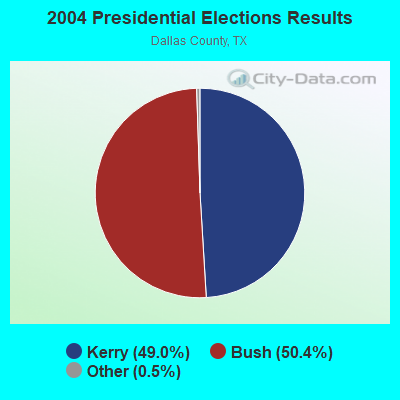
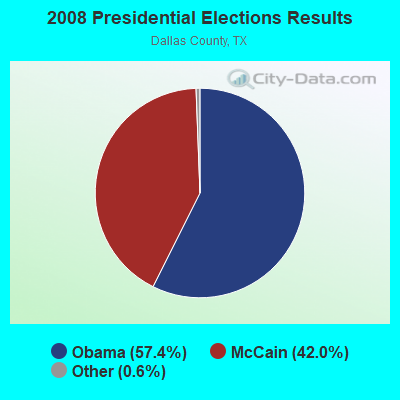

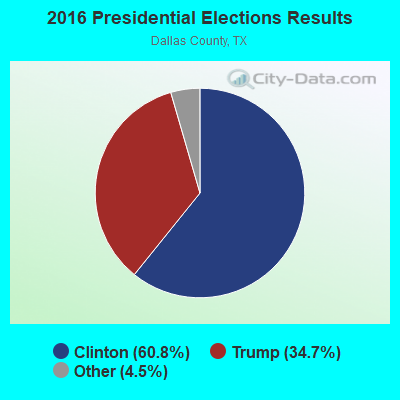
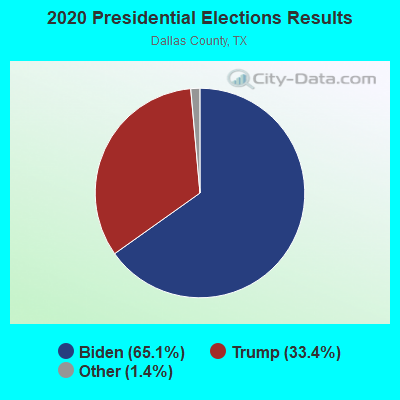
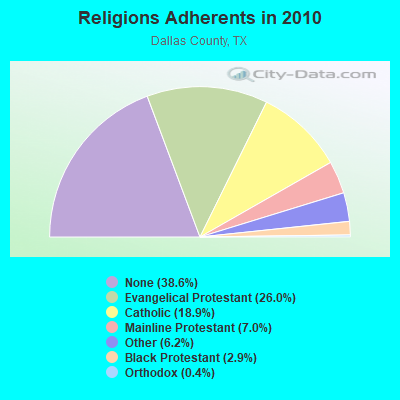
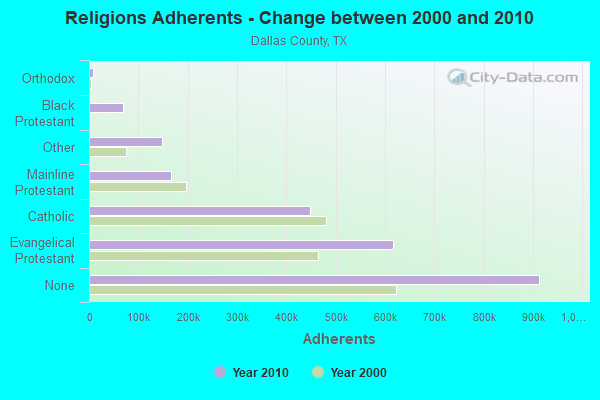
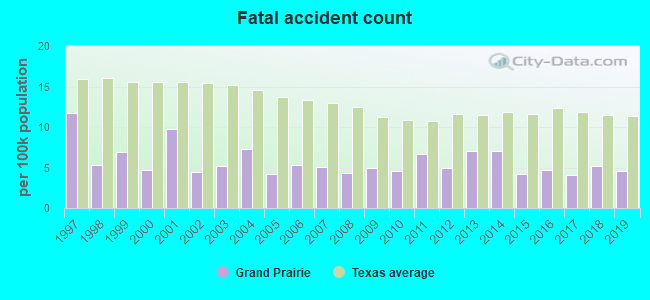
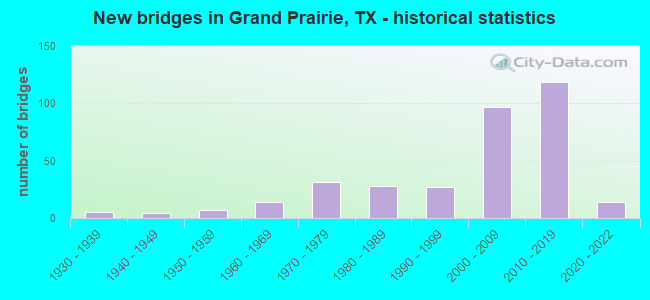
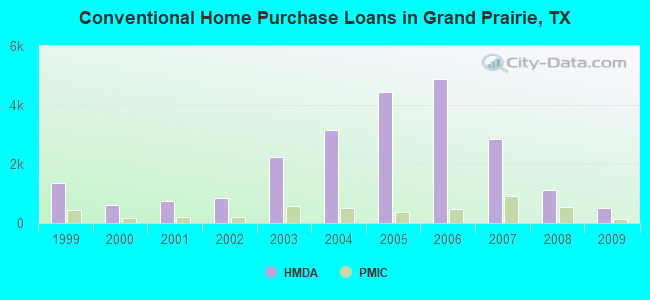
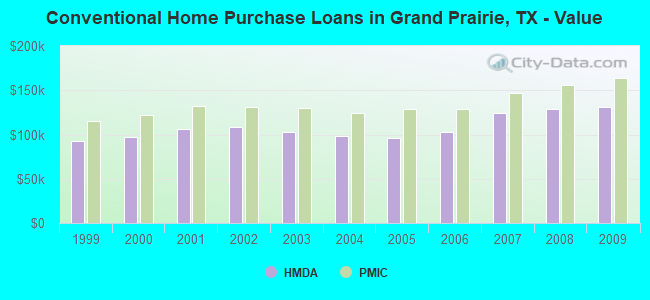
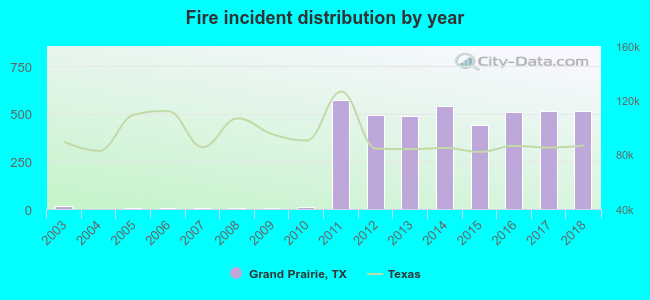 Based on the data from the years 2003 - 2018 the average number of fires per year is 258. The highest number of reported fires - 570 took place in 2011, and the least - 0 in 2004. The data has an increasing trend.
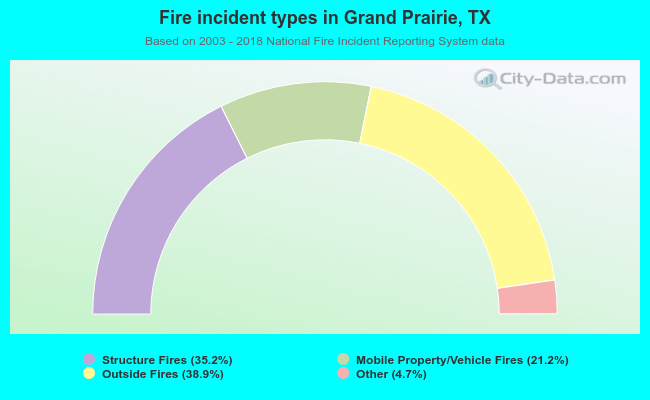 When looking into fire subcategories, the most incidents belonged to: Outside Fires (38.9%), and Structure Fires (35.2%).