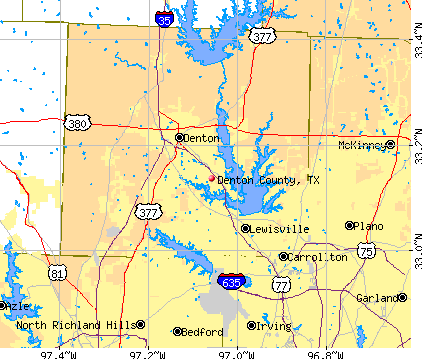
Denton County, Texas (TX)
County owner-occupied free and clear houses and condos in 2010: 25,169
County owner-occupied houses and condos in 2000: 102,469
Renter-occupied apartments: 83,415 (it was 56,434 in 2000)
| % of renters here: | 36% |
| State: | 36% |
Land area: 889 sq. mi.
Water area: 69.3 sq. mi.
Population density: 1100 people per square mile (very high).
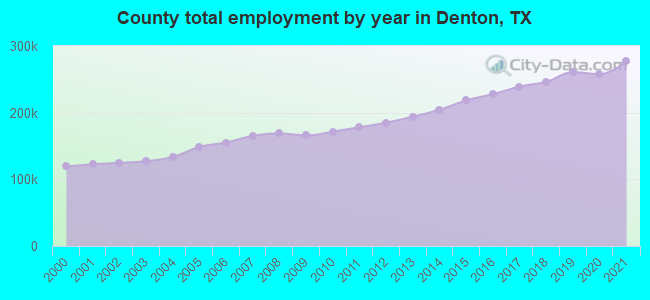
Industries providing employment: Educational, health and social services (20.1%), Professional, scientific, management, administrative, and waste management services (16.2%), Retail trade (11.4%), Finance, insurance, real estate, and rental and leasing (10.6%).
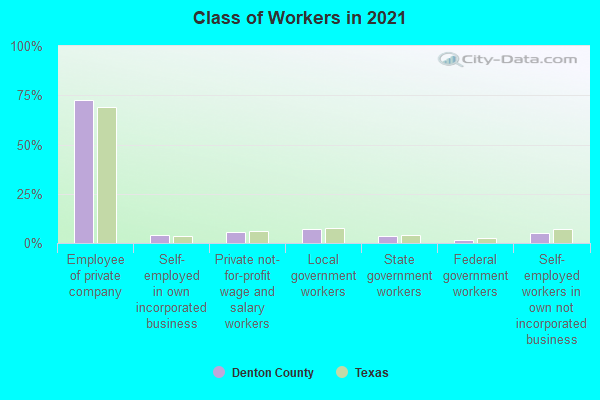
Type of workers:
- Private wage or salary: 82%
- Government: 12%
- Self-employed, not incorporated: 5%
- Unpaid family work: 0%
- OSM Map
- General Map
- Google Map
- MSN Map

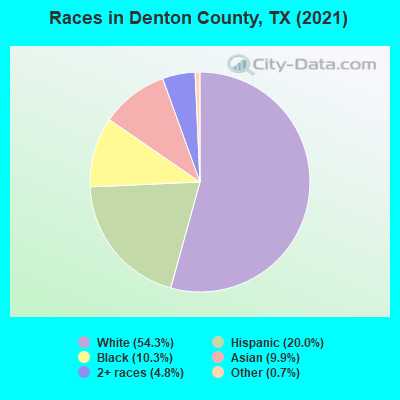
- 513,95652.6%White Non-Hispanic Alone
- 196,08820.1%Hispanic or Latino
- 104,94110.7%Black Non-Hispanic Alone
- 102,44810.5%Asian alone
- 51,3655.3%Two or more races
- 6,6780.7%Some other race alone
- 1,2460.1%American Indian and Alaska Native alone
- 5590.06%Native Hawaiian and Other
Pacific Islander alone
| Median resident age: | 37.0 years |
| Texas median age: | 35.6 years |
| Males: 484,286 | |
| Females: 492,995 |

 | Is it me or is finding a job here really hard? (202 replies) |
| When will Sherman/Denison Be In DFW Metro? (66 replies) |
| Not a great sign for the Texas is turning Blue crowd. (306 replies) |
| Crystal Ball...Collin County (47 replies) |
| How much bigger will DFW population be? (57 replies) |
| Coronavirus in Texas (main thread) (428 replies) |
| Denton County: | 2.0 people |
| Texas: | 3 people |
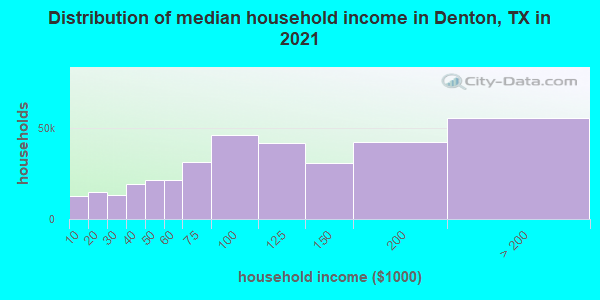
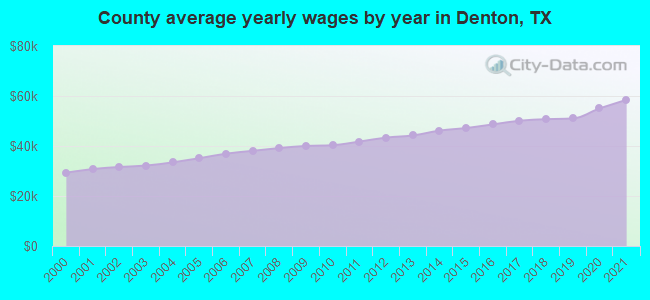
Estimated median household income in 2022: $102,428 ($58,216 in 1999)
| This county: | $102,428 |
| Texas: | $72,284 |
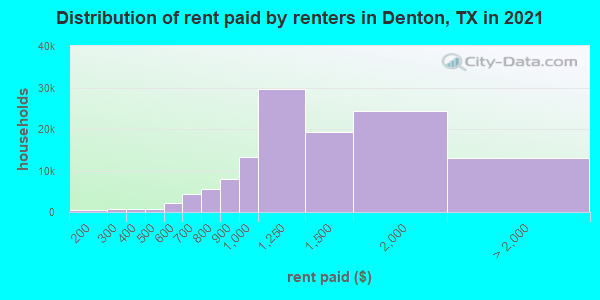
Median contract rent in 2022 for apartments: $1,412 (lower quartile is $1,108, upper quartile is $1,847)
| This county: | $1412 |
| State: | $1117 |
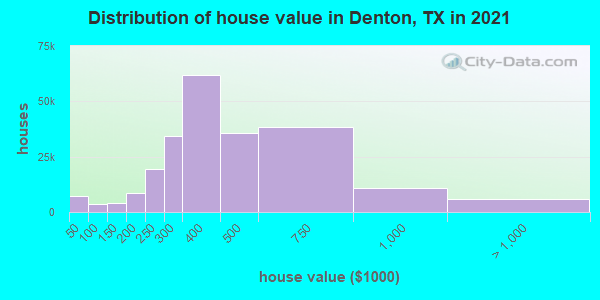
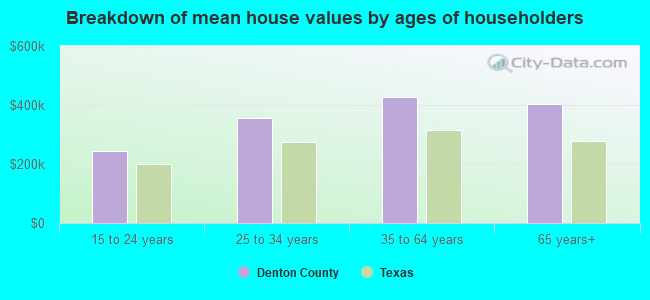
Estimated median house or condo value in 2022: $428,400 (it was $127,000 in 2000)
| Denton: | $428,400 |
| Texas: | $275,400 |
Mean price in 2022:
Median monthly housing costs for homes and condos with a mortgage: $2,422Detached houses: $505,331
Here: $505,331 State: $369,058 Townhouses or other attached units: $373,634
Here: $373,634 State: $327,631 In 2-unit structures: $286,734
Here: $286,734 State: $374,947 In 3-to-4-unit structures: $285,131
Here: $285,131 State: $209,652 In 5-or-more-unit structures: $357,993
Here: $357,993 State: $413,944 Mobile homes: $99,413
Here: $99,413 State: $124,413 Occupied boats, RVs, vans, etc.: $214,933
Here: $214,933 State: $73,921
Median monthly housing costs for units without a mortgage: $960
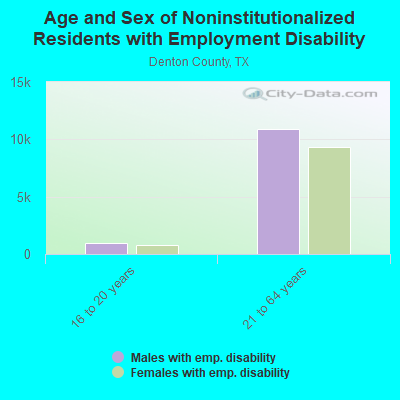
Institutionalized population: 2,765
Crime in 2021 (reported by the sheriff's office or county police, not the county total):
- Murders: 0
- Rapes: 17
- Robberies: 2
- Assaults: 54
- Burglaries: 62
- Thefts: 276
- Auto thefts: 41
Crime in 2020 (reported by the sheriff's office or county police, not the county total):
- Murders: 0
- Rapes: 32
- Robberies: 3
- Assaults: 47
- Burglaries: 60
- Thefts: 326
- Auto thefts: 64

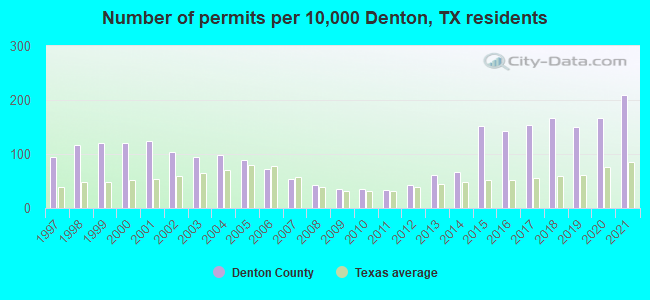
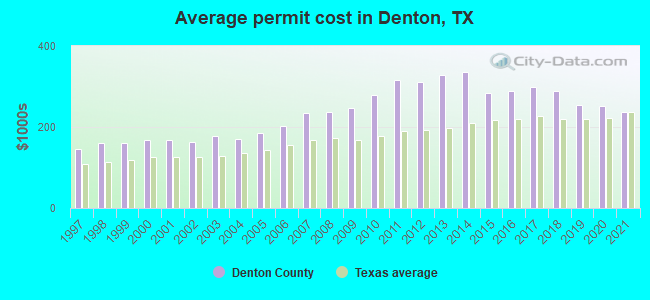
Single-family new house construction building permits:
- 2022: 8093 buildings, average cost: $265,400
- 2021: 9076 buildings, average cost: $236,600
- 2020: 7222 buildings, average cost: $252,400
- 2019: 6477 buildings, average cost: $254,000
- 2018: 7173 buildings, average cost: $290,300
- 2017: 6665 buildings, average cost: $299,400
- 2016: 6212 buildings, average cost: $288,600
- 2015: 6594 buildings, average cost: $285,400
- 2014: 2896 buildings, average cost: $336,200
- 2013: 2692 buildings, average cost: $328,600
- 2012: 1839 buildings, average cost: $311,200
- 2011: 1414 buildings, average cost: $315,200
- 2010: 1495 buildings, average cost: $277,900
- 2009: 1495 buildings, average cost: $245,900
- 2008: 1797 buildings, average cost: $237,400
- 2007: 2301 buildings, average cost: $233,700
- 2006: 3157 buildings, average cost: $202,700
- 2005: 3816 buildings, average cost: $185,100
- 2004: 4254 buildings, average cost: $170,600
- 2003: 4109 buildings, average cost: $177,100
- 2002: 4492 buildings, average cost: $162,600
- 2001: 5430 buildings, average cost: $167,200
- 2000: 5245 buildings, average cost: $167,600
- 1999: 5222 buildings, average cost: $159,700
- 1998: 5005 buildings, average cost: $159,900
- 1997: 4085 buildings, average cost: $145,400
Median real estate property taxes paid for housing units with mortgages in 2022: $6,994 (1.6%)
Median real estate property taxes paid for housing units with no mortgage in 2022: $5,818 (1.5%)
| Denton County: | 8.2% |
| Texas: | 14.0% |
Median age of residents in 2022: 37.0 years old
(Males: 36.6 years old, Females: 37.5 years old)
(Median age for: White residents: 42.1 years old, Black residents: 33.3 years old, American Indian residents: 32.7 years old, Asian residents: 38.0 years old, Hispanic or Latino residents: 30.1 years old, Other race residents: 33.3 years old)
Area name: Dallas, TX HUD Metro FMR Area
Fair market rent in 2006 for a 1-bedroom apartment in Denton County is $607 a month.
Fair market rent for a 2-bedroom apartment is $733 a month.
Fair market rent for a 3-bedroom apartment is $954 a month.
Cities in this county include: Denton, Lewisville, Flower Mound, Colony, The Colony, Highland Village, Corinth, Trophy Club, Lake Dallas, Sanger.
2023 air pollution in Denton County:
Ozone (1-hour): 0.033 ppm (standard limit: 0.12 ppm). Near U.S. average.
Particulate Matter (PM2.5) Annual: 8.5 µg/m3(standard limit: 15.0 µg/m3). Near U.S. average.
Neighboring counties: San Diego County, California  , Jasper County, Georgia
  , Meriwether County, Georgia , Morgan County, Georgia .
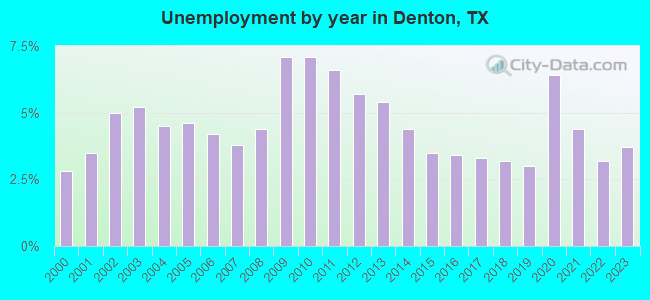
| Here: | 3.1% |
| Texas: | 3.5% |
Current college students: 37,656
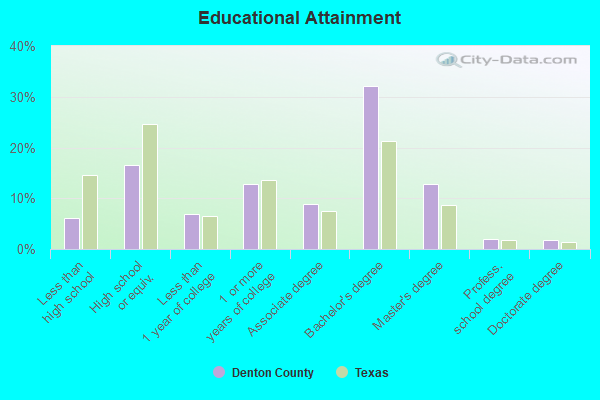
People 25 years of age or older with a high school degree or higher: 93.4%
People 25 years of age or older with a bachelor's degree or higher: 49.7%
Number of foreign born residents: 163,393 (53.6% naturalized citizens)
| Denton County: | 16.7% |
| Whole state: | 17.2% |
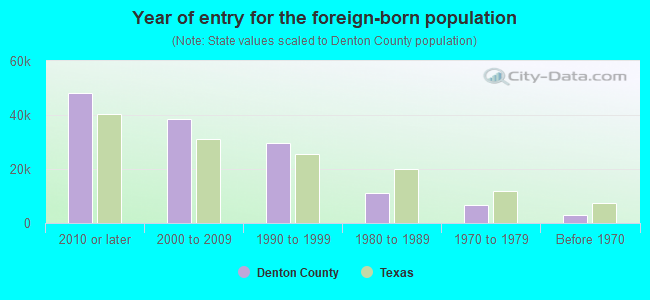
- Year of entry for the foreign-born population
- 59,2212010 or later
- 41,9732000 to 2009
- 31,6761990 to 1999
- 10,9481980 to 1989
- 6,4901970 to 1979
- 2,913Before 1970
Mean travel time to work (commute): minutes
Percentage of county residents living and working in this county: 99.1%
Housing units in structures:
- One, detached: 259,956
- One, attached: 10,938
- Two: 3,471
- 3 or 4: 12,392
- 5 to 9: 16,136
- 10 to 19: 22,639
- 20 to 49: 16,762
- 50 or more: 25,100
- Mobile homes: 9,113
- Boats, RVs, vans, etc.: 133
Housing units in Denton County with a mortgage: 163,847 (8,622 second mortgage, 424 home equity loan, 5,666 both second mortgage and home equity loan)
Houses without a mortgage: 1,936
| Here: | 99.4% with mortgage |
| State: | 98.4% with mortgage |
Religion statistics for Denton County
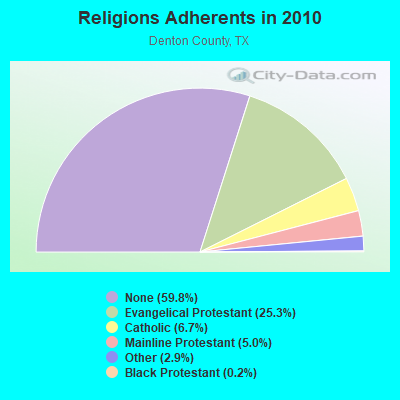
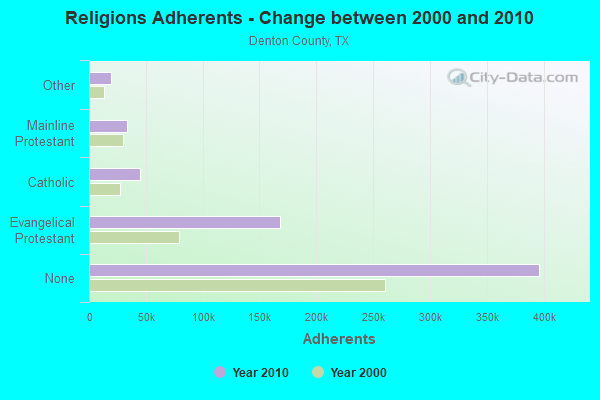
| Religion | Adherents | Congregations |
|---|---|---|
| Evangelical Protestant | 167,945 | 321 |
| Catholic | 44,615 | 8 |
| Mainline Protestant | 33,340 | 56 |
| Other | 18,928 | 42 |
| Black Protestant | 1,354 | 8 |
| Orthodox | 120 | 1 |
| None | 396,312 | - |
Source: Clifford Grammich, Kirk Hadaway, Richard Houseal, Dale E.Jones, Alexei Krindatch, Richie Stanley and Richard H.Taylor. 2012. 2010 U.S.Religion Census: Religious Congregations & Membership Study. Association of Statisticians of American Religious Bodies. Jones, Dale E., et al. 2002. Congregations and Membership in the United States 2000. Nashville, TN: Glenmary Research Center.
Food Environment Statistics:
| Denton County: | 0.85 / 10,000 pop. |
| State: | 1.47 / 10,000 pop. |
| Here: | 0.16 / 10,000 pop. |
| Texas: | 0.14 / 10,000 pop. |
| This county: | 0.57 / 10,000 pop. |
| Texas: | 1.11 / 10,000 pop. |
| Denton County: | 2.67 / 10,000 pop. |
| Texas: | 3.95 / 10,000 pop. |
| This county: | 4.90 / 10,000 pop. |
| State: | 6.13 / 10,000 pop. |
| Denton County: | 8.5% |
| Texas: | 8.9% |
| Denton County: | 28.4% |
| State: | 26.6% |
| Here: | 13.8% |
| State: | 15.7% |
Agriculture in Denton County:
Average size of farms: 148 acresAverage value of agricultural products sold per farm: $20,824
Average value of crops sold per acre for harvested cropland: $127.48
The value of livestock, poultry, and their products as a percentage of the total market value of agricultural products sold: 76.04%
Average total farm production expenses per farm: $26,640
Harvested cropland as a percentage of land in farms: 26.44%
Irrigated harvested cropland as a percentage of land in farms: 0.90%
Average market value of all machinery and equipment per farm: $31,612
The percentage of farms operated by a family or individual: 91.60%
Average age of principal farm operators: 54 years
Average number of cattle and calves per 100 acres of all land in farms: 15.30
Corn for grain: 1553 harvested acres
All wheat for grain: 29616 harvested acres
Upland cotton: 859 harvested acres
Soybeans for beans: 332 harvested acres
Vegetables: 70 harvested acres
Land in orchards: 951 acres
Earthquake activity:
Denton County-area historical earthquake activity is significantly above Texas state average. It is 510% greater than the overall U.S. average.On 11/6/2011 at 03:53:10, a magnitude 5.7 (5.7 MW, Depth: 3.2 mi, Class: Moderate, Intensity: VI - VII) earthquake occurred 166.7 miles away from Denton County center
On 9/3/2016 at 12:02:44, a magnitude 5.8 (5.8 MW, Depth: 3.5 mi) earthquake occurred 227.7 miles away from the county center
On 6/16/1978 at 11:46:54, a magnitude 5.3 (4.4 MB, 4.6 UK, 5.3 ML) earthquake occurred 214.9 miles away from the county center
On 11/7/2016 at 01:44:24, a magnitude 5.0 (5.0 MW, Depth: 2.8 mi) earthquake occurred 198.1 miles away from the county center
On 11/8/2011 at 02:46:57, a magnitude 4.8 (4.8 MW, Depth: 3.1 mi, Class: Light, Intensity: IV - V) earthquake occurred 166.5 miles away from Denton County center
On 11/5/2011 at 07:12:45, a magnitude 4.8 (4.8 MW, Depth: 1.9 mi) earthquake occurred 167.9 miles away from the county center
Magnitude types: body-wave magnitude (MB), local magnitude (ML), moment magnitude (MW)
Most recent natural disasters:
- Texas Covid-19 Pandemic, Incident Period: January 20, 2020, FEMA Id: 4485, Natural disaster type: Other
- Texas Severe Storms, Tornadoes, Straight-line Winds, and Flooding, Incident Period: May 04, 2015 to June 23, 2015, Major Disaster (Presidential) Declared DR-4223: May 29, 2015, FEMA Id: 4223, Natural disaster type: Storm, Tornado, Flood, Wind
- Texas Hurricane Ike, Incident Period: September 07, 2008 to September 26, 2008, Emergency Declared EM-3294: September 10, 2008, FEMA Id: 3294, Natural disaster type: Hurricane
- Texas Hurricane Gustav, Incident Period: August 27, 2008 to September 07, 2008, Emergency Declared EM-3290: August 29, 2008, FEMA Id: 3290, Natural disaster type: Hurricane
- Texas Wildfires, Incident Period: March 14, 2008 to September 01, 2008, Emergency Declared EM-3284: March 14, 2008, FEMA Id: 3284, Natural disaster type: Fire
- Texas Severe Storms, Tornadoes, and Flooding, Incident Period: June 16, 2007 to August 03, 2007, Major Disaster (Presidential) Declared DR-1709: June 29, 2007, FEMA Id: 1709, Natural disaster type: Storm, Tornado, Flood
- Texas Severe Storms and Tornadoes, Incident Period: April 21, 2007 to April 24, 2007, Major Disaster (Presidential) Declared DR-1697: May 01, 2007, FEMA Id: 1697, Natural disaster type: Storm, Tornado
- Texas North Trinity Fire, Incident Period: June 27, 2006, Fire Management Assistance Declared: June 27, 2006, FEMA Id: 2651, Natural disaster type: Fire
- Texas Hurricane Rita, Incident Period: September 23, 2005 to October 14, 2005, Major Disaster (Presidential) Declared DR-1606: September 24, 2005, FEMA Id: 1606, Natural disaster type: Hurricane
- Texas Hurricane Rita, Incident Period: September 20, 2005 to October 14, 2005, Emergency Declared EM-3261: September 21, 2005, FEMA Id: 3261, Natural disaster type: Hurricane
- 8 other natural disasters have been reported since 1953.
The number of natural disasters in Denton County (18) is near the US average (15).
Major Disasters (Presidential) Declared: 7
Emergencies Declared: 9
Causes of natural disasters: Storms: 6, Fires: 5, Floods: 5, Hurricanes: 5, Tornadoes: 5, Wind: 1, Other: 2 (Note: some incidents may be assigned to more than one category).
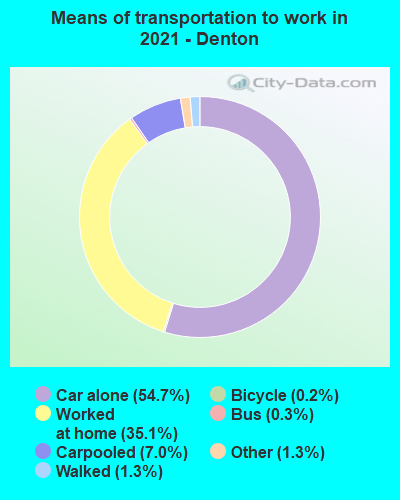
Means of transportation to work:
- Drove a car alone: 246,426 (59.2%)
- Carpooled: 27,697 (6.7%)
- Bus: 1,828 (0.4%)
- Light rail, streetcar or trolley: 373 (0.1%)
- Taxicab, motorcycle, or other means: 5,843 (1.4%)
- Bicycle: 1,977 (0.5%)
- Walked: 5,244 (1.3%)
- Worked at home: 126,702 (30.5%)
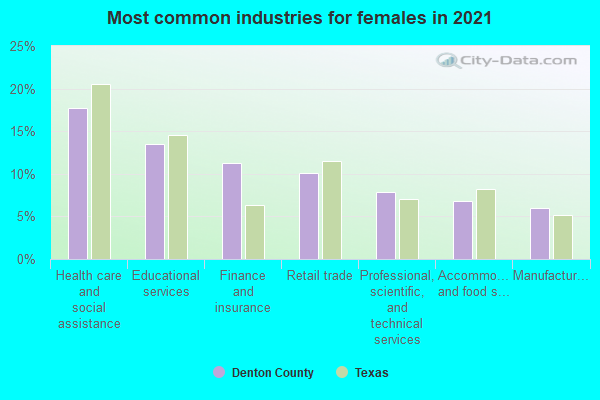
- Health care and social assistance (15%)
- Educational services (13%)
- Retail trade (10%)
- Professional, scientific, and technical services (9%)
- Finance and insurance (8%)
- Accommodation and food services (5%)
- Manufacturing (5%)
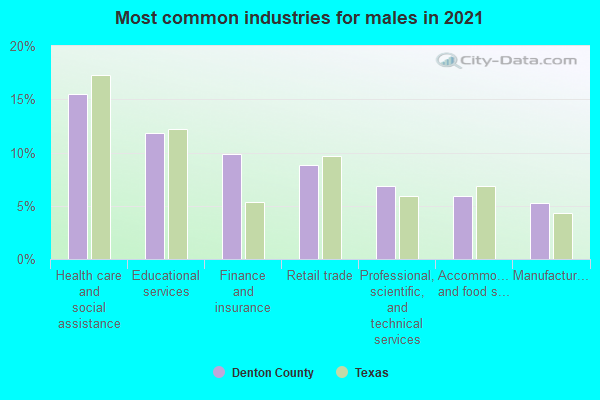
- Health care and social assistance (17%)
- Educational services (15%)
- Retail trade (12%)
- Professional, scientific, and technical services (11%)
- Finance and insurance (9%)
- Accommodation and food services (6%)
- Manufacturing (5%)
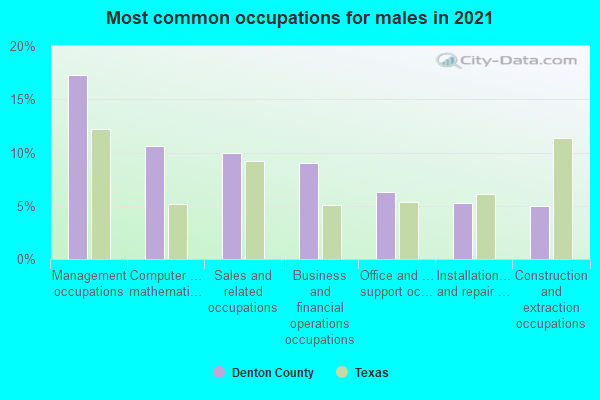
- Management occupations (17%)
- Sales and related occupations (12%)
- Computer and mathematical occupations (10%)
- Business and financial operations occupations (7%)
- Construction and extraction occupations (6%)
- Office and administrative support occupations (6%)
- Installation, maintenance, and repair occupations (5%)
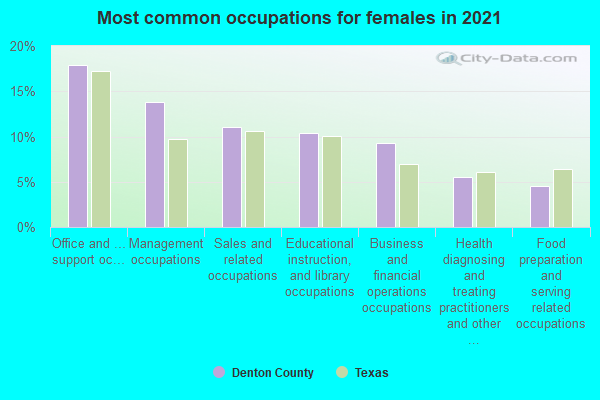
- Office and administrative support occupations (17%)
- Management occupations (15%)
- Educational instruction, and library occupations (11%)
- Sales and related occupations (9%)
- Business and financial operations occupations (9%)
- Health diagnosing and treating practitioners and other technical occupations (6%)
- Food preparation and serving related occupations (4%)
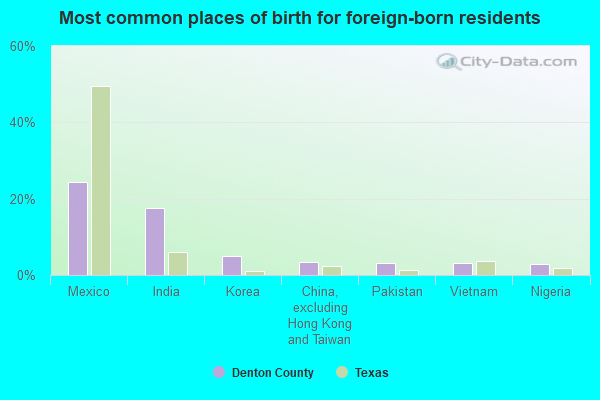
- Mexico (23%)
- India (19%)
- Korea (6%)
- China, excluding Hong Kong and Taiwan (4%)
- Venezuela (3%)
- Pakistan (3%)
- Vietnam (3%)
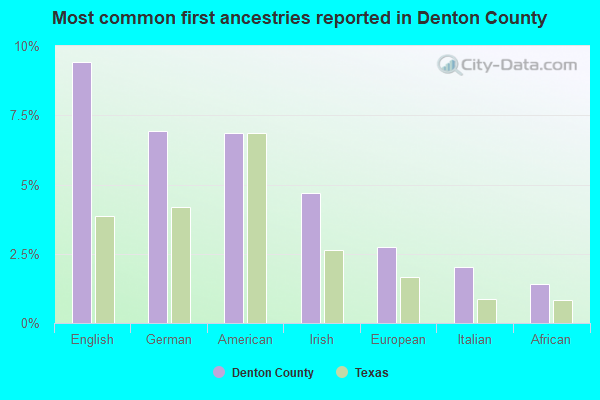
- English (10%)
- German (7%)
- American (7%)
- Irish (5%)
- European (3%)
- Italian (2%)
- Scottish (1%)
People in group quarters in Denton County, Texas in 2010:
- 6,475 people in college/university student housing
- 1,442 people in nursing facilities/skilled-nursing facilities
- 1,179 people in local jails and other municipal confinement facilities
- 559 people in group homes intended for adults
- 235 people in workers' group living quarters and job corps centers
- 164 people in residential treatment centers for adults
- 137 people in other noninstitutional facilities
- 58 people in residential treatment centers for juveniles (non-correctional)
- 49 people in correctional facilities intended for juveniles
- 30 people in group homes for juveniles (non-correctional)
- 9 people in emergency and transitional shelters (with sleeping facilities) for people experiencing homelessness
- 5 people in residential schools for people with disabilities
- 2 people in in-patient hospice facilities
People in group quarters in Denton County, Texas in 2000:
- 5,106 people in college dormitories (includes college quarters off campus)
- 1,339 people in nursing homes
- 888 people in schools, hospitals, or wards for the intellectually disabled
- 697 people in local jails and other confinement facilities (including police lockups)
- 392 people in other noninstitutional group quarters
- 265 people in homes for the mentally retarded
- 131 people in federal prisons and detention centers
- 97 people in other group homes
- 72 people in short-term care, detention or diagnostic centers for delinquent children
- 48 people in training schools for juvenile delinquents
- 46 people in homes for the physically handicapped
- 29 people in homes for abused, dependent, and neglected children
- 19 people in other workers' dormitories
- 17 people in religious group quarters
- 2 people in homes for the mentally ill
- 2 people in other nonhousehold living situations
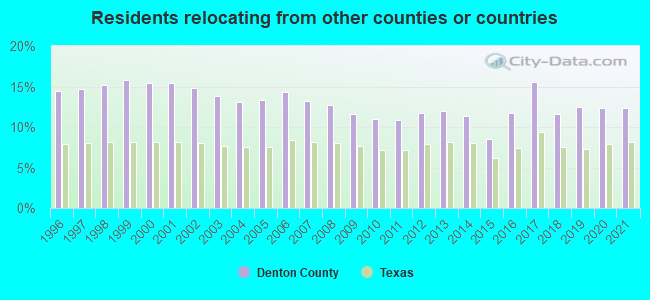
12.39% of this county's 2021 resident taxpayers lived in other counties in 2020 ($93,158 average adjusted gross income)
| Here: | 12.39% |
| Texas average: | 8.12% |
0.01% of residents moved from foreign countries ($94 average AGI)
Denton County: 0.01% Texas average: 0.04%
8.35% relocated from other counties in Texas ($58,945 average AGI)
4.02% relocated from other states ($34,118 average AGI)
Denton County: 4.02% Texas average: 2.83%
Top counties from which taxpayers relocated into this county between 2020 and 2021:
| from Dallas County, TX | |
| from Collin County, TX | |
| from Tarrant County, TX | |
| from Harris County, TX | |
| from Los Angeles County, CA | |
| from Travis County, TX | |
| from Orange County, CA |
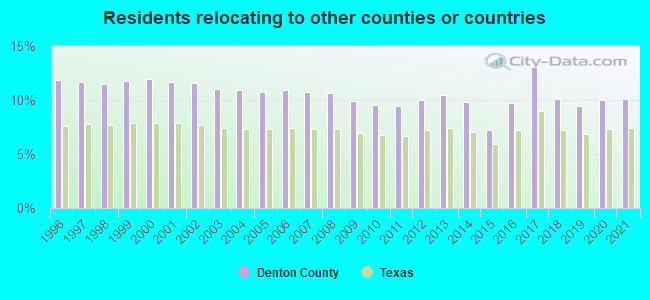
10.07% of this county's 2020 resident taxpayers moved to other counties in 2021 ($79,464 average adjusted gross income)
| Here: | 10.07% |
| Texas average: | 7.40% |
0.01% of residents moved to foreign countries ($63 average AGI)
Denton County: 0.01% Texas average: 0.03%
7.47% relocated to other counties in Texas ($56,838 average AGI)
2.58% relocated to other states ($22,563 average AGI)
Denton County: 2.58% Texas average: 2.08%
Top counties to which taxpayers relocated from this county between 2020 and 2021:
| to Collin County, TX | |
| to Dallas County, TX | |
| to Tarrant County, TX | |
| to Grayson County, TX | |
| to Wise County, TX | |
| to Harris County, TX | |
| to Cooke County, TX |
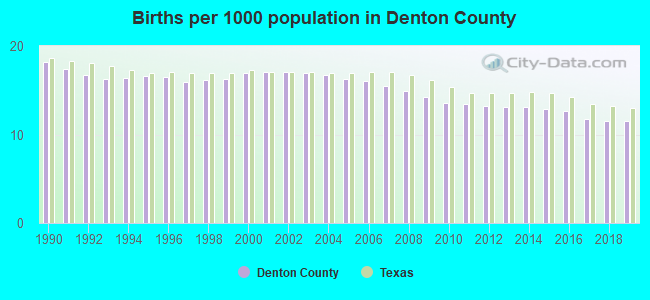
Births per 1000 population from 1990 to 1999: 16.6
Births per 1000 population from 2000 to 2009: 16.2
Births per 1000 population from 2010 to 2022: 10.6
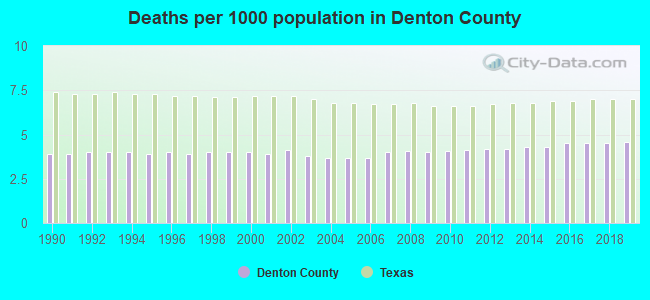
Deaths per 1000 population from 1990 to 1999: 4.0
Deaths per 1000 population from 2000 to 2009: 3.9
Deaths per 1000 population from 2010 to 2020: 4.4
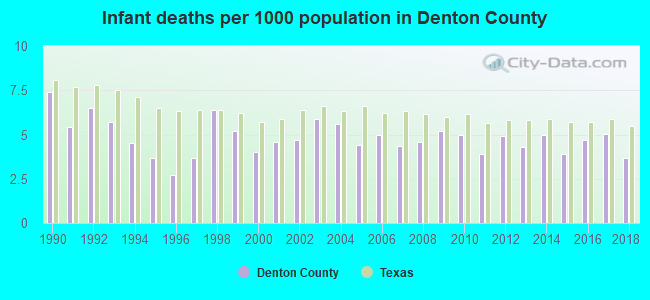
Infant deaths per 1000 live births from 1990 to 1999: 5.1
Infant deaths per 1000 live births from 2000 to 2009: 4.8
Infant deaths per 1000 live births from 2010 to 2021: 4.4
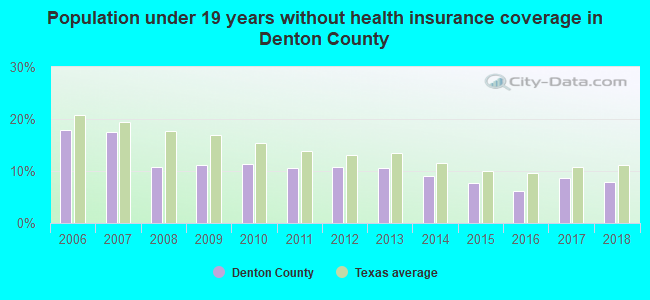
Persons under 19 years old without health insurance coverage in 2018: 7.9%

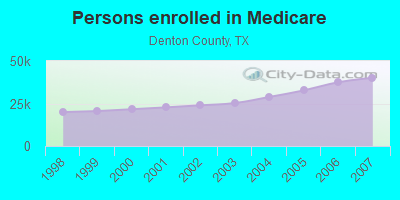
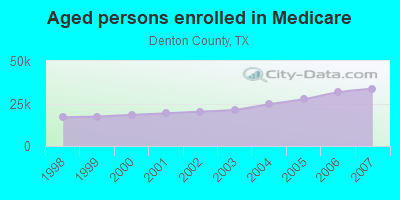
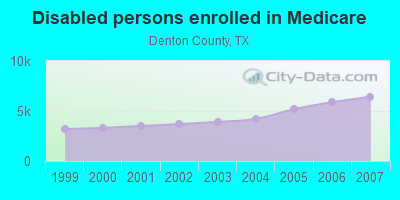
Persons enrolled in hospital insurance and/or supplemental medical insurance (Medicare) in July 1, 2007: 40,143 (33,713 aged, 6,430 disabled)
Children under 18 without health insurance coverage in 2007: 30,923 (17%)
Most common underlying causes of death in Denton County, Texas in 1999 - 2019:
- Bronchus or lung, unspecified - Malignant neoplasms (3,181)
- Atherosclerotic heart disease (3,045)
- Chronic obstructive pulmonary disease, unspecified (2,863)
- Acute myocardial infarction, unspecified (2,333)
- Alzheimer disease, unspecified (2,133)
- Unspecified dementia (2,093)
- Congestive heart failure (1,288)
- Pneumonia, unspecified (1,279)
- Stroke, not specified as haemorrhage or infarction (1,233)
- Atherosclerotic cardiovascular disease, so described (1,227)
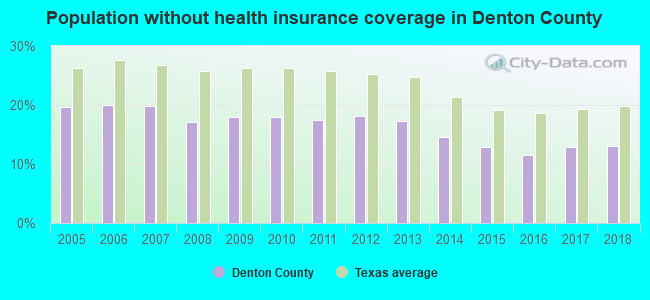
Population without health insurance coverage in 2000: 13%
Children under 18 without health insurance coverage in 2000: 13%
Short term general hospital admissions per 100,000 population in 2004: 6,324
Short term general hospital beds per 100,000 population in 2004: 133
Emergency room visits per 100,000 population in 2004: 24,006
General practice office based MDs per 100,000 population in 2005: 1,594
Medical specialist MDs per 100,000 population in 2005: 382
Dentists per 100,000 population in 1998: 5
Total births per 100,000 population, July 2005 - July 2006 : 31
Total deaths per 100,000 population, July 2005 - July 2006: 67
Limited-service eating places per 100,000 population in 2005 : 11
Beer, wine & liquor stores per 100,000 population in 2005: 1
Homicides per 1,000,000 population from 2000 to 2006: 25.4. This is less than state average.
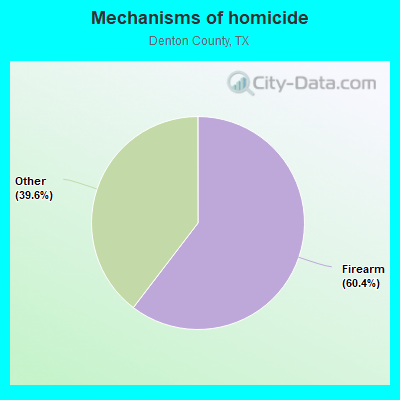
- Firearm - 15.4
- Other - 10.1
Suicides per 1,000,000 population from 2000 to 2006: 83.5. This is less than state average.
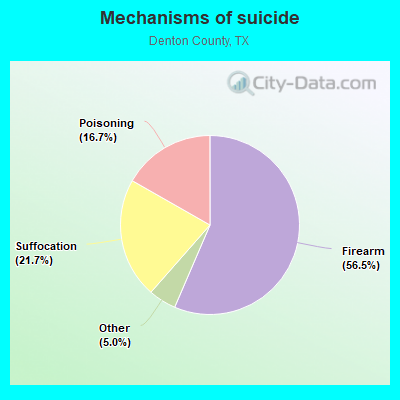
- Firearm - 47.2
- Suffocation - 18.2
- Poisoning - 14.0
- Other - 4.2
Household type by relationship:
Households: 977,281- Male householders: 191,135 (36,813 living alone), Female householders: 170,635 (45,243 living alone)
198,706 spouses (196,502 opposite-sex spouses), 24,574 unmarried partners, (23,353 opposite-sex unmarried partners), 290,771 children (275,608 natural, 4,673 adopted, 10,490 stepchildren), 14,032 grandchildren, 10,261 brothers or sisters, 22,085 parents, 445 foster children, 15,957 other relatives, 27,644 non-relatives
- In group quarters: 11,036
Size of family households: 99,108 2-persons, 63,707 3-persons, 54,805 4-persons, 24,596 5-persons, 10,181 6-persons, 3,305 7-or-more-persons.
Size of nonfamily households: 82,056 1-person, 19,301 2-persons, 2,783 3-persons, 1,856 4-persons, 72 7-or-more-persons.
161,730 married couples with children.
47,590 single-parent households (13,547 men, 34,043 women).
76.0% of residents of Denton speak English at home.
12.8% of residents speak Spanish at home (64% speak English very well, 18% speak English well, 12% speak English not well, 6% don't speak English at all).
4.1% of residents speak other Indo-European language at home (77% speak English very well, 19% speak English well, 3% speak English not well, 1% don't speak English at all).
5.8% of residents speak Asian or Pacific Island language at home (64% speak English very well, 24% speak English well, 10% speak English not well, 2% don't speak English at all).
1.2% of residents speak other language at home (90% speak English very well, 7% speak English well, 3% speak English not well).
In fiscal year 2004:
Federal Government expenditure: $1,057,753,000 ($1,994 per capita)
Department of Defense expenditure: $142,834,000
Federal direct payments to individuals for retirement and disability: $497,996,000
Federal other direct payments to individuals: $195,832,000
Federal direct payments not to individuals: $5,984,000
Federal grants: $149,261,000
Federal procurement contracts: $114,784,000 ($80,992,000 Department of Defense)
Federal salaries and wages: $93,896,000 ($2,751,000 Department of Defense)
Federal Government direct loans: $951,000
Federal guaranteed/insured loans: $843,750,000
Federal Government insurance: $178,087,000
Population change from April 1, 2000 to July 1, 2005:
Births: 42,888| Here: | 77 per 1000 residents |
| State: | 85 per 1000 residents |
Deaths: 9,955
| Here: | 18 per 1000 residents |
| State: | 35 per 1000 residents |
Net international migration: +10,508
| Here: | +19 per 1000 residents |
| State: | +29 per 1000 residents |
Net internal migration: +79,129
| Here: | +143 per 1000 residents |
| State: | +10 per 1000 residents |
Total withdrawal of fresh water for public supply: 369.98 millions of gallons per day (3% from ground, 97% from surface)
| Here: | 7.3 |
| State: | 6.3 |
| Here: | 3.9 |
| State: | 4.0 |
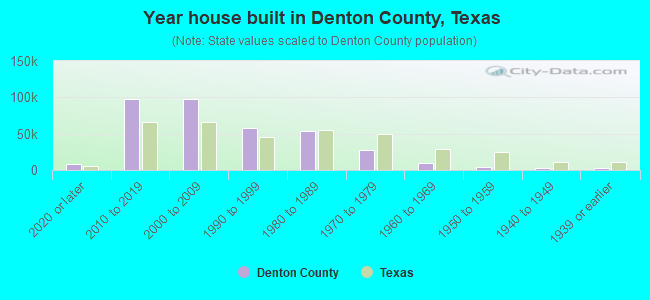
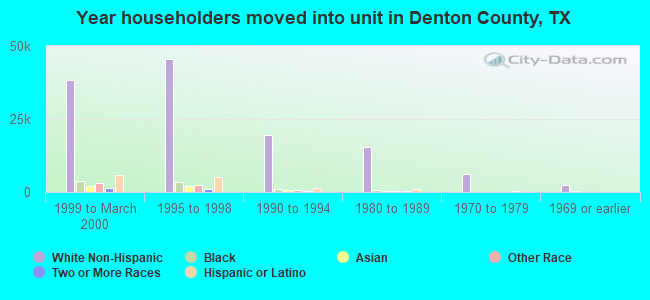
- Year house built in Denton County, Texas
- 20,3512020 or later
- 102,6022010 to 2019
- 99,2772000 to 2009
- 59,1311990 to 1999
- 51,6861980 to 1989
- 27,6531970 to 1979
- 7,8691960 to 1969
- 4,2701950 to 1959
- 1,9281940 to 1949
- 1,8731939 or earlier
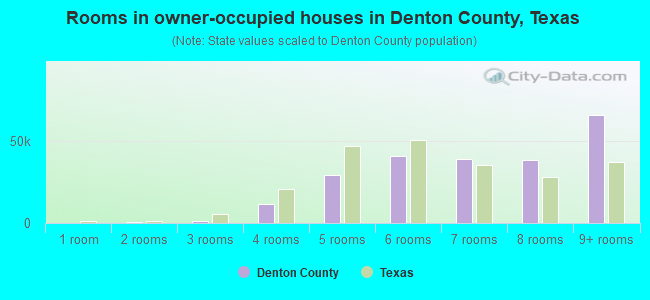
- Rooms in owner-occupied houses in Denton County, Texas
- 5851 room
- 4332 rooms
- 1,7403 rooms
- 13,7504 rooms
- 30,6535 rooms
- 41,8336 rooms
- 37,0027 rooms
- 39,6178 rooms
- 69,1079+ rooms
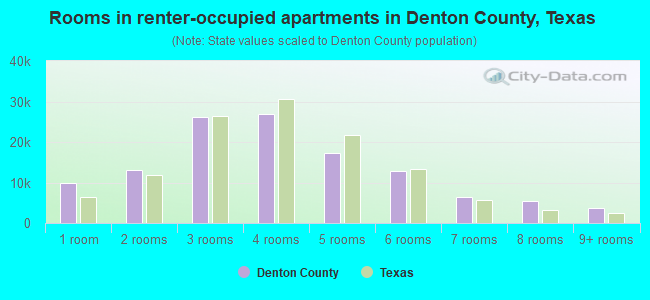
- Rooms in renter-occupied apartments in Denton County, Texas
- 8,2091 room
- 19,7102 rooms
- 25,0623 rooms
- 25,1144 rooms
- 17,7595 rooms
- 12,6366 rooms
- 7,5797 rooms
- 5,1568 rooms
- 5,8259+ rooms
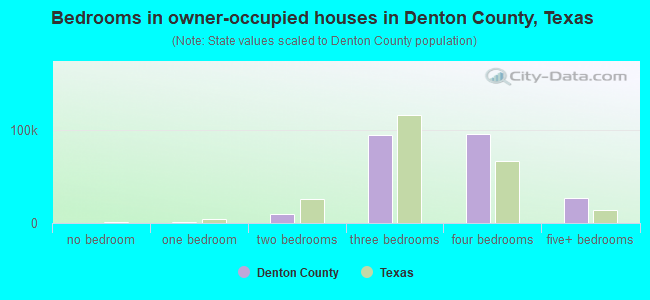
- Bedrooms in owner-occupied houses in Denton County, Texas
- 585no bedroom
- 9911 bedroom
- 12,9402 bedrooms
- 100,2233 bedrooms
- 89,6744 bedrooms
- 30,3075+ bedrooms
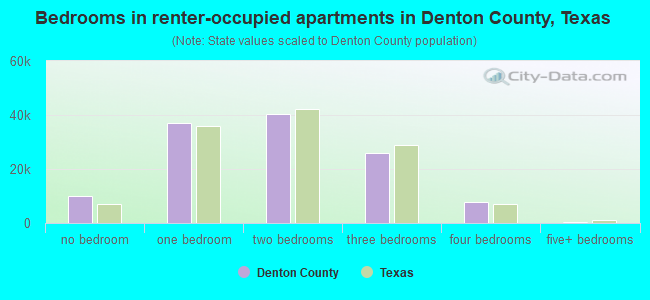
- Bedrooms in renter-occupied apartments in Denton County, Texas
- 9,149no bedroom
- 40,8681 bedroom
- 36,8462 bedrooms
- 27,2403 bedrooms
- 11,6584 bedrooms
- 1,2895+ bedrooms
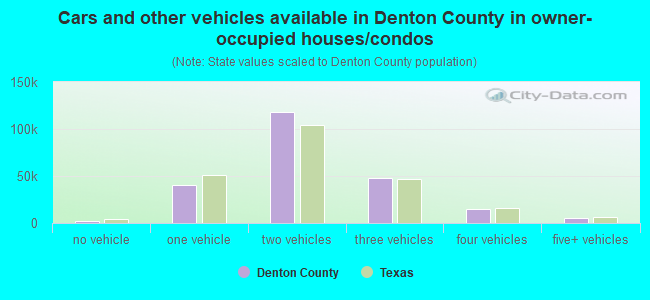
- Cars and other vehicles available in Denton County in owner-occupied houses/condos
- 2,611no vehicle
- 43,1691 vehicle
- 120,4132 vehicles
- 47,3563 vehicles
- 15,1654 vehicles
- 6,0065+ vehicles
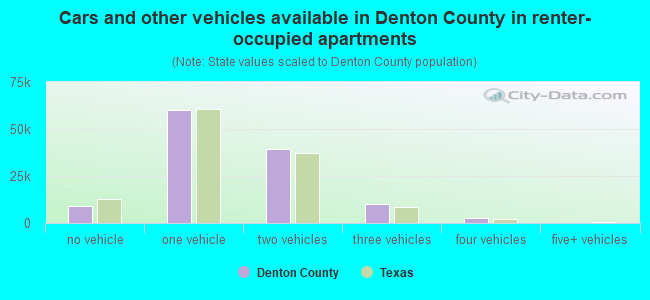
- Cars and other vehicles available in Denton County in renter-occupied apartments
- 11,304no vehicle
- 58,4021 vehicle
- 43,3172 vehicles
- 10,8683 vehicles
- 2,3464 vehicles
- 8135+ vehicles
84.3% of Denton County residents lived in the same house 1 years ago.
Out of people who lived in different houses, 29% lived in this county.
Out of people who lived in different counties, 63% lived in Texas.
| Denton County: | 84.3% |
| State average: | 85.7% |
Place of birth for U.S.-born residents:
- This state: 446,054
- Other state: 351,940
- Northeast: 47,952
- Midwest: 103,362
- South: 110,998
- West: 89,628
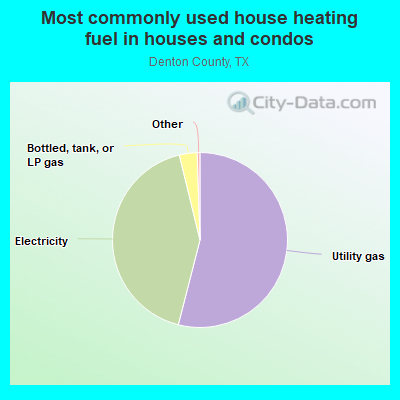
- 55.1%Utility gas
- 41.8%Electricity
- 2.4%Bottled, tank, or LP gas
- 0.3%Solar energy
- 0.2%Wood
- 0.2%No fuel used
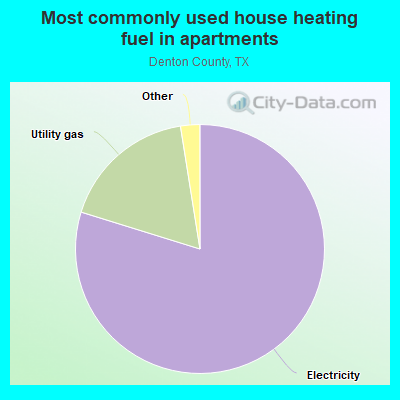
- 82.3%Electricity
- 14.8%Utility gas
- 1.6%Bottled, tank, or LP gas
- 0.8%No fuel used
- 0.3%Other fuel
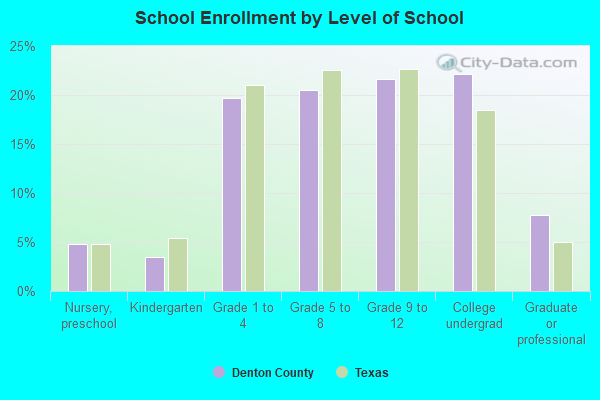
Private vs. public school enrollment:
| Here: | 7.2% |
| Texas: | 8.8% |
| Here: | 8.0% |
| Texas: | 8.0% |
| Here: | 10.2% |
| Texas: | 16.2% |
Denton County government finances - Expenditure in 2020:
- Bond Funds - Cash and Securities: $246,333,000
Cash and Securities: $224,734,000
- Charges - Other: $22,879,000
Other: $20,829,000
- Construction - Regular Highways: $23,784,000
Regular Highways: $23,558,000
Judicial and Legal Services: $19,169,000
Judicial and Legal Services: $13,573,000
Central Staff Services: $8,669,000
Correctional Institutions: $4,801,000
Central Staff Services: $3,867,000
Police Protection: $1,121,000
Police Protection: $408,000
- Current Operations - Judicial and Legal Services: $41,814,000
Health - Other: $41,464,000
Health - Other: $39,379,000
Judicial and Legal Services: $38,291,000
Correctional Institutions: $36,049,000
Correctional Institutions: $33,450,000
Police Protection: $26,634,000
Police Protection: $24,476,000
General - Other: $19,990,000
General - Other: $19,271,000
Corrections - Other: $15,776,000
General Public Buildings: $14,014,000
Corrections - Other: $13,973,000
Central Staff Services: $12,175,000
General Public Buildings: $11,086,000
Regular Highways: $11,054,000
Regular Highways: $10,655,000
Central Staff Services: $9,576,000
Financial Administration: $9,557,000
Financial Administration: $8,266,000
Local Fire Protection: $3,062,000
Local Fire Protection: $2,767,000
Public Welfare - Other: $2,342,000
Public Welfare, Vendor Payments for Medical Care: $1,872,000
Public Welfare, Vendor Payments for Medical Care: $1,444,000
Parks and Recreation: $743,000
Parks and Recreation: $599,000
Natural Resources - Other: $496,000
Natural Resources - Other: $483,000
Protective Inspection and Regulation - Other: $171,000
Protective Inspection and Regulation - Other: $150,000
- Federal Intergovernmental - Health and Hospitals: $1,916,000
Health and Hospitals: $1,522,000
- General - Interest on Debt: $26,422,000
Interest on Debt: $25,497,000
- Intergovernmental to Local - Other - General - Other: $3,384,000
Other - General - Other: $3,085,000
- Local Intergovernmental - Health and Hospitals: $1,354,000
Health and Hospitals: $1,341,000
- Long Term Debt - Outstanding Unspecified Public Purpose: $646,458,000
Beginning Outstanding - Unspecified Public Purpose: $613,459,000
Beginning Outstanding - Unspecified Public Purpose: $610,197,000
Outstanding Unspecified Public Purpose: $580,617,000
Issue, Unspecified Public Purpose: $147,600,000
Retired Unspecified Public Purpose: $111,339,000
Retired Unspecified Public Purpose: $32,842,000
- Miscellaneous - Interest Earnings: $7,567,000
General Revenue - Other: $6,886,000
General Revenue - Other: $4,030,000
Fines and Forfeits: $3,649,000
Fines and Forfeits: $3,004,000
Interest Earnings: $2,942,000
Donations From Private Sources: $80,000
Donations From Private Sources: $20,000
Sale of Property: $19,000
- Other Capital Outlay - General - Other: $4,382,000
General - Other: $2,852,000
Health - Other: $229,000
- Other Funds - Cash and Securities: $165,182,000
Cash and Securities: $78,584,000
- Sinking Funds - Cash and Securities: $6,726,000
Cash and Securities: $5,150,000
- State Intergovernmental - Health and Hospitals: $31,176,000
Health and Hospitals: $30,239,000
Other: $13,533,000
Other: $11,765,000
Public Welfare: $3,508,000
Public Welfare: $2,839,000
General Local Government Support: $2,573,000
General Local Government Support: $2,320,000
Highways: $621,000
Highways: $221,000
- Tax - Property: $224,836,000
Property: $197,130,000
Motor Vehicle License: $7,214,000
Motor Vehicle License: $6,515,000
Other License: $5,115,000
Other License: $4,418,000
Amusements Sales: $18,000
- Total Salaries and Wages: $15,267,000
: $14,454,000
Denton County government finances - Revenue in 2020:
- Bond Funds - Cash and Securities: $246,333,000
Cash and Securities: $224,734,000
- Charges - Other: $22,879,000
Other: $20,829,000
- Construction - Regular Highways: $23,784,000
Regular Highways: $23,558,000
Judicial and Legal Services: $19,169,000
Judicial and Legal Services: $13,573,000
Central Staff Services: $8,669,000
Correctional Institutions: $4,801,000
Central Staff Services: $3,867,000
Police Protection: $1,121,000
Police Protection: $408,000
- Current Operations - Judicial and Legal Services: $41,814,000
Health - Other: $41,464,000
Health - Other: $39,379,000
Judicial and Legal Services: $38,291,000
Correctional Institutions: $36,049,000
Correctional Institutions: $33,450,000
Police Protection: $26,634,000
Police Protection: $24,476,000
General - Other: $19,990,000
General - Other: $19,271,000
Corrections - Other: $15,776,000
General Public Buildings: $14,014,000
Corrections - Other: $13,973,000
Central Staff Services: $12,175,000
General Public Buildings: $11,086,000
Regular Highways: $11,054,000
Regular Highways: $10,655,000
Central Staff Services: $9,576,000
Financial Administration: $9,557,000
Financial Administration: $8,266,000
Local Fire Protection: $3,062,000
Local Fire Protection: $2,767,000
Public Welfare - Other: $2,342,000
Public Welfare, Vendor Payments for Medical Care: $1,872,000
Public Welfare, Vendor Payments for Medical Care: $1,444,000
Parks and Recreation: $743,000
Parks and Recreation: $599,000
Natural Resources - Other: $496,000
Natural Resources - Other: $483,000
Protective Inspection and Regulation - Other: $171,000
Protective Inspection and Regulation - Other: $150,000
- Federal Intergovernmental - Health and Hospitals: $1,916,000
Health and Hospitals: $1,522,000
- General - Interest on Debt: $26,422,000
Interest on Debt: $25,497,000
- Intergovernmental to Local - Other - General - Other: $3,384,000
Other - General - Other: $3,085,000
- Local Intergovernmental - Health and Hospitals: $1,354,000
Health and Hospitals: $1,341,000
- Long Term Debt - Outstanding Unspecified Public Purpose: $646,458,000
Beginning Outstanding - Unspecified Public Purpose: $613,459,000
Beginning Outstanding - Unspecified Public Purpose: $610,197,000
Outstanding Unspecified Public Purpose: $580,617,000
Issue, Unspecified Public Purpose: $147,600,000
Retired Unspecified Public Purpose: $111,339,000
Retired Unspecified Public Purpose: $32,842,000
- Miscellaneous - Interest Earnings: $7,567,000
General Revenue - Other: $6,886,000
General Revenue - Other: $4,030,000
Fines and Forfeits: $3,649,000
Fines and Forfeits: $3,004,000
Interest Earnings: $2,942,000
Donations From Private Sources: $80,000
Donations From Private Sources: $20,000
Sale of Property: $19,000
- Other Capital Outlay - General - Other: $4,382,000
General - Other: $2,852,000
Health - Other: $229,000
- Other Funds - Cash and Securities: $165,182,000
Cash and Securities: $78,584,000
- Sinking Funds - Cash and Securities: $6,726,000
Cash and Securities: $5,150,000
- State Intergovernmental - Health and Hospitals: $31,176,000
Health and Hospitals: $30,239,000
Other: $13,533,000
Other: $11,765,000
Public Welfare: $3,508,000
Public Welfare: $2,839,000
General Local Government Support: $2,573,000
General Local Government Support: $2,320,000
Highways: $621,000
Highways: $221,000
- Tax - Property: $224,836,000
Property: $197,130,000
Motor Vehicle License: $7,214,000
Motor Vehicle License: $6,515,000
Other License: $5,115,000
Other License: $4,418,000
Amusements Sales: $18,000
- Total Salaries and Wages: $15,267,000
: $14,454,000
Denton County government finances - Debt in 2020:
- Bond Funds - Cash and Securities: $246,333,000
Cash and Securities: $224,734,000
- Charges - Other: $22,879,000
Other: $20,829,000
- Construction - Regular Highways: $23,784,000
Regular Highways: $23,558,000
Judicial and Legal Services: $19,169,000
Judicial and Legal Services: $13,573,000
Central Staff Services: $8,669,000
Correctional Institutions: $4,801,000
Central Staff Services: $3,867,000
Police Protection: $1,121,000
Police Protection: $408,000
- Current Operations - Judicial and Legal Services: $41,814,000
Health - Other: $41,464,000
Health - Other: $39,379,000
Judicial and Legal Services: $38,291,000
Correctional Institutions: $36,049,000
Correctional Institutions: $33,450,000
Police Protection: $26,634,000
Police Protection: $24,476,000
General - Other: $19,990,000
General - Other: $19,271,000
Corrections - Other: $15,776,000
General Public Buildings: $14,014,000
Corrections - Other: $13,973,000
Central Staff Services: $12,175,000
General Public Buildings: $11,086,000
Regular Highways: $11,054,000
Regular Highways: $10,655,000
Central Staff Services: $9,576,000
Financial Administration: $9,557,000
Financial Administration: $8,266,000
Local Fire Protection: $3,062,000
Local Fire Protection: $2,767,000
Public Welfare - Other: $2,342,000
Public Welfare, Vendor Payments for Medical Care: $1,872,000
Public Welfare, Vendor Payments for Medical Care: $1,444,000
Parks and Recreation: $743,000
Parks and Recreation: $599,000
Natural Resources - Other: $496,000
Natural Resources - Other: $483,000
Protective Inspection and Regulation - Other: $171,000
Protective Inspection and Regulation - Other: $150,000
- Federal Intergovernmental - Health and Hospitals: $1,916,000
Health and Hospitals: $1,522,000
- General - Interest on Debt: $26,422,000
Interest on Debt: $25,497,000
- Intergovernmental to Local - Other - General - Other: $3,384,000
Other - General - Other: $3,085,000
- Local Intergovernmental - Health and Hospitals: $1,354,000
Health and Hospitals: $1,341,000
- Long Term Debt - Outstanding Unspecified Public Purpose: $646,458,000
Beginning Outstanding - Unspecified Public Purpose: $613,459,000
Beginning Outstanding - Unspecified Public Purpose: $610,197,000
Outstanding Unspecified Public Purpose: $580,617,000
Issue, Unspecified Public Purpose: $147,600,000
Retired Unspecified Public Purpose: $111,339,000
Retired Unspecified Public Purpose: $32,842,000
- Miscellaneous - Interest Earnings: $7,567,000
General Revenue - Other: $6,886,000
General Revenue - Other: $4,030,000
Fines and Forfeits: $3,649,000
Fines and Forfeits: $3,004,000
Interest Earnings: $2,942,000
Donations From Private Sources: $80,000
Donations From Private Sources: $20,000
Sale of Property: $19,000
- Other Capital Outlay - General - Other: $4,382,000
General - Other: $2,852,000
Health - Other: $229,000
- Other Funds - Cash and Securities: $165,182,000
Cash and Securities: $78,584,000
- Sinking Funds - Cash and Securities: $6,726,000
Cash and Securities: $5,150,000
- State Intergovernmental - Health and Hospitals: $31,176,000
Health and Hospitals: $30,239,000
Other: $13,533,000
Other: $11,765,000
Public Welfare: $3,508,000
Public Welfare: $2,839,000
General Local Government Support: $2,573,000
General Local Government Support: $2,320,000
Highways: $621,000
Highways: $221,000
- Tax - Property: $224,836,000
Property: $197,130,000
Motor Vehicle License: $7,214,000
Motor Vehicle License: $6,515,000
Other License: $5,115,000
Other License: $4,418,000
Amusements Sales: $18,000
- Total Salaries and Wages: $15,267,000
: $14,454,000
Denton County government finances - Cash and Securities in 2020:
- Bond Funds - Cash and Securities: $246,333,000
Cash and Securities: $224,734,000
- Charges - Other: $22,879,000
Other: $20,829,000
- Construction - Regular Highways: $23,784,000
Regular Highways: $23,558,000
Judicial and Legal Services: $19,169,000
Judicial and Legal Services: $13,573,000
Central Staff Services: $8,669,000
Correctional Institutions: $4,801,000
Central Staff Services: $3,867,000
Police Protection: $1,121,000
Police Protection: $408,000
- Current Operations - Judicial and Legal Services: $41,814,000
Health - Other: $41,464,000
Health - Other: $39,379,000
Judicial and Legal Services: $38,291,000
Correctional Institutions: $36,049,000
Correctional Institutions: $33,450,000
Police Protection: $26,634,000
Police Protection: $24,476,000
General - Other: $19,990,000
General - Other: $19,271,000
Corrections - Other: $15,776,000
General Public Buildings: $14,014,000
Corrections - Other: $13,973,000
Central Staff Services: $12,175,000
General Public Buildings: $11,086,000
Regular Highways: $11,054,000
Regular Highways: $10,655,000
Central Staff Services: $9,576,000
Financial Administration: $9,557,000
Financial Administration: $8,266,000
Local Fire Protection: $3,062,000
Local Fire Protection: $2,767,000
Public Welfare - Other: $2,342,000
Public Welfare, Vendor Payments for Medical Care: $1,872,000
Public Welfare, Vendor Payments for Medical Care: $1,444,000
Parks and Recreation: $743,000
Parks and Recreation: $599,000
Natural Resources - Other: $496,000
Natural Resources - Other: $483,000
Protective Inspection and Regulation - Other: $171,000
Protective Inspection and Regulation - Other: $150,000
- Federal Intergovernmental - Health and Hospitals: $1,916,000
Health and Hospitals: $1,522,000
- General - Interest on Debt: $26,422,000
Interest on Debt: $25,497,000
- Intergovernmental to Local - Other - General - Other: $3,384,000
Other - General - Other: $3,085,000
- Local Intergovernmental - Health and Hospitals: $1,354,000
Health and Hospitals: $1,341,000
- Long Term Debt - Outstanding Unspecified Public Purpose: $646,458,000
Beginning Outstanding - Unspecified Public Purpose: $613,459,000
Beginning Outstanding - Unspecified Public Purpose: $610,197,000
Outstanding Unspecified Public Purpose: $580,617,000
Issue, Unspecified Public Purpose: $147,600,000
Retired Unspecified Public Purpose: $111,339,000
Retired Unspecified Public Purpose: $32,842,000
- Miscellaneous - Interest Earnings: $7,567,000
General Revenue - Other: $6,886,000
General Revenue - Other: $4,030,000
Fines and Forfeits: $3,649,000
Fines and Forfeits: $3,004,000
Interest Earnings: $2,942,000
Donations From Private Sources: $80,000
Donations From Private Sources: $20,000
Sale of Property: $19,000
- Other Capital Outlay - General - Other: $4,382,000
General - Other: $2,852,000
Health - Other: $229,000
- Other Funds - Cash and Securities: $165,182,000
Cash and Securities: $78,584,000
- Sinking Funds - Cash and Securities: $6,726,000
Cash and Securities: $5,150,000
- State Intergovernmental - Health and Hospitals: $31,176,000
Health and Hospitals: $30,239,000
Other: $13,533,000
Other: $11,765,000
Public Welfare: $3,508,000
Public Welfare: $2,839,000
General Local Government Support: $2,573,000
General Local Government Support: $2,320,000
Highways: $621,000
Highways: $221,000
- Tax - Property: $224,836,000
Property: $197,130,000
Motor Vehicle License: $7,214,000
Motor Vehicle License: $6,515,000
Other License: $5,115,000
Other License: $4,418,000
Amusements Sales: $18,000
- Total Salaries and Wages: $15,267,000
: $14,454,000
Supplemental Security Income (SSI) in 2006:
- Total number of recipients: 4,134
- Number of aged recipients: 814
- Number of blind and disabled recipients: 3,320
- Number of recipients under 18: 795
- Number of recipients between 18 and 64: 2,223
- Number of recipients older than 64: 1,116
- Number of recipients also receiving OASDI: 1,137
- Amount of payments (thousands of dollars): 1,687
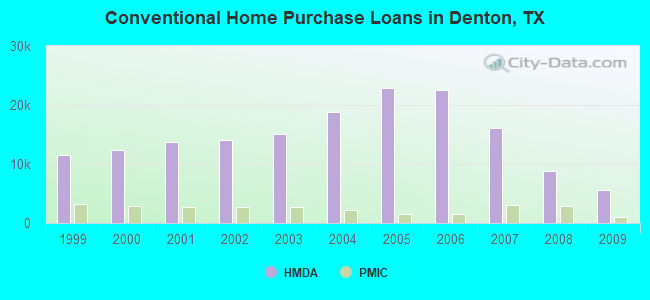
| Home Mortgage Disclosure Act Aggregated Statistics For Year 2009 (Based on 56 full tracts) | ||||||||||||||
| A) FHA, FSA/RHS & VA Home Purchase Loans | B) Conventional Home Purchase Loans | C) Refinancings | D) Home Improvement Loans | E) Loans on Dwellings For 5+ Families | F) Non-occupant Loans on < 5 Family Dwellings (A B C & D) | G) Loans On Manufactured Home Dwelling (A B C & D) | ||||||||
|---|---|---|---|---|---|---|---|---|---|---|---|---|---|---|
| Number | Average Value | Number | Average Value | Number | Average Value | Number | Average Value | Number | Average Value | Number | Average Value | Number | Average Value | |
| LOANS ORIGINATED | 4,860 | $164,737 | 5,659 | $195,213 | 14,460 | $196,092 | 540 | $61,293 | 17 | $2,504,588 | 807 | $140,817 | 166 | $57,434 |
| APPLICATIONS APPROVED, NOT ACCEPTED | 193 | $165,596 | 467 | $179,666 | 1,282 | $181,334 | 118 | $37,517 | 1 | $8,112,000 | 74 | $127,541 | 52 | $48,577 |
| APPLICATIONS DENIED | 594 | $159,455 | 785 | $179,994 | 3,820 | $194,097 | 606 | $44,899 | 5 | $5,482,000 | 260 | $144,692 | 120 | $47,633 |
| APPLICATIONS WITHDRAWN | 559 | $166,875 | 697 | $222,263 | 2,990 | $193,602 | 142 | $72,873 | 3 | $507,000 | 139 | $141,324 | 28 | $82,464 |
| FILES CLOSED FOR INCOMPLETENESS | 88 | $156,341 | 126 | $224,246 | 772 | $191,347 | 91 | $60,912 | 0 | $0 | 23 | $148,261 | 15 | $65,200 |
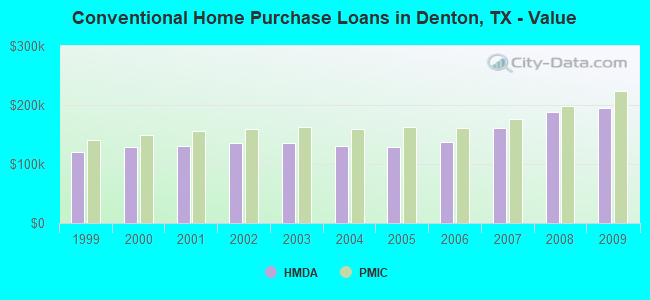
| Private Mortgage Insurance Companies Aggregated Statistics For Year 2009 (Based on 55 full tracts) | ||||||||
| A) Conventional Home Purchase Loans | B) Refinancings | C) Non-occupant Loans on < 5 Family Dwellings (A & B) | D) Loans On Manufactured Home Dwelling (A & B) | |||||
|---|---|---|---|---|---|---|---|---|
| Number | Average Value | Number | Average Value | Number | Average Value | Number | Average Value | |
| LOANS ORIGINATED | 1,065 | $224,033 | 624 | $203,575 | 9 | $131,333 | 1 | $36,000 |
| APPLICATIONS APPROVED, NOT ACCEPTED | 227 | $228,824 | 226 | $223,252 | 13 | $133,846 | 0 | $0 |
| APPLICATIONS DENIED | 105 | $268,505 | 97 | $224,969 | 4 | $145,500 | 0 | $0 |
| APPLICATIONS WITHDRAWN | 60 | $242,517 | 61 | $203,475 | 1 | $207,000 | 0 | $0 |
| FILES CLOSED FOR INCOMPLETENESS | 19 | $240,211 | 14 | $204,571 | 1 | $99,000 | 0 | $0 |
| Most common first names in Denton County, TX among deceased individuals | ||
| Name | Count | Lived (average) |
|---|---|---|
| James | 873 | 71.2 years |
| Mary | 838 | 78.9 years |
| John | 782 | 73.3 years |
| William | 753 | 74.8 years |
| Robert | 631 | 71.1 years |
| Charles | 385 | 71.6 years |
| George | 345 | 75.4 years |
| Dorothy | 309 | 77.7 years |
| Ruth | 292 | 81.3 years |
| Thomas | 280 | 71.1 years |
| Most common last names in Denton County, TX among deceased individuals | ||
| Last name | Count | Lived (average) |
|---|---|---|
| Smith | 454 | 74.7 years |
| Jones | 290 | 74.2 years |
| Davis | 266 | 74.5 years |
| Johnson | 262 | 72.9 years |
| Williams | 261 | 75.6 years |
| Wilson | 209 | 76.5 years |
| Brown | 206 | 75.2 years |
| Miller | 182 | 74.0 years |
| Taylor | 171 | 74.6 years |
| Harris | 157 | 73.8 years |
| Businesses in Denton County, TX | ||||
| Name | Count | Name | Count | |
|---|---|---|---|---|
| 24 Hour Fitness | 2 | KFC | 7 | |
| 7-Eleven | 19 | Knights Inn | 1 | |
| ALDO | 1 | Kohl's | 3 | |
| AT&T | 14 | Kroger | 9 | |
| Abercrombie & Fitch | 1 | LA Fitness | 2 | |
| Abercrombie Kids | 1 | La Quinta | 2 | |
| Academy Sports + Outdoors | 1 | La-Z-Boy | 1 | |
| Ace Hardware | 3 | Lane Bryant | 3 | |
| Aeropostale | 3 | Lane Furniture | 4 | |
| Albertsons | 5 | LensCrafters | 1 | |
| Alco Stores | 1 | Little Caesars Pizza | 5 | |
| American Eagle Outfitters | 3 | Long John Silver's | 3 | |
| Ann Taylor | 2 | Lowe's | 4 | |
| Apple Store | 1 | Macy's | 2 | |
| Applebee's | 4 | Marriott | 3 | |
| Arby's | 4 | Marshalls | 1 | |
| Ashley Furniture | 1 | MasterBrand Cabinets | 1 | |
| AutoZone | 8 | Mazda | 1 | |
| Banana Republic | 2 | McDonald's | 15 | |
| Barnes & Noble | 3 | Men's Wearhouse | 2 | |
| Baskin-Robbins | 5 | Motel 6 | 3 | |
| Bath & Body Works | 4 | Motherhood Maternity | 4 | |
| Bebe | 1 | New Balance | 4 | |
| Bed Bath & Beyond | 2 | New York & Co | 1 | |
| Ben & Jerry's | 1 | Nike | 29 | |
| Best Western | 4 | Nissan | 1 | |
| Blockbuster | 9 | Nordstrom | 1 | |
| Brookstone | 1 | Office Depot | 3 | |
| Brunswick Bowling & Billiards | 1 | OfficeMax | 2 | |
| Budget Car Rental | 1 | Old Navy | 3 | |
| Burger King | 5 | Olive Garden | 2 | |
| Buybuy BABY | 1 | On The Border | 1 | |
| CVS | 9 | Outback | 1 | |
| Cache | 1 | Outback Steakhouse | 1 | |
| Carl\s Jr. | 2 | Pac Sun | 2 | |
| Catherines | 1 | Panda Express | 4 | |
| Charlotte Russe | 1 | Panera Bread | 1 | |
| Chevrolet | 2 | Papa John's Pizza | 1 | |
| Chick-Fil-A | 8 | Payless | 6 | |
| Chico's | 2 | Penske | 3 | |
| Chipotle | 3 | PetSmart | 3 | |
| Chuck E. Cheese's | 1 | Pier 1 Imports | 3 | |
| Church's Chicken | 2 | Pizza Hut | 9 | |
| Cinnabon | 3 | Plato's Closet | 3 | |
| Circle K | 2 | Popeyes | 3 | |
| Clarks | 1 | Pottery Barn | 1 | |
| Coldwater Creek | 3 | Pottery Barn Kids | 1 | |
| Comfort Suites | 2 | Quality | 1 | |
| Curves | 3 | Quiznos | 9 | |
| DHL | 9 | RadioShack | 11 | |
| Dairy Queen | 2 | Red Lobster | 2 | |
| Days Inn | 1 | Red Robin | 1 | |
| Decora Cabinetry | 1 | Rodeway Inn | 1 | |
| Dennys | 1 | Rooms To Go | 2 | |
| Discount Tire | 5 | Rue21 | 2 | |
| Domino's Pizza | 5 | SONIC Drive-In | 28 | |
| DressBarn | 2 | Safeway | 5 | |
| Dressbarn | 1 | Sam's Club | 1 | |
| Dunkin Donuts | 4 | Sears | 5 | |
| Eddie Bauer | 2 | Sephora | 3 | |
| Ethan Allen | 1 | Sheraton | 1 | |
| Express | 1 | Sleep Inn | 1 | |
| Extended Stay America | 1 | Soma Intimates | 2 | |
| Famous Footwear | 4 | Spencer Gifts | 2 | |
| FedEx | 62 | Sprint Nextel | 6 | |
| Finish Line | 2 | Staples | 2 | |
| Firestone Complete Auto Care | 6 | Starbucks | 29 | |
| Ford | 2 | Steak 'n Shake | 1 | |
| Forever 21 | 1 | Subaru | 1 | |
| GNC | 6 | Suburban | 1 | |
| GameStop | 12 | Subway | 38 | |
| Gap | 1 | Super 8 | 1 | |
| Gymboree | 2 | T-Mobile | 22 | |
| H&R Block | 18 | T.J.Maxx | 3 | |
| Havertys Furniture | 1 | Taco Bell | 11 | |
| Hilton | 5 | Talbots | 1 | |
| Hobby Lobby | 4 | Target | 5 | |
| Holiday Inn | 4 | The Cheesecake Factory | 1 | |
| Hollister Co. | 2 | The Limited | 1 | |
| Home Depot | 4 | The Room Place | 2 | |
| Honda | 3 | Torrid | 1 | |
| Hot Topic | 2 | Toys"R"Us | 2 | |
| Howard Johnson | 1 | U-Haul | 18 | |
| IHOP | 7 | UPS | 63 | |
| IKEA | 1 | Vans | 5 | |
| J.Crew | 1 | Verizon Wireless | 4 | |
| JCPenney | 3 | Victoria's Secret | 3 | |
| Jack In The Box | 8 | Vons | 5 | |
| Jamba Juice | 1 | Waffle House | 3 | |
| Jimmy John's | 2 | Walgreens | 11 | |
| JoS. A. Bank | 2 | Walmart | 7 | |
| Jones New York | 12 | Wendy's | 9 | |
| Journeys | 2 | Westin | 1 | |
| Justice | 5 | YMCA | 2 | |
Denton County on our top lists:
- #9 on the list of "Top 101 counties with the lowest number of deaths per 1000 residents 2007-2013 (pop. 50,000+)"
- #10 on the list of "Top 101 counties with the highest surface withdrawal of fresh water for public supply (pop. 50,000+)"
- #11 on the list of "Top 101 counties with the highest surface withdrawal of fresh water for public supply"
- #14 on the list of "Top 101 counties with the highest total withdrawal of fresh water for public supply (pop. 50,000+)"
- #15 on the list of "Top 101 counties with the highest total withdrawal of fresh water for public supply"
- #19 on the list of "Top 101 counties with the largest number of children under 18 without health insurance coverage in 2000 (pop. 50,000+)"
- #33 on the list of "Top 101 counties with the most Evangelical Protestant adherents"
- #33 on the list of "Top 101 counties with the most Evangelical Protestant adherents (pop. 50,000+)"
- #36 on the list of "Top 101 counties with the largest decrease in the number of births per 1000 residents 2000-2006 to 2007-2013 (pop 50,000+)"
- #46 on the list of "Top 101 counties with the lowest number of deaths per 1000 residents 2007-2013"
- #49 on the list of "Top 101 counties with the highest percentage of residents relocating from other counties between 2010 and 2011 (pop. 50,000+)"
- #59 on the list of "Top 101 counties with the lowest number of infant deaths per 1000 residents 2007-2013 (pop. 50,000+)"
- #60 on the list of "Top 101 counties with the largest number of people moving in compared to moving out (pop. 50,000+)"
- #68 on the list of "Top 101 counties with the most Evangelical Protestant congregations"
- #68 on the list of "Top 101 counties with the most Evangelical Protestant congregations (pop. 50,000+)"
- #81 on the list of "Top 101 counties with the highest percentage of residents relocating to other counties in 2011 (pop. 50,000+)"
- #81 on the list of "Top 101 counties with the largest number of children under 18 without health insurance coverage in 2000"
- #84 on the list of "Top 101 counties with the largest increase in the number of infant deaths per 1000 residents 2000-2006 to 2007-2013 (pop. 50,000+)"
- #89 on the list of "Top 101 counties with the lowest Nitrogen Dioxide air pollution readings in 2012 (ppm)"
- #94 on the list of "Top 101 counties with the largest increase in the number of deaths per 1000 residents 2000-2006 to 2007-2013 (pop. 50,000+)"