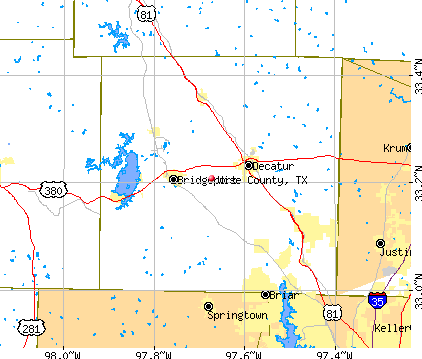
Wise County, Texas (TX)
County owner-occupied free and clear houses and condos in 2010: 6,360
County owner-occupied houses and condos in 2000: 13,974
Renter-occupied apartments: 4,374 (it was 3,204 in 2000)
| % of renters here: | 19% |
| State: | 36% |
Land area: 905 sq. mi.
Water area: 18.2 sq. mi.
Population density: 83 people per square mile (average).
Industries providing employment: Educational, health and social services (20.5%), Retail trade (12.6%).
Type of workers:
- Private wage or salary: 80%
- Government: 12%
- Self-employed, not incorporated: 8%
- Unpaid family work: 0%
- OSM Map
- General Map
- Google Map
- MSN Map

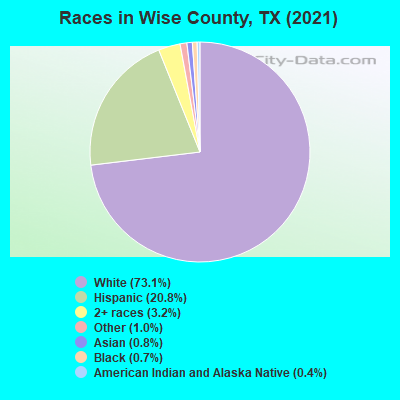
- 54,19672.4%White Non-Hispanic Alone
- 15,95221.3%Hispanic or Latino
- 2,6913.6%Two or more races
- 1,2221.6%Asian alone
- 5420.7%Black Non-Hispanic Alone
- 2920.4%American Indian and Alaska Native alone
| Median resident age: | 39.5 years |
| Texas median age: | 35.6 years |
| Males: 38,354 | |
| Females: 36,541 |

 | When will Sherman/Denison Be In DFW Metro? (66 replies) |
| Rural/country area, 20 mins to everyday retail, 80 mins to airport, no work commute (42 replies) |
| How much bigger will DFW population be? (57 replies) |
| DFW Neighborhood Scouting (38 replies) |
| One hour outside Dallas (31 replies) |
| 2020 DFW Census Results (7 replies) |
| Wise County: | 2.0 people |
| Texas: | 3 people |
Estimated median household income in 2022: $80,305 ($41,933 in 1999)
| This county: | $80,305 |
| Texas: | $72,284 |
Median contract rent in 2022 for apartments: $1,012 (lower quartile is $627, upper quartile is $1,163)
| This county: | $1012 |
| State: | $1117 |
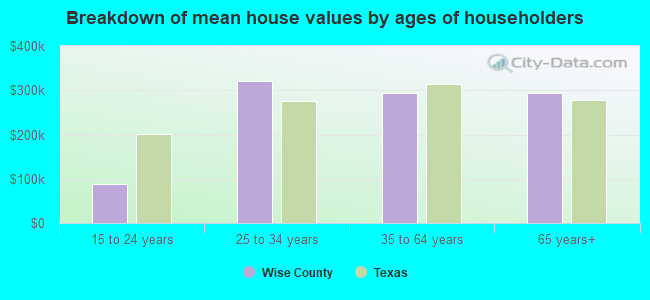
Estimated median house or condo value in 2022: $299,900 (it was $82,300 in 2000)
| Wise: | $299,900 |
| Texas: | $275,400 |
Median monthly housing costs for homes and condos with a mortgage: $1,792
Median monthly housing costs for units without a mortgage: $620
Institutionalized population: 980
Crime in 2021 (reported by the sheriff's office or county police, not the county total):
- Murders: 5
- Rapes: 25
- Robberies: 5
- Assaults: 44
- Burglaries: 9
- Thefts: 34
- Auto thefts: 1
Crime in 2020 (reported by the sheriff's office or county police, not the county total):
- Murders: 0
- Rapes: 21
- Robberies: 4
- Assaults: 67
- Burglaries: 94
- Thefts: 201
- Auto thefts: 47
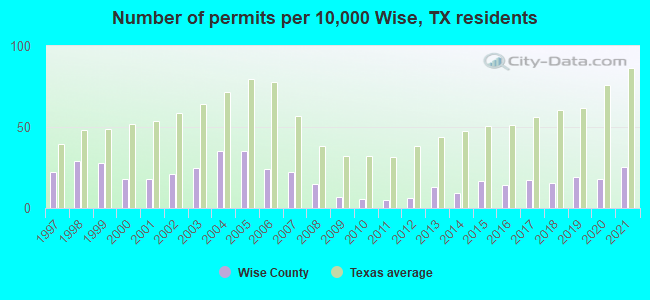
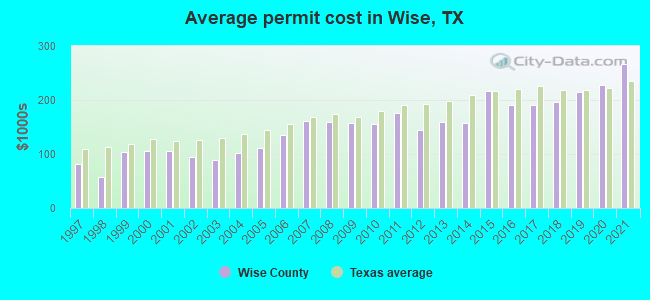
Single-family new house construction building permits:
- 2022: 198 buildings, average cost: $307,400
- 2021: 124 buildings, average cost: $266,500
- 2020: 88 buildings, average cost: $228,200
- 2019: 94 buildings, average cost: $215,300
- 2018: 76 buildings, average cost: $196,200
- 2017: 83 buildings, average cost: $191,100
- 2016: 70 buildings, average cost: $191,200
- 2015: 80 buildings, average cost: $216,300
- 2014: 46 buildings, average cost: $158,200
- 2013: 64 buildings, average cost: $158,800
- 2012: 29 buildings, average cost: $144,800
- 2011: 23 buildings, average cost: $176,200
- 2010: 26 buildings, average cost: $155,400
- 2009: 32 buildings, average cost: $158,200
- 2008: 72 buildings, average cost: $158,800
- 2007: 109 buildings, average cost: $162,300
- 2006: 116 buildings, average cost: $135,900
- 2005: 172 buildings, average cost: $111,600
- 2004: 173 buildings, average cost: $100,600
- 2003: 122 buildings, average cost: $88,100
- 2002: 103 buildings, average cost: $94,600
- 2001: 87 buildings, average cost: $104,800
- 2000: 88 buildings, average cost: $106,200
- 1999: 136 buildings, average cost: $103,900
- 1998: 141 buildings, average cost: $56,900
- 1997: 109 buildings, average cost: $80,500
Median real estate property taxes paid for housing units with mortgages in 2022: $3,727 (1.2%)
Median real estate property taxes paid for housing units with no mortgage in 2022: $2,475 (0.9%)
| Wise County: | 6.3% |
| Texas: | 14.0% |
Median age of residents in 2022: 39.5 years old
(Males: 39.9 years old, Females: 39.1 years old)
(Median age for: White residents: 41.8 years old, Black residents: 32.7 years old, American Indian residents: 52.3 years old, Asian residents: 35.3 years old, Hispanic or Latino residents: 28.7 years old, Other race residents: 15.2 years old)
Fair market rent in 2006 for a 1-bedroom apartment in Wise County is $443 a month.
Fair market rent for a 2-bedroom apartment is $533 a month.
Fair market rent for a 3-bedroom apartment is $651 a month.
Cities in this county include: Briar, Decatur, Bridgeport, Runaway Bay, Boyd, Alvord, Chico, Newark, New Fairview, Aurora.
Neighboring counties: Berkeley County, South Carolina  , Pinal County, Arizona
  , McCormick County, South Carolina , Marion County, Alabama .
| Here: | 3.1% |
| Texas: | 3.5% |
Current college students: 1,230
People 25 years of age or older with a high school degree or higher: 88.7%
People 25 years of age or older with a bachelor's degree or higher: 24.4%
Number of foreign born residents: 5,865 (38.6% naturalized citizens)
| Wise County: | 7.8% |
| Whole state: | 17.2% |
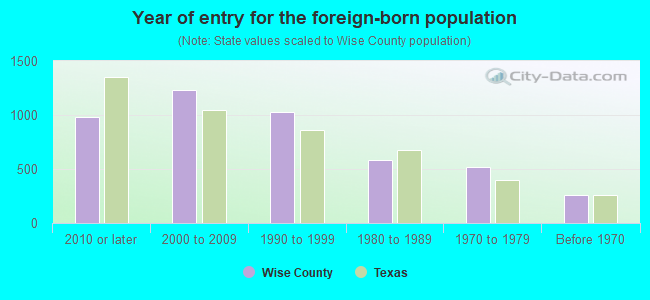
- Year of entry for the foreign-born population
- 1,1492010 or later
- 1,1922000 to 2009
- 1,1991990 to 1999
- 5801980 to 1989
- 5181970 to 1979
- 263Before 1970
Mean travel time to work (commute): minutes
Percentage of county residents living and working in this county: 99.0%
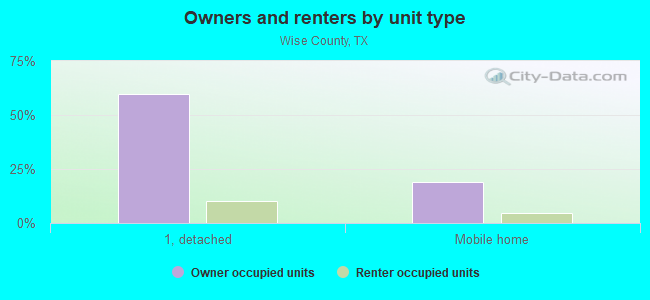
Housing units in structures:
- One, detached: 19,376
- One, attached: 264
- Two: 270
- 3 or 4: 278
- 5 to 9: 192
- 10 to 19: 206
- 20 to 49: 45
- 50 or more: 30
- Mobile homes: 6,684
- Boats, RVs, vans, etc.: 156
Housing units in Wise County with a mortgage: 11,408 (266 second mortgage, 9 home equity loan, 183 both second mortgage and home equity loan)
Houses without a mortgage: 185
| Here: | 5.6% with mortgage |
| State: | 98.4% with mortgage |
Religion statistics for Wise County
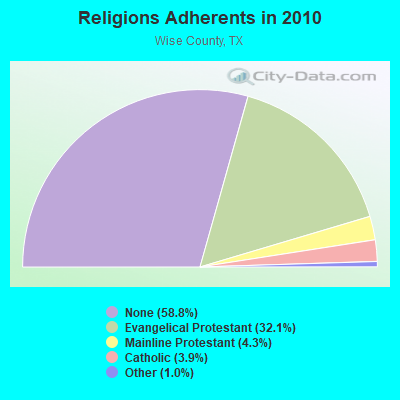
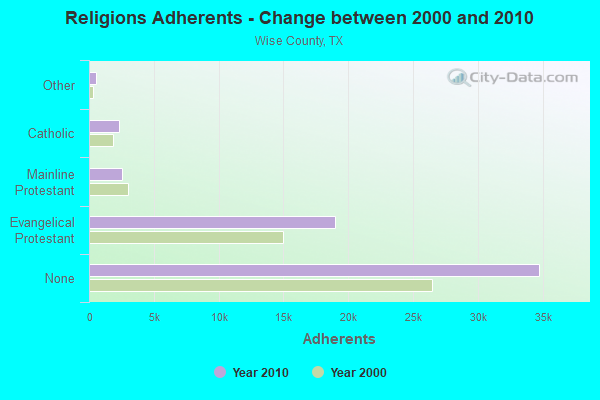
| Religion | Adherents | Congregations |
|---|---|---|
| Evangelical Protestant | 18,959 | 101 |
| Mainline Protestant | 2,572 | 11 |
| Catholic | 2,280 | 2 |
| Other | 568 | 1 |
| None | 34,748 | - |
Source: Clifford Grammich, Kirk Hadaway, Richard Houseal, Dale E.Jones, Alexei Krindatch, Richie Stanley and Richard H.Taylor. 2012. 2010 U.S.Religion Census: Religious Congregations & Membership Study. Association of Statisticians of American Religious Bodies. Jones, Dale E., et al. 2002. Congregations and Membership in the United States 2000. Nashville, TN: Glenmary Research Center.
Food Environment Statistics:
| Wise County: | 1.04 / 10,000 pop. |
| State: | 1.47 / 10,000 pop. |
| Here: | 0.17 / 10,000 pop. |
| Texas: | 0.14 / 10,000 pop. |
| This county: | 0.87 / 10,000 pop. |
| Texas: | 1.11 / 10,000 pop. |
| Wise County: | 5.22 / 10,000 pop. |
| Texas: | 3.95 / 10,000 pop. |
| This county: | 5.74 / 10,000 pop. |
| State: | 6.13 / 10,000 pop. |
| Wise County: | 8.5% |
| Texas: | 8.9% |
| Wise County: | 29.1% |
| State: | 26.6% |
| Here: | 15.1% |
| State: | 15.7% |
Agriculture in Wise County:
Average size of farms: 183 acresAverage value of agricultural products sold per farm: $12,352
Average value of crops sold per acre for harvested cropland: $89.11
The value of nursery, greenhouse, floriculture, and sod as a percentage of the total market value of agricultural products sold: 1.98%
The value of livestock, poultry, and their products as a percentage of the total market value of agricultural products sold: 77.29%
Average total farm production expenses per farm: $18,209
Harvested cropland as a percentage of land in farms: 17.21%
Irrigated harvested cropland as a percentage of land in farms: 1.59%
Average market value of all machinery and equipment per farm: $25,863
The percentage of farms operated by a family or individual: 95.77%
Average age of principal farm operators: 55 years
Average number of cattle and calves per 100 acres of all land in farms: 16.16
Milk cows as a percentage of all cattle and calves: 3.95%
Corn for grain: 709 harvested acres
All wheat for grain: 8430 harvested acres
Vegetables: 844 harvested acres
Land in orchards: 3,326 acres
Earthquake activity:
Wise County-area historical earthquake activity is significantly above Texas state average. It is 519% greater than the overall U.S. average.On 11/6/2011 at 03:53:10, a magnitude 5.7 (5.7 MW, Depth: 3.2 mi, Class: Moderate, Intensity: VI - VII) earthquake occurred 169.1 miles away from Wise County center
On 9/3/2016 at 12:02:44, a magnitude 5.8 (5.8 MW, Depth: 3.5 mi) earthquake occurred 226.6 miles away from the county center
On 6/16/1978 at 11:46:54, a magnitude 5.3 (4.4 MB, 4.6 UK, 5.3 ML) earthquake occurred 179.5 miles away from the county center
On 11/7/2016 at 01:44:24, a magnitude 5.0 (5.0 MW, Depth: 2.8 mi) earthquake occurred 198.9 miles away from the county center
On 11/8/2011 at 02:46:57, a magnitude 4.8 (4.8 MW, Depth: 3.1 mi, Class: Light, Intensity: IV - V) earthquake occurred 168.6 miles away from Wise County center
On 11/5/2011 at 07:12:45, a magnitude 4.8 (4.8 MW, Depth: 1.9 mi) earthquake occurred 170.3 miles away from the county center
Magnitude types: body-wave magnitude (MB), local magnitude (ML), moment magnitude (MW)
Most recent natural disasters:
- Texas Covid-19 Pandemic, Incident Period: January 20, 2020, FEMA Id: 4485, Natural disaster type: Other
- Texas Severe Storms, Tornadoes, Straight-line Winds, and Flooding, Incident Period: May 04, 2015 to June 23, 2015, Major Disaster (Presidential) Declared DR-4223: May 29, 2015, FEMA Id: 4223, Natural disaster type: Storm, Tornado, Flood, Wind
- Texas Wildfires, Incident Period: August 30, 2011 to December 31, 2011, Major Disaster (Presidential) Declared DR-4029: September 09, 2011, FEMA Id: 4029, Natural disaster type: Fire
- Texas Hurricane Ike, Incident Period: September 07, 2008 to September 26, 2008, Emergency Declared EM-3294: September 10, 2008, FEMA Id: 3294, Natural disaster type: Hurricane
- Texas Wildfires, Incident Period: March 14, 2008 to September 01, 2008, Emergency Declared EM-3284: March 14, 2008, FEMA Id: 3284, Natural disaster type: Fire
- Texas Severe Storms, Tornadoes, and Flooding, Incident Period: June 16, 2007 to August 03, 2007, Major Disaster (Presidential) Declared DR-1709: June 29, 2007, FEMA Id: 1709, Natural disaster type: Storm, Tornado, Flood
- Texas Extreme Wildfire Threat, Incident Period: November 27, 2005 to May 14, 2006, Major Disaster (Presidential) Declared DR-1624: January 11, 2006, FEMA Id: 1624, Natural disaster type: Fire
- Texas Hurricane Rita, Incident Period: September 23, 2005 to October 14, 2005, Major Disaster (Presidential) Declared DR-1606: September 24, 2005, FEMA Id: 1606, Natural disaster type: Hurricane
- Texas Hurricane Rita, Incident Period: September 20, 2005 to October 14, 2005, Emergency Declared EM-3261: September 21, 2005, FEMA Id: 3261, Natural disaster type: Hurricane
- Texas Hurricane Katrina, Incident Period: August 29, 2005 to October 01, 2005, Emergency Declared EM-3216: September 02, 2005, FEMA Id: 3216, Natural disaster type: Hurricane
- 8 other natural disasters have been reported since 1953.
The number of natural disasters in Wise County (18) is near the US average (15).
Major Disasters (Presidential) Declared: 9
Emergencies Declared: 7
Causes of natural disasters: Fires: 7, Storms: 6, Floods: 5, Hurricanes: 4, Tornadoes: 4, Wind: 1, Other: 1 (Note: some incidents may be assigned to more than one category).
Means of transportation to work:
- Drove a car alone: 19,826 (73.0%)
- Carpooled: 2,653 (9.8%)
- Taxicab, motorcycle, or other means: 238 (0.9%)
- Walked: 301 (1.1%)
- Worked at home: 4,193 (15.4%)
- Health care and social assistance (19%)
- Educational services (15%)
- Retail trade (12%)
- Accommodation and food services (10%)
- Professional, scientific, and technical services (7%)
- Public administration (4%)
- Other services, except public administration (3%)
- Health care and social assistance (23%)
- Educational services (18%)
- Retail trade (14%)
- Accommodation and food services (12%)
- Professional, scientific, and technical services (8%)
- Public administration (4%)
- Other services, except public administration (4%)
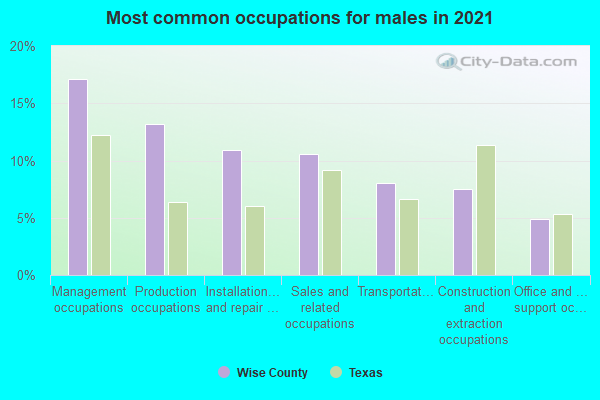
- Management occupations (13%)
- Production occupations (12%)
- Installation, maintenance, and repair occupations (9%)
- Transportation occupations (9%)
- Construction and extraction occupations (8%)
- Sales and related occupations (7%)
- Food preparation and serving related occupations (5%)
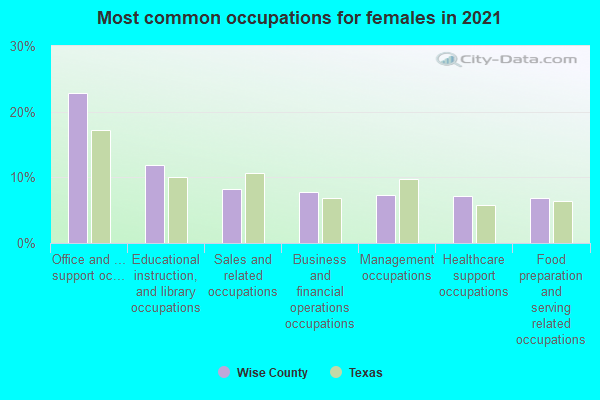
- Office and administrative support occupations (19%)
- Management occupations (12%)
- Educational instruction, and library occupations (11%)
- Food preparation and serving related occupations (11%)
- Sales and related occupations (7%)
- Health diagnosing and treating practitioners and other technical occupations (6%)
- Personal care and service occupations (6%)
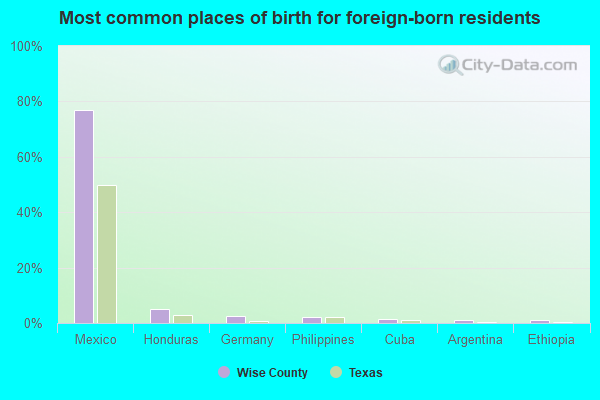
- Mexico (78%)
- Honduras (4%)
- Philippines (2%)
- India (1%)
- Vietnam (1%)
- Germany (1%)
- Argentina (1%)
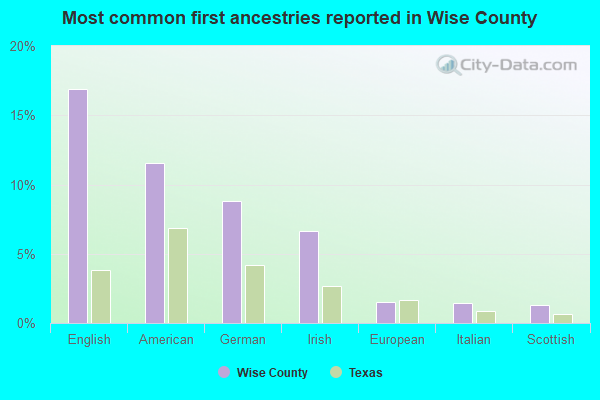
- English (18%)
- American (11%)
- German (9%)
- Irish (6%)
- Italian (1%)
- European (1%)
- Scottish (1%)
People in group quarters in Wise County, Texas in 2010:
- 746 people in state prisons
- 206 people in nursing facilities/skilled-nursing facilities
- 28 people in correctional facilities intended for juveniles
People in group quarters in Wise County, Texas in 2000:
- 518 people in state prisons
- 276 people in nursing homes
- 200 people in other types of correctional institutions
- 82 people in local jails and other confinement facilities (including police lockups)
- 39 people in other noninstitutional group quarters
- 24 people in hospitals/wards and hospices for chronically ill
- 24 people in hospices or homes for chronically ill
- 11 people in homes for the mentally ill
- 3 people in other nonhousehold living situations
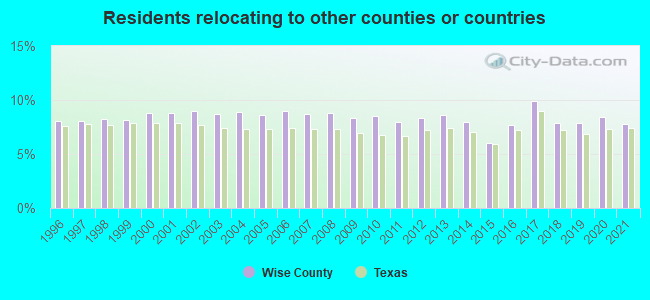
11.77% of this county's 2021 resident taxpayers lived in other counties in 2020 ($72,576 average adjusted gross income)
| Here: | 11.77% |
| Texas average: | 8.12% |
10 or fewer of this county's residents moved from foreign countries.
9.76% relocated from other counties in Texas ($59,782 average AGI)
2.01% relocated from other states ($12,794 average AGI)
Wise County: 2.01% Texas average: 2.83%

Top counties from which taxpayers relocated into this county between 2020 and 2021:
| from Tarrant County, TX | |
| from Denton County, TX | |
| from Parker County, TX | |
| from Dallas County, TX | |
| from Montague County, TX | |
| from Collin County, TX | |
| from Johnson County, TX |
7.80% of this county's 2020 resident taxpayers moved to other counties in 2021 ($54,334 average adjusted gross income)
| Here: | 7.80% |
| Texas average: | 7.40% |
10 or fewer of this county's residents moved to foreign countries.
6.35% relocated to other counties in Texas ($45,473 average AGI)
1.45% relocated to other states ($8,861 average AGI)
Wise County: 1.45% Texas average: 2.08%
Top counties to which taxpayers relocated from this county between 2020 and 2021:
| to Tarrant County, TX | |
| to Denton County, TX | |
| to Parker County, TX | |
| to Montague County, TX | |
| to Dallas County, TX | |
| to Jack County, TX | |
| to Collin County, TX |
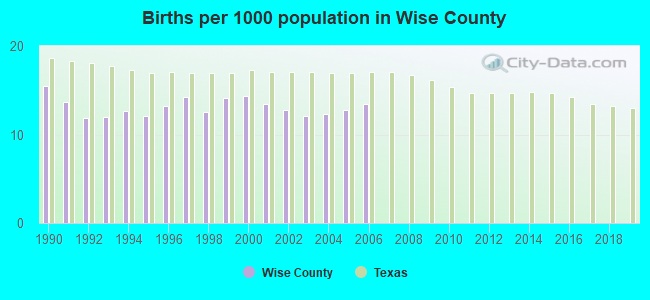
Births per 1000 population from 1990 to 1999: 13.2
Births per 1000 population from 2000 to 2006: 13.0
Deaths per 1000 population from 1990 to 1999: 8.7
Deaths per 1000 population from 2000 to 2009: 8.1
Deaths per 1000 population from 2010 to 2020: 9.0
Infant deaths per 1000 live births from 1990 to 1999: 6.1
Infant deaths per 1000 live births from 2000 to 2006: 6.8
Persons under 19 years old without health insurance coverage in 2018: 13.6%
Persons enrolled in hospital insurance and/or supplemental medical insurance (Medicare) in July 1, 2007: 7,088 (6,017 aged, 1,071 disabled)
Children under 18 without health insurance coverage in 2007: 2,932 (20%)
Most common underlying causes of death in Wise County, Texas in 1999 - 2019:
- Bronchus or lung, unspecified - Malignant neoplasms (745)
- Acute myocardial infarction, unspecified (683)
- Atherosclerotic heart disease (576)
- Chronic obstructive pulmonary disease, unspecified (539)
- Alzheimer disease, unspecified (301)
- Stroke, not specified as haemorrhage or infarction (301)
- Congestive heart failure (297)
- Unspecified dementia (278)
- Atherosclerotic cardiovascular disease, so described (123)
- Senile degeneration of brain, not elsewhere classified (74)
Population without health insurance coverage in 2000: 15%
Children under 18 without health insurance coverage in 2000: 15%
Short term general hospital admissions per 100,000 population in 2004: 7,389
Short term general hospital beds per 100,000 population in 2004: 153
Emergency room visits per 100,000 population in 2004: 35,087
General practice office based MDs per 100,000 population in 2005: 1,213
Medical specialist MDs per 100,000 population in 2005: 806
Dentists per 100,000 population in 1998: 7
Total births per 100,000 population, July 2005 - July 2006 : 20
Total deaths per 100,000 population, July 2005 - July 2006: 56
Limited-service eating places per 100,000 population in 2005 : 11
Suicides per 1,000,000 population from 2000 to 2006: 117.8. This is more than state average.
- Firearm - 85.7
- Other - 32.1
Household type by relationship:
Households: 74,895- Male householders: 12,600 (3,205 living alone), Female householders: 12,830 (2,035 living alone)
15,831 spouses (15,747 opposite-sex spouses), 1,133 unmarried partners, (969 opposite-sex unmarried partners), 23,588 children (21,390 natural, 1,156 adopted, 1,042 stepchildren), 2,270 grandchildren, 446 brothers or sisters, 2,079 parents, 115 foster children, 1,236 other relatives, 1,665 non-relatives
- In group quarters: 1,102
Size of family households: 6,871 2-persons, 4,170 3-persons, 4,249 4-persons, 2,483 5-persons, 564 6-persons, 489 7-or-more-persons.
Size of nonfamily households: 5,240 1-person, 1,048 2-persons, 233 3-persons, 83 4-persons.
10,817 married couples with children.
3,585 single-parent households (1,196 men, 2,389 women).
83.5% of residents of Wise speak English at home.
15.0% of residents speak Spanish at home (59% speak English very well, 18% speak English well, 16% speak English not well, 6% don't speak English at all).
0.7% of residents speak other Indo-European language at home (86% speak English very well, 9% speak English well, 5% don't speak English at all).
0.6% of residents speak Asian or Pacific Island language at home (78% speak English very well, 9% speak English well, 13% speak English not well).
In fiscal year 2004:
Federal Government expenditure: $176,576,000 ($3,179 per capita)
Department of Defense expenditure: $8,077,000
Federal direct payments to individuals for retirement and disability: $96,967,000
Federal other direct payments to individuals: $35,904,000
Federal direct payments not to individuals: $504,000
Federal grants: $33,197,000
Federal procurement contracts: $3,091,000 ($1,500,000 Department of Defense)
Federal salaries and wages: $6,913,000 ($223,000 Department of Defense)
Federal Government direct loans: $641,000
Federal guaranteed/insured loans: $28,174,000
Federal Government insurance: $27,574,000
Population change from April 1, 2000 to July 1, 2005:
Births: 3,499| Here: | 62 per 1000 residents |
| State: | 85 per 1000 residents |
Deaths: 2,249
| Here: | 40 per 1000 residents |
| State: | 35 per 1000 residents |
Net international migration: +558
| Here: | +10 per 1000 residents |
| State: | +29 per 1000 residents |
Net internal migration: +6,174
| Here: | +109 per 1000 residents |
| State: | +10 per 1000 residents |
Total withdrawal of fresh water for public supply: 4.37 millions of gallons per day (17% from ground, 83% from surface)
| Here: | 6.2 |
| State: | 6.3 |
| Here: | 4.6 |
| State: | 4.0 |
- Year house built in Wise County, Texas
- 1,2462020 or later
- 5,7282010 to 2019
- 5,4752000 to 2009
- 4,3601990 to 1999
- 3,4321980 to 1989
- 2,8371970 to 1979
- 1,5611960 to 1969
- 1,2521950 to 1959
- 7521940 to 1949
- 8061939 or earlier
- Rooms in owner-occupied houses in Wise County, Texas
- 2761 room
- 2032 rooms
- 6273 rooms
- 1,7344 rooms
- 4,1925 rooms
- 5,4506 rooms
- 3,6887 rooms
- 2,7268 rooms
- 2,3159+ rooms
- Rooms in renter-occupied apartments in Wise County, Texas
- 4031 room
- 2092 rooms
- 3823 rooms
- 1,0264 rooms
- 1,5425 rooms
- 2686 rooms
- 1107 rooms
- 1488 rooms
- 1319+ rooms
- Bedrooms in owner-occupied houses in Wise County, Texas
- 276no bedroom
- 3551 bedroom
- 2,3822 bedrooms
- 12,2593 bedrooms
- 5,5364 bedrooms
- 4035+ bedrooms
- Bedrooms in renter-occupied apartments in Wise County, Texas
- 461no bedroom
- 2951 bedroom
- 1,0632 bedrooms
- 2,1643 bedrooms
- 1234 bedrooms
- 1135+ bedrooms
- Cars and other vehicles available in Wise County in owner-occupied houses/condos
- 422no vehicle
- 3,8181 vehicle
- 7,8592 vehicles
- 6,0073 vehicles
- 2,1894 vehicles
- 9165+ vehicles
- Cars and other vehicles available in Wise County in renter-occupied apartments
- 117no vehicle
- 1,9681 vehicle
- 1,9252 vehicles
- 1923 vehicles
- 174 vehicles
- 05+ vehicles
88.8% of Wise County residents lived in the same house 1 years ago.
Out of people who lived in different houses, 22% lived in this county.
Out of people who lived in different counties, 85% lived in Texas.
| Wise County: | 88.8% |
| State average: | 85.7% |
Place of birth for U.S.-born residents:
- This state: 49,295
- Other state: 17,972
- Northeast: 2,187
- Midwest: 4,287
- South: 4,440
- West: 7,058
- 73.7%Electricity
- 14.1%Bottled, tank, or LP gas
- 10.3%Utility gas
- 1.2%Wood
- 0.2%Other fuel
- 0.2%No fuel used
- 0.2%Solar energy
- 71.2%Electricity
- 16.3%Utility gas
- 9.1%Bottled, tank, or LP gas
- 1.7%Wood
- 1.1%No fuel used
- 0.4%Other fuel
- 0.2%Coal or coke
Private vs. public school enrollment:
| Here: | 11.1% |
| Texas: | 8.8% |
| Here: | 2.8% |
| Texas: | 8.0% |
| Here: | 47.2% |
| Texas: | 16.2% |
Wise County government finances - Expenditure in 2017:
- Bond Funds - Cash and Securities: $9,263,000
Cash and Securities: $8,500,000
- Charges - Other: $5,898,000
Other: $5,519,000
Solid Waste Management: $623,000
Solid Waste Management: $599,000
- Construction - Regular Highways: $1,701,000
Police Protection: $408,000
Natural Resources - Other: $169,000
Health - Other: $101,000
- Current Operations - Police Protection: $13,363,000
Regular Highways: $7,178,000
General - Other: $6,491,000
Judicial and Legal Services: $6,180,000
General - Other: $6,071,000
Judicial and Legal Services: $5,741,000
Regular Highways: $5,539,000
Police Protection: $5,018,000
Central Staff Services: $4,886,000
Local Fire Protection: $4,488,000
Health - Other: $4,060,000
Correctional Institutions: $3,952,000
Central Staff Services: $3,563,000
Financial Administration: $2,502,000
General Public Buildings: $2,454,000
Corrections - Other: $2,386,000
Financial Administration: $2,194,000
Solid Waste Management: $1,402,000
Health - Other: $1,305,000
General Public Buildings: $1,099,000
Local Fire Protection: $1,030,000
Public Welfare - Other: $533,000
Solid Waste Management: $521,000
Parks and Recreation: $418,000
Public Welfare, Vendor Payments for Medical Care: $359,000
Libraries: $311,000
Natural Resources - Other: $293,000
Natural Resources - Other: $290,000
Libraries: $182,000
Parks and Recreation: $96,000
- Federal Intergovernmental - Other: $236,000
- General - Interest on Debt: $2,521,000
Interest on Debt: $147,000
- Long Term Debt - Beginning Outstanding - Unspecified Public Purpose: $40,395,000
Outstanding Unspecified Public Purpose: $37,255,000
Beginning Outstanding - Unspecified Public Purpose: $3,676,000
Retired Unspecified Public Purpose: $3,140,000
Outstanding Unspecified Public Purpose: $3,096,000
Retired Unspecified Public Purpose: $580,000
- Miscellaneous - Royalties: $2,689,000
Royalties: $2,608,000
General Revenue - Other: $1,431,000
Fines and Forfeits: $1,048,000
General Revenue - Other: $853,000
Interest Earnings: $788,000
Fines and Forfeits: $742,000
Sale of Property: $203,000
Sale of Property: $136,000
Interest Earnings: $97,000
Rents: $17,000
Donations From Private Sources: $11,000
- Other Capital Outlay - Health - Other: $304,000
Financial Administration: $213,000
General - Other: $168,000
Regular Highways: $164,000
Correctional Institutions: $31,000
Central Staff Services: $17,000
Police Protection: $7,000
- Other Funds - Cash and Securities: $24,763,000
Cash and Securities: $16,051,000
- Short Term Debt Outstanding - Beginning: $3,020,000
- Sinking Funds - Cash and Securities: $2,871,000
Cash and Securities: $2,500,000
- State Intergovernmental - Highways: $1,763,000
Other: $1,520,000
General Local Government Support: $638,000
Other: $543,000
General Local Government Support: $389,000
Highways: $120,000
Health and Hospitals: $52,000
- Tax - Property: $32,090,000
Property: $29,269,000
General Sales and Gross Receipts: $4,604,000
General Sales and Gross Receipts: $3,646,000
Motor Vehicle License: $1,358,000
Motor Vehicle License: $1,315,000
- Total Salaries and Wages: $8,401,000
Wise County government finances - Revenue in 2017:
- Bond Funds - Cash and Securities: $9,263,000
Cash and Securities: $8,500,000
- Charges - Other: $5,898,000
Other: $5,519,000
Solid Waste Management: $623,000
Solid Waste Management: $599,000
- Construction - Regular Highways: $1,701,000
Police Protection: $408,000
Natural Resources - Other: $169,000
Health - Other: $101,000
- Current Operations - Police Protection: $13,363,000
Regular Highways: $7,178,000
General - Other: $6,491,000
Judicial and Legal Services: $6,180,000
General - Other: $6,071,000
Judicial and Legal Services: $5,741,000
Regular Highways: $5,539,000
Police Protection: $5,018,000
Central Staff Services: $4,886,000
Local Fire Protection: $4,488,000
Health - Other: $4,060,000
Correctional Institutions: $3,952,000
Central Staff Services: $3,563,000
Financial Administration: $2,502,000
General Public Buildings: $2,454,000
Corrections - Other: $2,386,000
Financial Administration: $2,194,000
Solid Waste Management: $1,402,000
Health - Other: $1,305,000
General Public Buildings: $1,099,000
Local Fire Protection: $1,030,000
Public Welfare - Other: $533,000
Solid Waste Management: $521,000
Parks and Recreation: $418,000
Public Welfare, Vendor Payments for Medical Care: $359,000
Libraries: $311,000
Natural Resources - Other: $293,000
Natural Resources - Other: $290,000
Libraries: $182,000
Parks and Recreation: $96,000
- Federal Intergovernmental - Other: $236,000
- General - Interest on Debt: $2,521,000
Interest on Debt: $147,000
- Long Term Debt - Beginning Outstanding - Unspecified Public Purpose: $40,395,000
Outstanding Unspecified Public Purpose: $37,255,000
Beginning Outstanding - Unspecified Public Purpose: $3,676,000
Retired Unspecified Public Purpose: $3,140,000
Outstanding Unspecified Public Purpose: $3,096,000
Retired Unspecified Public Purpose: $580,000
- Miscellaneous - Royalties: $2,689,000
Royalties: $2,608,000
General Revenue - Other: $1,431,000
Fines and Forfeits: $1,048,000
General Revenue - Other: $853,000
Interest Earnings: $788,000
Fines and Forfeits: $742,000
Sale of Property: $203,000
Sale of Property: $136,000
Interest Earnings: $97,000
Rents: $17,000
Donations From Private Sources: $11,000
- Other Capital Outlay - Health - Other: $304,000
Financial Administration: $213,000
General - Other: $168,000
Regular Highways: $164,000
Correctional Institutions: $31,000
Central Staff Services: $17,000
Police Protection: $7,000
- Other Funds - Cash and Securities: $24,763,000
Cash and Securities: $16,051,000
- Short Term Debt Outstanding - Beginning: $3,020,000
- Sinking Funds - Cash and Securities: $2,871,000
Cash and Securities: $2,500,000
- State Intergovernmental - Highways: $1,763,000
Other: $1,520,000
General Local Government Support: $638,000
Other: $543,000
General Local Government Support: $389,000
Highways: $120,000
Health and Hospitals: $52,000
- Tax - Property: $32,090,000
Property: $29,269,000
General Sales and Gross Receipts: $4,604,000
General Sales and Gross Receipts: $3,646,000
Motor Vehicle License: $1,358,000
Motor Vehicle License: $1,315,000
- Total Salaries and Wages: $8,401,000
Wise County government finances - Debt in 2017:
- Bond Funds - Cash and Securities: $9,263,000
Cash and Securities: $8,500,000
- Charges - Other: $5,898,000
Other: $5,519,000
Solid Waste Management: $623,000
Solid Waste Management: $599,000
- Construction - Regular Highways: $1,701,000
Police Protection: $408,000
Natural Resources - Other: $169,000
Health - Other: $101,000
- Current Operations - Police Protection: $13,363,000
Regular Highways: $7,178,000
General - Other: $6,491,000
Judicial and Legal Services: $6,180,000
General - Other: $6,071,000
Judicial and Legal Services: $5,741,000
Regular Highways: $5,539,000
Police Protection: $5,018,000
Central Staff Services: $4,886,000
Local Fire Protection: $4,488,000
Health - Other: $4,060,000
Correctional Institutions: $3,952,000
Central Staff Services: $3,563,000
Financial Administration: $2,502,000
General Public Buildings: $2,454,000
Corrections - Other: $2,386,000
Financial Administration: $2,194,000
Solid Waste Management: $1,402,000
Health - Other: $1,305,000
General Public Buildings: $1,099,000
Local Fire Protection: $1,030,000
Public Welfare - Other: $533,000
Solid Waste Management: $521,000
Parks and Recreation: $418,000
Public Welfare, Vendor Payments for Medical Care: $359,000
Libraries: $311,000
Natural Resources - Other: $293,000
Natural Resources - Other: $290,000
Libraries: $182,000
Parks and Recreation: $96,000
- Federal Intergovernmental - Other: $236,000
- General - Interest on Debt: $2,521,000
Interest on Debt: $147,000
- Long Term Debt - Beginning Outstanding - Unspecified Public Purpose: $40,395,000
Outstanding Unspecified Public Purpose: $37,255,000
Beginning Outstanding - Unspecified Public Purpose: $3,676,000
Retired Unspecified Public Purpose: $3,140,000
Outstanding Unspecified Public Purpose: $3,096,000
Retired Unspecified Public Purpose: $580,000
- Miscellaneous - Royalties: $2,689,000
Royalties: $2,608,000
General Revenue - Other: $1,431,000
Fines and Forfeits: $1,048,000
General Revenue - Other: $853,000
Interest Earnings: $788,000
Fines and Forfeits: $742,000
Sale of Property: $203,000
Sale of Property: $136,000
Interest Earnings: $97,000
Rents: $17,000
Donations From Private Sources: $11,000
- Other Capital Outlay - Health - Other: $304,000
Financial Administration: $213,000
General - Other: $168,000
Regular Highways: $164,000
Correctional Institutions: $31,000
Central Staff Services: $17,000
Police Protection: $7,000
- Other Funds - Cash and Securities: $24,763,000
Cash and Securities: $16,051,000
- Short Term Debt Outstanding - Beginning: $3,020,000
- Sinking Funds - Cash and Securities: $2,871,000
Cash and Securities: $2,500,000
- State Intergovernmental - Highways: $1,763,000
Other: $1,520,000
General Local Government Support: $638,000
Other: $543,000
General Local Government Support: $389,000
Highways: $120,000
Health and Hospitals: $52,000
- Tax - Property: $32,090,000
Property: $29,269,000
General Sales and Gross Receipts: $4,604,000
General Sales and Gross Receipts: $3,646,000
Motor Vehicle License: $1,358,000
Motor Vehicle License: $1,315,000
- Total Salaries and Wages: $8,401,000
Wise County government finances - Cash and Securities in 2017:
- Bond Funds - Cash and Securities: $9,263,000
Cash and Securities: $8,500,000
- Charges - Other: $5,898,000
Other: $5,519,000
Solid Waste Management: $623,000
Solid Waste Management: $599,000
- Construction - Regular Highways: $1,701,000
Police Protection: $408,000
Natural Resources - Other: $169,000
Health - Other: $101,000
- Current Operations - Police Protection: $13,363,000
Regular Highways: $7,178,000
General - Other: $6,491,000
Judicial and Legal Services: $6,180,000
General - Other: $6,071,000
Judicial and Legal Services: $5,741,000
Regular Highways: $5,539,000
Police Protection: $5,018,000
Central Staff Services: $4,886,000
Local Fire Protection: $4,488,000
Health - Other: $4,060,000
Correctional Institutions: $3,952,000
Central Staff Services: $3,563,000
Financial Administration: $2,502,000
General Public Buildings: $2,454,000
Corrections - Other: $2,386,000
Financial Administration: $2,194,000
Solid Waste Management: $1,402,000
Health - Other: $1,305,000
General Public Buildings: $1,099,000
Local Fire Protection: $1,030,000
Public Welfare - Other: $533,000
Solid Waste Management: $521,000
Parks and Recreation: $418,000
Public Welfare, Vendor Payments for Medical Care: $359,000
Libraries: $311,000
Natural Resources - Other: $293,000
Natural Resources - Other: $290,000
Libraries: $182,000
Parks and Recreation: $96,000
- Federal Intergovernmental - Other: $236,000
- General - Interest on Debt: $2,521,000
Interest on Debt: $147,000
- Long Term Debt - Beginning Outstanding - Unspecified Public Purpose: $40,395,000
Outstanding Unspecified Public Purpose: $37,255,000
Beginning Outstanding - Unspecified Public Purpose: $3,676,000
Retired Unspecified Public Purpose: $3,140,000
Outstanding Unspecified Public Purpose: $3,096,000
Retired Unspecified Public Purpose: $580,000
- Miscellaneous - Royalties: $2,689,000
Royalties: $2,608,000
General Revenue - Other: $1,431,000
Fines and Forfeits: $1,048,000
General Revenue - Other: $853,000
Interest Earnings: $788,000
Fines and Forfeits: $742,000
Sale of Property: $203,000
Sale of Property: $136,000
Interest Earnings: $97,000
Rents: $17,000
Donations From Private Sources: $11,000
- Other Capital Outlay - Health - Other: $304,000
Financial Administration: $213,000
General - Other: $168,000
Regular Highways: $164,000
Correctional Institutions: $31,000
Central Staff Services: $17,000
Police Protection: $7,000
- Other Funds - Cash and Securities: $24,763,000
Cash and Securities: $16,051,000
- Short Term Debt Outstanding - Beginning: $3,020,000
- Sinking Funds - Cash and Securities: $2,871,000
Cash and Securities: $2,500,000
- State Intergovernmental - Highways: $1,763,000
Other: $1,520,000
General Local Government Support: $638,000
Other: $543,000
General Local Government Support: $389,000
Highways: $120,000
Health and Hospitals: $52,000
- Tax - Property: $32,090,000
Property: $29,269,000
General Sales and Gross Receipts: $4,604,000
General Sales and Gross Receipts: $3,646,000
Motor Vehicle License: $1,358,000
Motor Vehicle License: $1,315,000
- Total Salaries and Wages: $8,401,000
Supplemental Security Income (SSI) in 2006:
- Total number of recipients: 656
- Number of aged recipients: 108
- Number of blind and disabled recipients: 548
- Number of recipients under 18: 95
- Number of recipients between 18 and 64: 405
- Number of recipients older than 64: 156
- Number of recipients also receiving OASDI: 244
- Amount of payments (thousands of dollars): 264
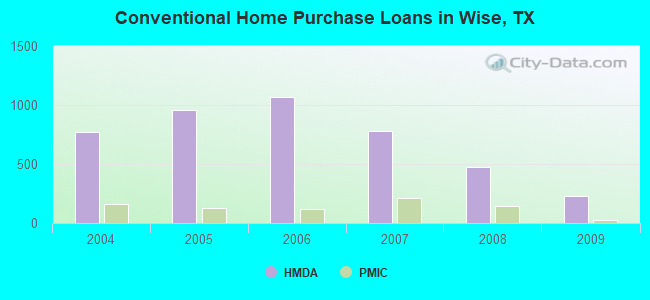
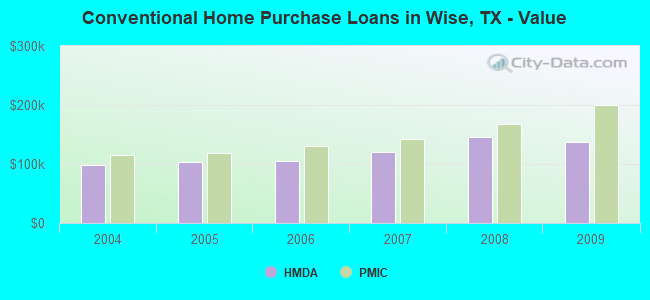
| Home Mortgage Disclosure Act Aggregated Statistics For Year 2009 (Based on 11 full tracts) | ||||||||||||||
| A) FHA, FSA/RHS & VA Home Purchase Loans | B) Conventional Home Purchase Loans | C) Refinancings | D) Home Improvement Loans | E) Loans on Dwellings For 5+ Families | F) Non-occupant Loans on < 5 Family Dwellings (A B C & D) | G) Loans On Manufactured Home Dwelling (A B C & D) | ||||||||
|---|---|---|---|---|---|---|---|---|---|---|---|---|---|---|
| Number | Average Value | Number | Average Value | Number | Average Value | Number | Average Value | Number | Average Value | Number | Average Value | Number | Average Value | |
| LOANS ORIGINATED | 220 | $140,591 | 229 | $137,908 | 606 | $171,708 | 68 | $42,441 | 1 | $5,265,000 | 103 | $129,748 | 85 | $70,753 |
| APPLICATIONS APPROVED, NOT ACCEPTED | 17 | $139,000 | 18 | $88,556 | 64 | $141,906 | 14 | $50,286 | 0 | $0 | 5 | $107,200 | 21 | $70,762 |
| APPLICATIONS DENIED | 48 | $143,458 | 45 | $115,689 | 289 | $180,602 | 94 | $34,351 | 0 | $0 | 17 | $93,882 | 49 | $54,408 |
| APPLICATIONS WITHDRAWN | 15 | $151,733 | 38 | $170,026 | 176 | $153,097 | 35 | $77,429 | 0 | $0 | 8 | $117,750 | 23 | $59,478 |
| FILES CLOSED FOR INCOMPLETENESS | 7 | $146,571 | 12 | $165,750 | 70 | $133,514 | 26 | $54,615 | 0 | $0 | 6 | $103,667 | 19 | $74,526 |
| Private Mortgage Insurance Companies Aggregated Statistics For Year 2009 (Based on 11 full tracts) | ||||||||
| A) Conventional Home Purchase Loans | B) Refinancings | C) Non-occupant Loans on < 5 Family Dwellings (A & B) | D) Loans On Manufactured Home Dwelling (A & B) | |||||
|---|---|---|---|---|---|---|---|---|
| Number | Average Value | Number | Average Value | Number | Average Value | Number | Average Value | |
| LOANS ORIGINATED | 24 | $200,792 | 24 | $218,583 | 1 | $178,000 | 0 | $0 |
| APPLICATIONS APPROVED, NOT ACCEPTED | 12 | $201,000 | 10 | $248,300 | 2 | $159,500 | 2 | $109,000 |
| APPLICATIONS DENIED | 4 | $179,500 | 10 | $213,000 | 2 | $166,000 | 0 | $0 |
| APPLICATIONS WITHDRAWN | 0 | $0 | 3 | $217,333 | 0 | $0 | 0 | $0 |
| FILES CLOSED FOR INCOMPLETENESS | 1 | $235,000 | 2 | $185,500 | 0 | $0 | 0 | $0 |
| Most common first names in Wise County, TX among deceased individuals | ||
| Name | Count | Lived (average) |
|---|---|---|
| James | 331 | 71.8 years |
| Mary | 301 | 78.7 years |
| William | 283 | 75.2 years |
| John | 267 | 75.2 years |
| Robert | 210 | 72.2 years |
| Charles | 145 | 71.7 years |
| George | 134 | 74.4 years |
| Thomas | 102 | 74.0 years |
| Joe | 95 | 72.3 years |
| Ruby | 93 | 79.9 years |
| Most common last names in Wise County, TX among deceased individuals | ||
| Last name | Count | Lived (average) |
|---|---|---|
| Smith | 177 | 75.2 years |
| Brown | 122 | 79.0 years |
| Jones | 88 | 72.9 years |
| Williams | 85 | 74.6 years |
| Taylor | 82 | 73.7 years |
| Davis | 80 | 73.2 years |
| Walker | 56 | 75.2 years |
| Wilson | 56 | 70.0 years |
| Thompson | 55 | 74.5 years |
| Martin | 54 | 74.3 years |
| Businesses in Wise County, TX | ||||
| Name | Count | Name | Count | |
|---|---|---|---|---|
| AT&T | 3 | Knights Inn | 1 | |
| Ace Hardware | 1 | La Quinta | 2 | |
| Arby's | 1 | Lane Furniture | 1 | |
| AutoZone | 2 | Lowe's | 1 | |
| Baymont Inn | 2 | McDonald's | 3 | |
| Best Western | 1 | Pizza Hut | 2 | |
| Blockbuster | 1 | Quiznos | 1 | |
| Burger King | 1 | RadioShack | 2 | |
| Chevrolet | 1 | Ramada | 1 | |
| Comfort Inn | 1 | SONIC Drive-In | 2 | |
| Dairy Queen | 1 | Sears | 1 | |
| FedEx | 8 | Sprint Nextel | 1 | |
| Ford | 1 | Starbucks | 1 | |
| H&R Block | 3 | Subway | 6 | |
| Hilton | 1 | Taco Bell | 1 | |
| Holiday Inn | 2 | U-Haul | 5 | |
| IHOP | 1 | UPS | 5 | |
| Jack In The Box | 1 | Walmart | 1 | |
| Jones New York | 1 | Wendy's | 1 | |