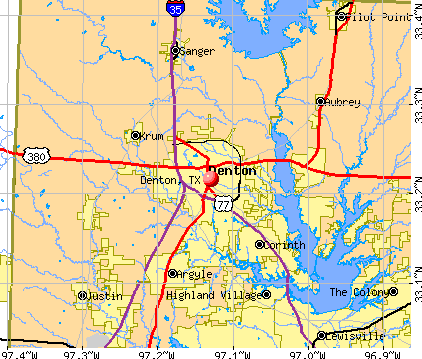
Denton, Texas
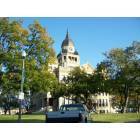
Denton: Denton County Courthouse
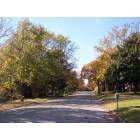
Denton: South Denton

Denton: After Snow - The Administration Building at University of North Texas, in Denton, TX
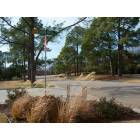
Denton: Archer Trail - North Denton
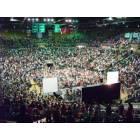
Denton: Revival at UNT Superpit
Denton: South Lakes Park - Spring 2006

Denton: South Lakes Park - Spring 2006

Denton: Civil War Monument
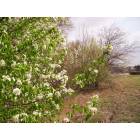
Denton: South Lakes Park - Spring 2006

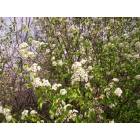
Denton: South Lakes Park - Spring 2006

Denton: South Lakes Park - Spring 2006
- see
54
more - add
your
Submit your own pictures of this city and show them to the world
- OSM Map
- General Map
- Google Map
- MSN Map
Population change since 2000: +86.7%
| Males: 74,658 | |
| Females: 75,695 |
| Median resident age: | 32.4 years |
| Texas median age: | 35.6 years |
Zip codes: 76201, 76205, 76207, 76209, 76249, 76259, 76266.
Denton Zip Code Map| Denton: | $71,711 |
| TX: | $72,284 |
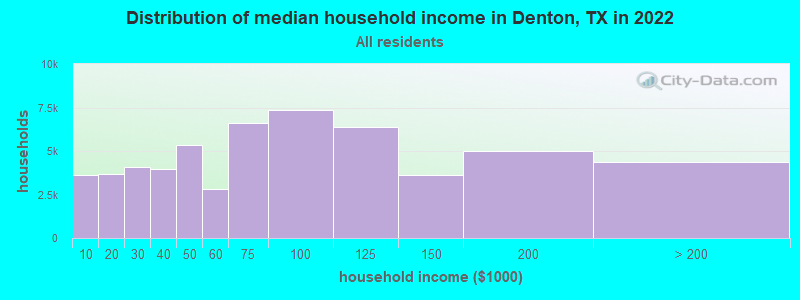
Estimated per capita income in 2022: $38,503 (it was $19,365 in 2000)
Denton city income, earnings, and wages data
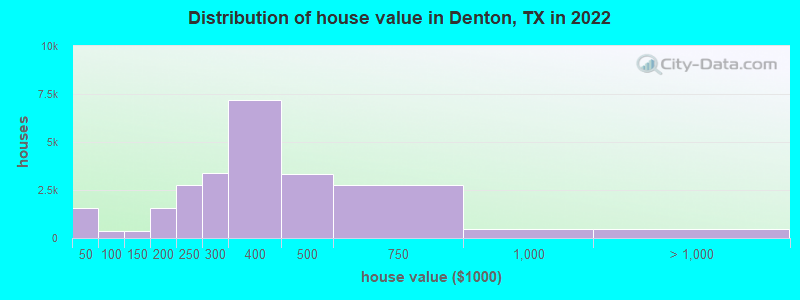
Estimated median house or condo value in 2022: $332,200 (it was $98,600 in 2000)
| Denton: | $332,200 |
| TX: | $275,400 |
Mean prices in 2022: all housing units: $292,882; detached houses: $304,338; townhouses or other attached units: $232,188; in 2-unit structures: $372,107; in 5-or-more-unit structures: $170,509; mobile homes: $25,674
Median gross rent in 2022: $1,271.
(14.8% for White Non-Hispanic residents, 20.3% for Black residents, 16.2% for Hispanic or Latino residents, 8.1% for American Indian residents, 33.3% for Native Hawaiian and other Pacific Islander residents, 18.3% for other race residents, 19.9% for two or more races residents)
Detailed information about poverty and poor residents in Denton, TX


Compare current foreclosures in Denton, TX:
| Photo | Address | Area | Beds / Baths | Price | Details |
|---|---|---|---|---|---|

|
#1
Demarsh Lane
Denton, TX 76210
|
3,576 sq. feet
|
3 baths 4 beds |
$589,900
|
show details |

|
#2
E Hickory St
Denton, TX 76205
|
989 sq. feet
|
1 baths 2 beds |
show details | |

|
#3
Desert Dr
Denton, TX 76210
|
2,917 sq. feet
|
2 baths 4 beds |
show details | |

|
#4
Harvest Moon Trl
Denton, TX 76210
|
1,892 sq. feet
|
2 baths 3 beds |
show details | |

|
#5
N Haven Dr
Denton, TX 76210
|
1,476 sq. feet
|
2 baths 3 beds |
show details | |

|
#6
Chevelly Ct
Denton, TX 76209
|
2,152 sq. feet
|
2 baths 3 beds |
show details | |

|
#7
Clear River Ln
Denton, TX 76210
|
1,507 sq. feet
|
2 baths 3 beds |
show details | |

|
#8
Evers Pkwy
Denton, TX 76207
|
1,452 sq. feet
|
1 baths 3 beds |
show details | |

|
#9
Evan Dr
Denton, TX 76207
|
1,961 sq. feet
|
2 baths 3 beds |
show details | |

|
#10
Vista Ct
Denton, TX 76210
|
2,330 sq. feet
|
2 baths 3 beds |
show details |
| Photo | Address | Area | Beds / Baths | Price | Details |
|---|---|---|---|---|---|

|
#11
Whetstone Dr
Denton, TX 76210
|
2,640 sq. feet
|
2 baths 3 beds |
show details | |

|
#12
Doecrest Dr
Denton, TX 76210
|
2,086 sq. feet
|
2 baths 3 beds |
show details | |

|
#13
Newport Ave
Denton, TX 76209
|
1,213 sq. feet
|
2 baths 3 beds |
show details | |

|
#14
Hawthorn Dr
Denton, TX 76208
|
2,325 sq. feet
|
2 baths 3 beds |
show details | |

|
#15
Misty Gln
Denton, TX 76210
|
1,644 sq. feet
|
2 baths 3 beds |
show details | |

|
#16
Lipizzan Dr
Denton, TX 76210
|
2,087 sq. feet
|
2 baths 3 beds |
show details | |

|
#17
Highfield Park
Denton, TX 76210
|
3,440 sq. feet
|
3 baths 4 beds |
show details | |

|
#18
Groveland Ter
Denton, TX 76210
|
2,570 sq. feet
|
2 baths 4 beds |
show details | |

|
#19
Seven Oaks Ln
Denton, TX 76210
|
1,647 sq. feet
|
2 baths 3 beds |
show details | |

|
#20
Oxford Oaks Ln
Denton, TX 76210
|
1,983 sq. feet
|
2 baths 3 beds |
show details |
| Photo | Address | Area | Beds / Baths | Price | Details |
|---|---|---|---|---|---|

|
#21
Tahoe Ln
Denton, TX 76210
|
2,362 sq. feet
|
2 baths 4 beds |
show details | |

|
#22
Paddock Way
Denton, TX 76210
|
1,860 sq. feet
|
2 baths 3 beds |
show details | |

|
#23
Hawthorn Dr
Denton, TX 76208
|
2,024 sq. feet
|
2 baths 3 beds |
show details | |

|
#24
Windridge Ln
Denton, TX 76208
|
1,816 sq. feet
|
2 baths 4 beds |
show details | |

|
#25
Dunes St
Denton, TX 76209
|
1,845 sq. feet
|
2 baths 4 beds |
show details | |

|
#26
Settlement Dr
Denton, TX 76210
|
1,892 sq. feet
|
2 baths 3 beds |
show details | |

|
#27
Thoroughbred Trl
Denton, TX 76210
|
1,701 sq. feet
|
2 baths 3 beds |
show details | |

|
#28
Mirror Rock Ln
Denton, TX 76210
|
3,642 sq. feet
|
3 baths 5 beds |
show details | |

|
#29
Alderbrook Dr
Denton, TX 76210
|
2,236 sq. feet
|
2 baths 3 beds |
show details | |

|
#30
Mallard Dr
Denton, TX 76210
|
2,374 sq. feet
|
2 baths 3 beds |
show details |
| Photo | Address | Area | Beds / Baths | Price | Details |
|---|---|---|---|---|---|

|
#31
Clark Dr
Denton, TX 76210
|
2,018 sq. feet
|
3 baths 3 beds |
show details | |

|
#32
Gardenview St
Denton, TX 76207
|
1,253 sq. feet
|
2 baths 3 beds |
show details | |

|
#33
Park Palisades Dr
Denton, TX 76210
|
1,602 sq. feet
|
2 baths 3 beds |
show details | |

|
#34
Lookout Ln
Denton, TX 76207
|
1,894 sq. feet
|
2 baths 4 beds |
show details | |

|
#35
Coit St
Denton, TX 76201
|
878 sq. feet
|
1 baths 2 beds |
show details | |

|
#36
Hollis Dr
Denton, TX 76210
|
2,348 sq. feet
|
1 baths 3 beds |
show details | |

|
#37
Hollow Ridge Dr
Denton, TX 76210
|
2,292 sq. feet
|
2 baths 3 beds |
show details | |

|
#38
Nightingale Ln
Denton, TX 76210
|
1,994 sq. feet
|
2 baths 4 beds |
show details | |

|
#39
Carrigan Ln
Denton, TX 76207
|
1,698 sq. feet
|
2 baths 3 beds |
show details | |

|
#40
Mustang Dr
Denton, TX 76210
|
2,273 sq. feet
|
2 baths 3 beds |
show details |
| Photo | Address | Area | Beds / Baths | Price | Details |
|---|---|---|---|---|---|

|
#41
Creek Crossing Dr
Denton, TX 76210
|
3,221 sq. feet
|
3 baths 4 beds |
show details | |

|
#42
Ocean Dr
Denton, TX 76210
|
1,617 sq. feet
|
2 baths 3 beds |
show details | |

|
#43
Shoal Bnd
Denton, TX 76210
|
2,136 sq. feet
|
2 baths 3 beds |
show details | |

|
#44
Bernard St
Denton, TX 76201
|
896 sq. feet
|
1 baths 2 beds |
show details | |

|
#45
Jacqueline Dr
Denton, TX 76205
|
1,166 sq. feet
|
1 baths 3 beds |
show details | |

|
#46
Sagebrush Dr
Denton, TX 76209
|
988 sq. feet
|
1 baths 3 beds |
show details | |

|
#47
Tori Oak Trl
Denton, TX 76210
|
2,650 sq. feet
|
2 baths 4 beds |
show details | |

|
#48
Chaucer Dr
Denton, TX 76210
|
3,981 sq. feet
|
2 baths 5 beds |
show details | |

|
#49
Misty Gln
Denton, TX 76210
|
1,822 sq. feet
|
2 baths 3 beds |
show details | |

|
Check over 1 million property listings on Foreclosure.com!
|
browse all offers | |||


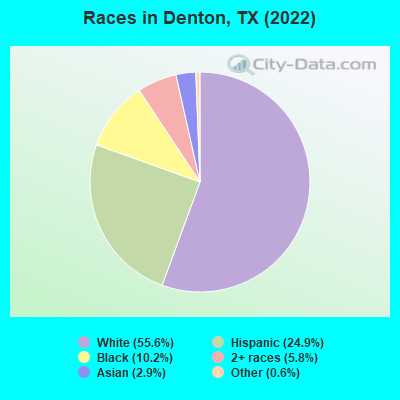
- 83,52455.6%White alone
- 37,42124.9%Hispanic
- 15,38210.2%Black alone
- 8,7875.8%Two or more races
- 4,3692.9%Asian alone
- 8660.6%Other race alone
- 80.01%American Indian alone
Races in Denton detailed stats: ancestries, foreign born residents, place of birth
According to our research of Texas and other state lists, there were 136 registered sex offenders living in Denton, Texas as of April 27, 2024.
The ratio of all residents to sex offenders in Denton is 984 to 1.
The ratio of registered sex offenders to all residents in this city is lower than the state average.
The City-Data.com crime index weighs serious crimes and violent crimes more heavily. Higher means more crime, U.S. average is 246.1. It adjusts for the number of visitors and daily workers commuting into cities.
- means the value is smaller than the state average.- means the value is about the same as the state average.
- means the value is bigger than the state average.
- means the value is much bigger than the state average.

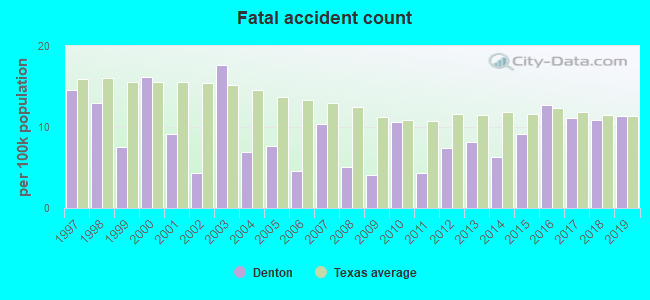
Crime rate in Denton detailed stats: murders, rapes, robberies, assaults, burglaries, thefts, arson
Full-time law enforcement employees in 2021, including police officers: 272 (191 officers - 159 male; 32 female).
| Officers per 1,000 residents here: | 1.27 |
| Texas average: | 2.07 |
 Recent articles from our blog. Our writers, many of them Ph.D. graduates or candidates, create easy-to-read articles on a wide variety of topics.

 | Considering Denton, TX for graduate school (47 replies) |
| Best neighborhoods near Denton (13 replies) |
| How do you guys feel about South Denton/Corinth areas? (8 replies) |
| Thoughts on Denton? (12 replies) |
| Moving to Denton, TX area with kids (6 replies) |
| do you think denton is a good place to live (10 replies) |
Latest news from Denton, TX collected exclusively by city-data.com from local newspapers, TV, and radio stations
Denton, TX City Guides:
Ancestries: German (7.6%), English (7.5%), American (5.6%), Irish (4.4%), European (3.5%), African (2.2%).
Current Local Time: CST time zone
Elevation: 662 feet
Land area: 61.5 square miles.
Population density: 2,445 people per square mile (low).
18,915 residents are foreign born (7.0% Latin America, 3.6% Asia).
| This city: | 12.4% |
| Texas: | 17.1% |
Median real estate property taxes paid for housing units with mortgages in 2022: $5,635 (1.6%)
Median real estate property taxes paid for housing units with no mortgage in 2022: $3,846 (1.4%)
Nearest city with pop. 200,000+: Northeast Tarrant, TX (24.0 miles  , pop. 402,130).
Nearest city with pop. 1,000,000+: Dallas, TX (35.0 miles , pop. 1,188,580).
Nearest cities:
Latitude: 33.22 N, Longitude: 97.13 W
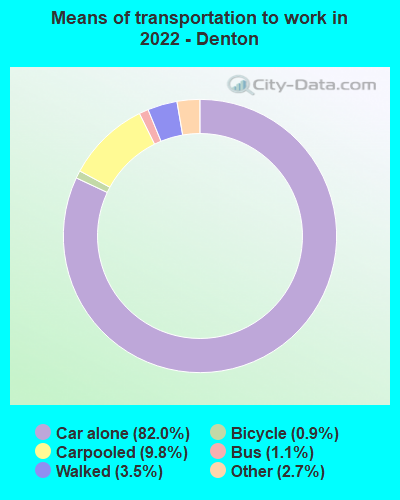
Daytime population change due to commuting: +3,136 (+2.1%)
Workers who live and work in this city: 40,596 (50.1%)
Area codes: 940, 817
Property values in Denton, TX
Denton tourist attractions:
Denton, Texas accommodation & food services, waste management - Economy and Business Data
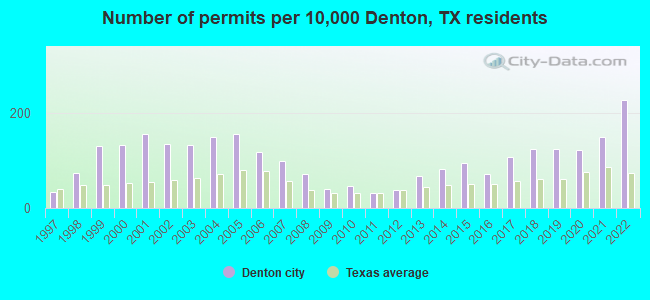
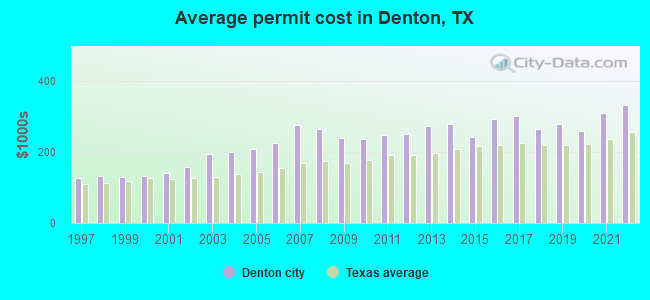
Single-family new house construction building permits:
- 2022: 1832 buildings, average cost: $333,500
- 2021: 1203 buildings, average cost: $309,800
- 2020: 985 buildings, average cost: $260,300
- 2019: 994 buildings, average cost: $279,300
- 2018: 1005 buildings, average cost: $265,400
- 2017: 871 buildings, average cost: $302,300
- 2016: 569 buildings, average cost: $293,700
- 2015: 761 buildings, average cost: $241,800
- 2014: 655 buildings, average cost: $280,400
- 2013: 548 buildings, average cost: $273,600
- 2012: 300 buildings, average cost: $251,200
- 2011: 259 buildings, average cost: $247,900
- 2010: 381 buildings, average cost: $237,600
- 2009: 324 buildings, average cost: $241,200
- 2008: 578 buildings, average cost: $265,400
- 2007: 787 buildings, average cost: $276,400
- 2006: 952 buildings, average cost: $225,900
- 2005: 1246 buildings, average cost: $208,200
- 2004: 1207 buildings, average cost: $199,700
- 2003: 1065 buildings, average cost: $196,200
- 2002: 1081 buildings, average cost: $157,800
- 2001: 1254 buildings, average cost: $139,600
- 2000: 1070 buildings, average cost: $131,600
- 1999: 1045 buildings, average cost: $128,800
- 1998: 591 buildings, average cost: $132,400
- 1997: 269 buildings, average cost: $127,500
| Here: | 3.0% |
| Texas: | 3.5% |
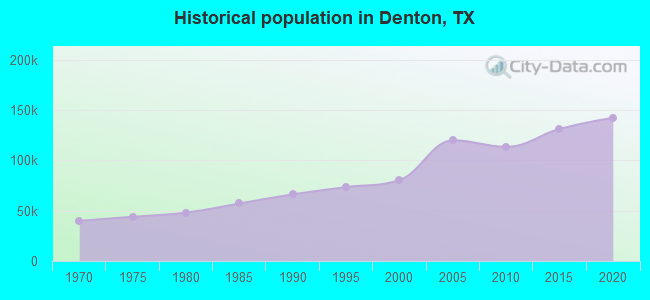
Population change in the 1990s: +13,269 (+19.7%).
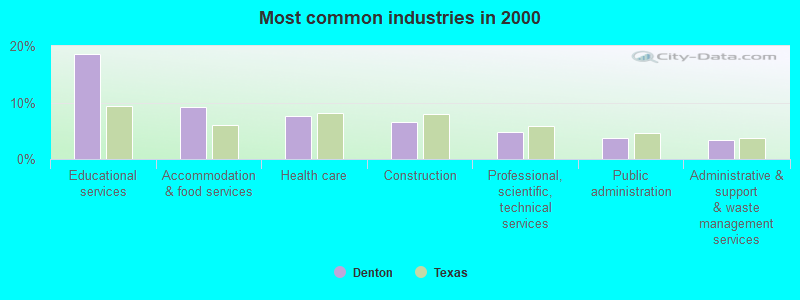
- Educational services (18.7%)
- Accommodation & food services (9.2%)
- Health care (7.6%)
- Construction (6.6%)
- Professional, scientific, technical services (4.7%)
- Public administration (3.6%)
- Administrative & support & waste management services (3.4%)
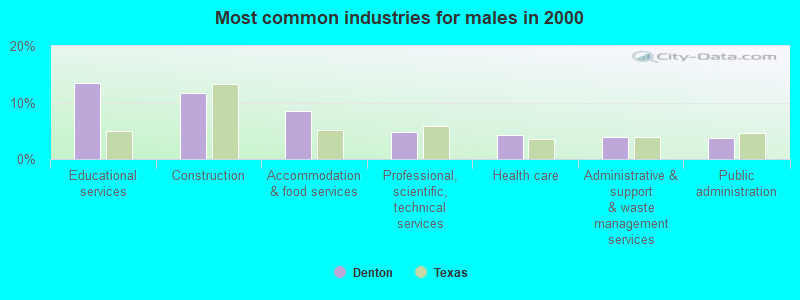
- Educational services (13.4%)
- Construction (11.7%)
- Accommodation & food services (8.5%)
- Professional, scientific, technical services (4.8%)
- Health care (4.2%)
- Administrative & support & waste management services (3.9%)
- Public administration (3.7%)
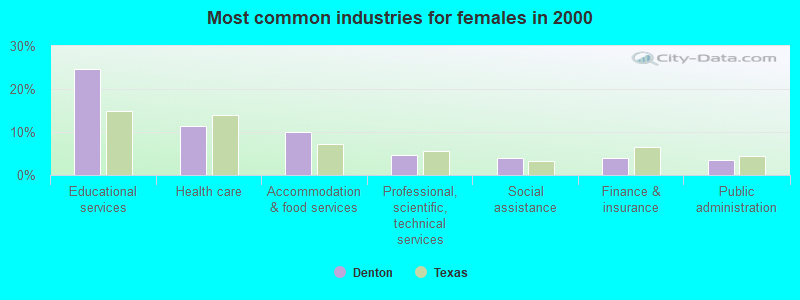
- Educational services (24.6%)
- Health care (11.5%)
- Accommodation & food services (9.9%)
- Professional, scientific, technical services (4.6%)
- Social assistance (4.0%)
- Finance & insurance (3.9%)
- Public administration (3.5%)
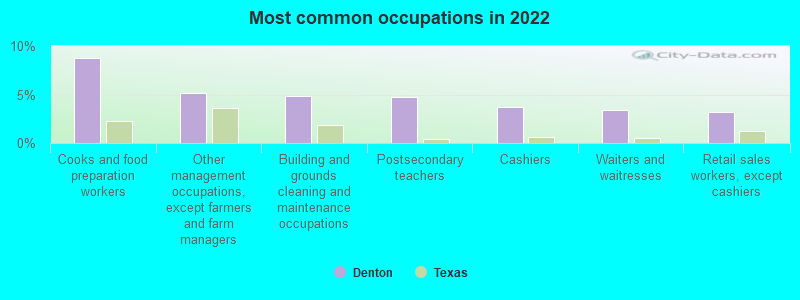
- Cooks and food preparation workers (8.8%)
- Other management occupations, except farmers and farm managers (5.1%)
- Building and grounds cleaning and maintenance occupations (4.9%)
- Postsecondary teachers (4.8%)
- Cashiers (3.7%)
- Waiters and waitresses (3.4%)
- Retail sales workers, except cashiers (3.2%)
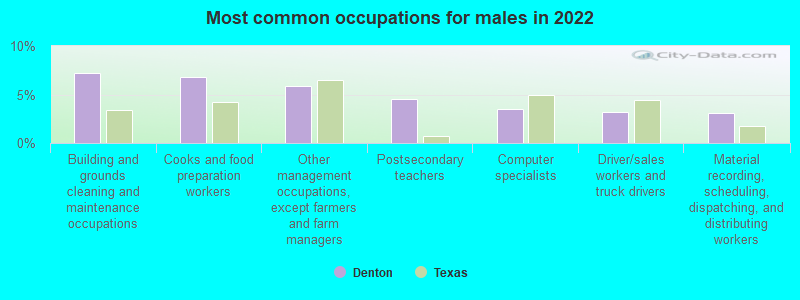
- Building and grounds cleaning and maintenance occupations (7.2%)
- Cooks and food preparation workers (6.8%)
- Other management occupations, except farmers and farm managers (5.9%)
- Postsecondary teachers (4.6%)
- Computer specialists (3.5%)
- Driver/sales workers and truck drivers (3.2%)
- Material recording, scheduling, dispatching, and distributing workers (3.1%)

- Cooks and food preparation workers (11.0%)
- Waiters and waitresses (5.0%)
- Postsecondary teachers (5.0%)
- Cashiers (4.8%)
- Customer service representatives (4.4%)
- Other management occupations, except farmers and farm managers (4.3%)
- Information and record clerks, except customer service representatives (4.0%)
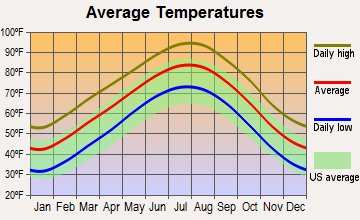
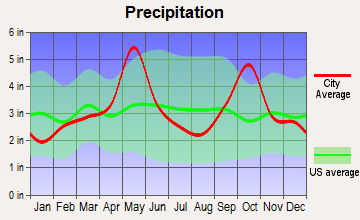
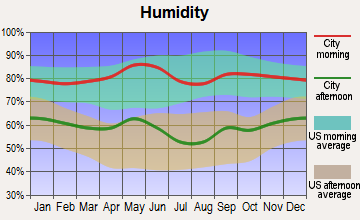
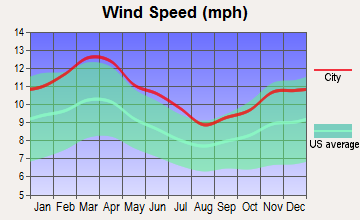
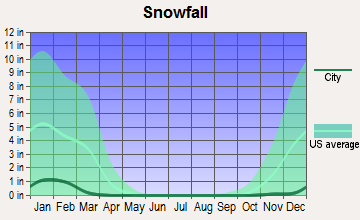
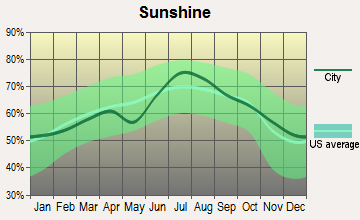
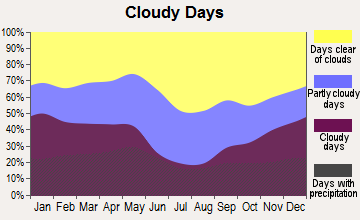
Average climate in Denton, Texas
Based on data reported by over 4,000 weather stations
|
|

(lower is better)
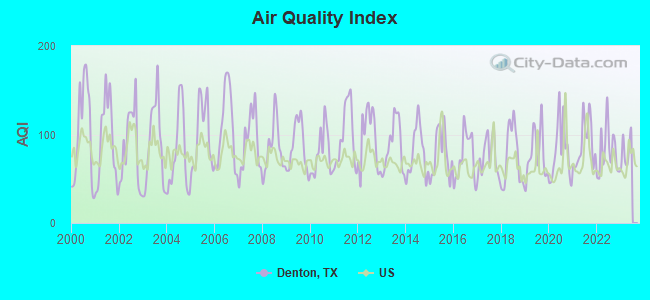
Air Quality Index (AQI) level in 2022 was 80.5. This is about average.
| City: | 80.5 |
| U.S.: | 72.6 |
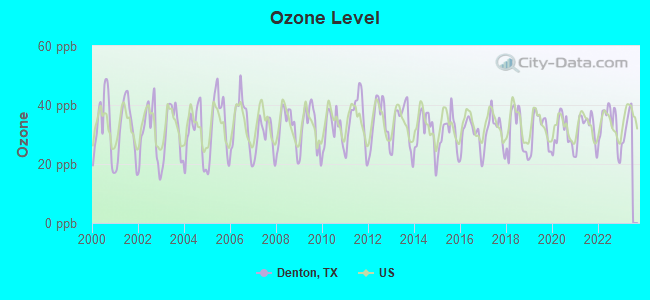
Ozone [ppb] level in 2022 was 33.4. This is about average. Closest monitor was 4.3 miles away from the city center.
| City: | 33.4 |
| U.S.: | 33.3 |
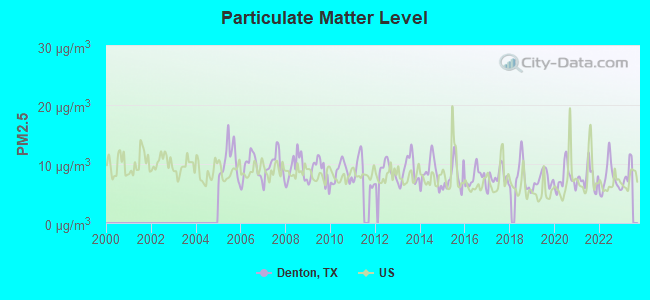
Particulate Matter (PM2.5) [µg/m3] level in 2022 was 7.55. This is about average. Closest monitor was 3.9 miles away from the city center.
| City: | 7.55 |
| U.S.: | 8.11 |
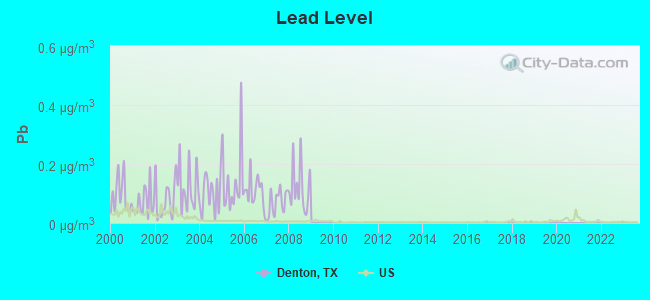
Lead (Pb) [µg/m3] level in 2008 was 0.121. This is significantly worse than average. Closest monitor was 0.2 miles away from the city center.
| City: | 0.121 |
| U.S.: | 0.009 |
Tornado activity:
Denton-area historical tornado activity is above Texas state average. It is 148% greater than the overall U.S. average.
On 6/12/1966, a category F3 (max. wind speeds 158-206 mph) tornado 9.5 miles away from the Denton city center .
On 4/2/1957, a category F3 tornado 19.1 miles away from the city center killed 10 people and injured 200 people and caused between $500,000 and $5,000,000 in damages.
Earthquake activity:
Denton-area historical earthquake activity is significantly above Texas state average. It is 521% greater than the overall U.S. average.On 11/6/2011 at 03:53:10, a magnitude 5.7 (5.7 MW, Depth: 3.2 mi, Class: Moderate, Intensity: VI - VII) earthquake occurred 161.5 miles away from Denton center
On 9/3/2016 at 12:02:44, a magnitude 5.8 (5.8 MW, Depth: 3.5 mi) earthquake occurred 222.2 miles away from the city center
On 6/16/1978 at 11:46:54, a magnitude 5.3 (4.4 MB, 4.6 UK, 5.3 ML) earthquake occurred 211.1 miles away from Denton center
On 11/7/2016 at 01:44:24, a magnitude 5.0 (5.0 MW, Depth: 2.8 mi) earthquake occurred 192.8 miles away from the city center
On 11/8/2011 at 02:46:57, a magnitude 4.8 (4.8 MW, Depth: 3.1 mi, Class: Light, Intensity: IV - V) earthquake occurred 161.3 miles away from the city center
On 11/5/2011 at 07:12:45, a magnitude 4.8 (4.8 MW, Depth: 1.9 mi) earthquake occurred 162.8 miles away from the city center
Magnitude types: body-wave magnitude (MB), local magnitude (ML), moment magnitude (MW)
Natural disasters:
The number of natural disasters in Denton County (18) is near the US average (15).Major Disasters (Presidential) Declared: 7
Emergencies Declared: 9
Causes of natural disasters: Storms: 6, Fires: 5, Floods: 5, Hurricanes: 5, Tornadoes: 5, Wind: 1, Other: 2 (Note: some incidents may be assigned to more than one category).
Hospitals in Denton:
- ANNS HAVEN HOSPICE (217 MULBERRY)
- BELL HOUSE (2402 BERNARD)
- CARTER HOUSE (3805 CAMELOT)
- DENTON OSTEOPATHIC HOSP INC (2026 UNIVERSITY DR WEST)
- DENTON STATE SCHOOL (3980 STATE SCHOOL RD HW 35 E)
- MAYHILL HOSPITAL (Proprietary, provides emergency services, 2809 SOUTH MAYHILL ROAD)
- OAK BEND HOUSE (1430 N RUDDELL)
- SANDY OAKS I I (1475 S TRINITY RD)
- SOUTHERN CARE DENTON (5800 NORTH I-35 SUITE 200)
- THE HEART HOSPITAL BAYLOR DENTON (Voluntary non-profit - Other, 2801 SOUTH MAYHILL ROAD)
Airports and heliports located in Denton:
- Denton Enterprise Airport (DTO) (Runways: 1, Commercial Ops: 54, Air Taxi Ops: 1,390, Itinerant Ops: 73,277, Local Ops: 90,108, Military Ops: 223)
- Hartlee Field Airport (3XS0) (Runways: 1, Itinerant Ops: 2,500, Local Ops: 4,500)
- Myska Field Airport (2TS0) (Runways: 1)
- Smither Field Airport (TE81) (Runways: 1)
- Warschun Ranch Airport (4TA1) (Runways: 1)
- Denton Community Hospital Heliport (TX50)
- Denton Regional Medical Ctr - Flow Campus Heliport (TS58)
Colleges/Universities in Denton:
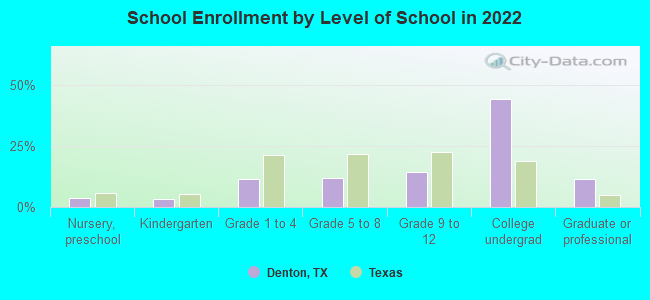
- University of North Texas (Full-time enrollment: 31,694; Location: 1501 W.Chestnut Ave.; Public; Website: www.unt.edu; Offers Doctor's degree)
- Texas Woman's University (Full-time enrollment: 11,837; Location: 304 Administration Dr; Public; Website: www.twu.edu; Offers Doctor's degree)
- Ogle School Hair Skin Nails-Denton (Full-time enrollment: 159; Location: 2324 San Jacinto Boulevard; Private, for-profit; Website: www.ogleschool.com)
Other colleges/universities with over 2000 students near Denton:
- DeVry University-Texas (about 21 miles; Irving, TX; Full-time enrollment: 4,098)
- North Lake College (about 26 miles; Irving, TX; FT enrollment: 6,191)
- Brookhaven College (about 26 miles; Farmers Branch, TX; FT enrollment: 6,868)
- The University of Texas at Dallas (about 28 miles; Richardson, TX; FT enrollment: 16,777)
- North Central Texas College (about 28 miles; Gainesville, TX; FT enrollment: 6,550)
- University of Dallas (about 29 miles; Irving, TX; FT enrollment: 2,192)
- Collin County Community College District (about 29 miles; McKinney, TX; FT enrollment: 18,044)
Biggest public high schools in Denton:
- GUYER H S (Students: 2,101, Location: 7501 TEASLEY LN, Grades: 9-12)
- DENTON H S (Students: 1,587, Location: 1007 FULTON, Grades: 9-12)
- JOE DALE SPARKS CAMPUS (Students: 49, Location: 210 S WOODROW, Grades: 7-12)
- LESTER DAVIS (Students: 49, Location: 1125 DAVIS ST, Grades: 2-12)
- FRED MOORE H S (Students: 41, Location: 815 CROSS TIMBERS ST, Grades: 9-12)
- DENTON COUNTY JJAEP CFB CAMPUS (Location: 210 S WOODROW LN, Grades: 11)
- RYAN H S (Location: 5101 E MCKINNEY, Grades: 9-12)
- DENTON CO J J A E P (Location: 210 S WOODROW LN, Grades: 8-11)
- DENTON CO J J A E P (Location: 210 S WOODROW LN, Grades: 8-12)
- DENTON CO J J A E P (Location: 301 E MCKINNEY, Grades: 9)
Private high schools in Denton:
Biggest public elementary/middle schools in Denton:
- STRICKLAND MIDDLE (Students: 853, Location: 324 WINDSOR ST, Grades: 6-8)
- MCMATH MIDDLE (Students: 819, Location: 1900 JASON DR, Grades: 6-8)
- PECAN CREEK EL (Students: 645, Location: 4400 LAKEVIEW BLVD, Grades: PK-5)
- CALHOUN MIDDLE (Students: 623, Location: 709 CONGRESS ST, Grades: 6-8)
- EVERS PARK EL (Students: 596, Location: 3300 EVERS PKWY, Grades: PK-5)
- MCNAIR EL (Students: 595, Location: 1212 HICKORY CREEK RD, Grades: KG-5)
- HODGE EL (Students: 586, Location: 3900 GRANT PKWY, Grades: PK-5)
- RIVERA EL (Students: 572, Location: 701 NEWTON ST, Grades: PK-5)
- GINNINGS EL (Students: 552, Location: 2525 YELLOWSTONE, Grades: KG-5)
- NEWTON RAYZOR EL (Students: 529, Location: 1400 MALONE, Grades: PK-5)
Private elementary/middle schools in Denton:
User-submitted facts and corrections:
- Hilltop Montessori School, private Montessori school for ages 18 months to 12 years, 1014 N. Elm St., 30 students, 387-0578
- New High School. Teasley Lane in Denton, TX. New home subdivisions. 76210 zip code area. added by Stewart
Points of interest:
Notable locations in Denton: City of Denton Water Treatment Facility (A), Denton Country Club (B), North Texas State College Golf Course (C), Texas Womans University Golf Course (D), University of North Texas Mens Gym (E), Denton County Courthouse (F), Denton Fire Department Station 3 (G), Denton Fire Department Station 6 (H), Denton Fire Department Station 7 (I), Denton Fire Department Station 5 (J), Denton Fire Department (K), Denton Fire Department Station 4 (L), Denton Fire Department Station 2 (M), Hanger 10 Flying Museum (N), Denton County Historical Museum (O), Daughters of the American Revolution Museum (P), Careflite Ambulance Bonnie Brae Street (Q), University Behavioral Health of Denton (R). Display/hide their locations on the map
Shopping Center: Golden Triangle Shopping Center (1). Display/hide its location on the map
Churches in Denton include: Pleasant Grove Church (A), Central Baptist Church (B), Betania Iglesia Bautista Church (C), Lindsey Assembly of God Church (D), Apostolic Assembly Church (E), First Baptist Church of Denton (F), Christ the Servant Lutheran Church (G), Saint Davids Episcopal Church (H), First Church of the Nazarene (I). Display/hide their locations on the map
Cemeteries: Oakwood Cemetery (1), Shiloh Cemetery (2), Roselawn Memorial Cemetery (3). Display/hide their locations on the map
Reservoirs: Unicorn Lake (A), Galbraith Lake (B), Country Club Lake (C), Rayzor Lake (D), Soil Conservation Service Site 16 Reservoir (E), Soil Conservation Service Site 17a Reservoir (F), John Knox Village Lake (G). Display/hide their locations on the map
Streams, rivers, and creeks: Bray Branch (A), Aubrey Branch (B), Roark Branch (C), Loving Branch (D), Fincher Branch (E), Fletcher Branch (F), Graveyard Branch (G), Dry Fork Hickory Creek (H). Display/hide their locations on the map
Parks in Denton include: Skiles Park (1), Schultz Park (2), Fouts Field (3), Phoenix Park (4), Moore Park (5), North Lakes Park (6), McKenna Park (7), Mack Park (8), Woodrow Park (9). Display/hide their locations on the map
Tourist attractions: Heavenly Cruises & Travel (Ski & Helicopter Tours; 107 North Bell Avenue Suite 2) (1), Denton County Historical Museum Inc (Cultural Attractions- Events- & Facilities; 5800 North Interstate 35) (2). Display/hide their approximate locations on the map
Hotels: Best Western Denton Inn (2910 West University) (1), Clayton House Motel (1111 West University Drive) (2). Display/hide their approximate locations on the map
Court: Shady Shores Town - Municipal Court (101 Lakeshore Road) (1). Display/hide its approximate location on the map
Birthplace of: Sly Stone - Musician, Ann Sheridan - Actress 1915-1967, Samuel Tankersley Williams - Army general, Abner Haynes - Football player, Alvin M. Owsley - Politician, Anthony Alridge - Football player, Austin Jackson - Baseball player, Jordan Malone - Short track speed skater, Kelly Kraft - Professional golfer, Brian Adias - Professional wrestler.
| This city: | 2.5 people |
| Texas: | 2.8 people |
| This city: | 53.8% |
| Whole state: | 69.9% |
| This city: | 6.8% |
| Whole state: | 6.0% |
Likely homosexual households (counted as self-reported same-sex unmarried-partner households)
- Lesbian couples: 0.4% of all households
- Gay men: 0.3% of all households
People in group quarters in Denton in 2010:
- 6,475 people in college/university student housing
- 1,147 people in local jails and other municipal confinement facilities
- 496 people in group homes intended for adults
- 391 people in nursing facilities/skilled-nursing facilities
- 227 people in workers' group living quarters and job corps centers
- 123 people in other noninstitutional facilities
- 58 people in residential treatment centers for juveniles (non-correctional)
- 30 people in group homes for juveniles (non-correctional)
- 15 people in correctional facilities intended for juveniles
- 9 people in emergency and transitional shelters (with sleeping facilities) for people experiencing homelessness
- 5 people in residential schools for people with disabilities
People in group quarters in Denton in 2000:
- 5,106 people in college dormitories (includes college quarters off campus)
- 888 people in schools, hospitals, or wards for the intellectually disabled
- 676 people in local jails and other confinement facilities (including police lockups)
- 667 people in nursing homes
- 138 people in other noninstitutional group quarters
- 131 people in federal prisons and detention centers
- 113 people in homes for the mentally retarded
- 72 people in short-term care, detention or diagnostic centers for delinquent children
- 29 people in homes for abused, dependent, and neglected children
- 12 people in religious group quarters
- 10 people in homes for the physically handicapped
Banks with most branches in Denton (2011 data):
- Wells Fargo Bank, National Association: 12 branches. Info updated 2011/04/05: Bank assets: $1,161,490.0 mil, Deposits: $905,653.0 mil, headquarters in Sioux Falls, SD, positive income, 6395 total offices, Holding Company: Wells Fargo & Company
- First State Bank: Teasley Lane Branch, Denton Mobile Branch, Denton Branch, Rayzor Ranch Branch. Info updated 2008/05/16: Bank assets: $576.6 mil, Deposits: $503.5 mil, headquarters in Gainesville, TX, positive income, 11 total offices, Holding Company: Red River Bancorp, Inc.
- JPMorgan Chase Bank, National Association: South Denton Branch, University Of North Texas Branch, Teasley And Hickory Creek Branch, West University Branch. Info updated 2011/11/10: Bank assets: $1,811,678.0 mil, Deposits: $1,190,738.0 mil, headquarters in Columbus, OH, positive income, International Specialization, 5577 total offices, Holding Company: Jpmorgan Chase & Co.
- First National Bank Texas: University Banking Center - Rc 493, Denton Banking Center - Rc 821, Loop 288 Banking Center - Rc 866, Rayzor Ranch Banking Center - Rc 648. Info updated 2006/11/03: Bank assets: $944.3 mil, Deposits: $815.9 mil, headquarters in Killeen, TX, positive income, Mortgage Lending Specialization, 250 total offices, Holding Company: First Community Bancshares, Inc.
- First United Bank and Trust Company: Denton-North Branch, Denton-South Branch, Denton-Downtown Branch. Info updated 2006/11/03: Bank assets: $2,060.2 mil, Deposits: $1,702.6 mil, headquarters in Durant, OK, positive income, Commercial Lending Specialization, 31 total offices, Holding Company: Durant Bancorp, Inc.
- Pointbank: Denton Bank South Branch, Denton Bank North Branch, Corinth Branch. Info updated 2006/11/03: Bank assets: $325.7 mil, Deposits: $287.2 mil, headquarters in Pilot Point, TX, positive income, Commercial Lending Specialization, 9 total offices, Holding Company: Pilot Point Bancorp, Inc. Esop
- Northstar Bank of Texas: South Denton Branch, Messenger Service, Northstar Bank Of Texas. Info updated 2006/11/03: Bank assets: $948.9 mil, Deposits: $846.3 mil, local headquarters, positive income, Commercial Lending Specialization, 11 total offices, Holding Company: Northstar Financial Corporation
- Compass Bank: Denton South Branch at 729 Fort Worth Drive, branch established on 1977/01/26; Denton Main Branch at 1444 West University Drive, branch established on 2009/08/22. Info updated 2011/02/24: Bank assets: $63,107.0 mil, Deposits: $46,232.4 mil, headquarters in Birmingham, AL, negative income in the last year, Commercial Lending Specialization, 720 total offices, Holding Company: Banco Bilbao Vizcaya Argentaria, S.A.
- Meridian Bank Texas: Denton Branch at 1013 W University Drive, branch established on 2011/06/06. Info updated 2009/09/28: Bank assets: $271.0 mil, Deposits: $231.1 mil, headquarters in Fort Worth, TX, positive income, Commercial Lending Specialization, 2 total offices, Holding Company: Marquette Financial Companies
- 7 other banks with 7 local branches
For population 15 years and over in Denton:
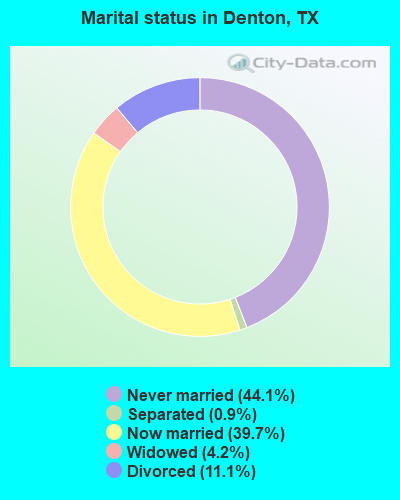
- Never married: 44.1%
- Now married: 39.7%
- Separated: 0.9%
- Widowed: 4.2%
- Divorced: 11.1%
For population 25 years and over in Denton:
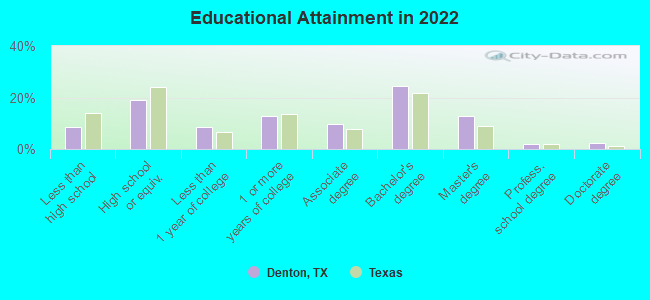
- High school or higher: 91.3%
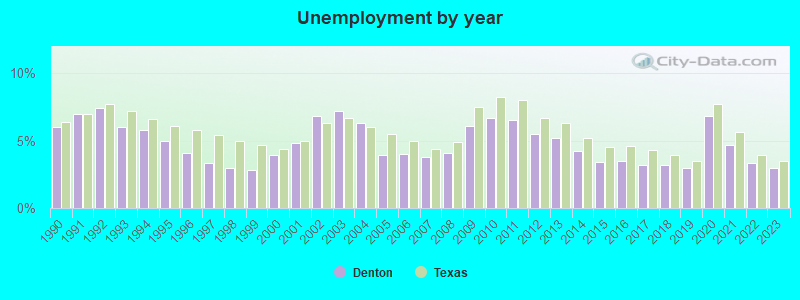
- Bachelor's degree or higher: 41.3%
- Graduate or professional degree: 17.0%
- Unemployed: 7.3%
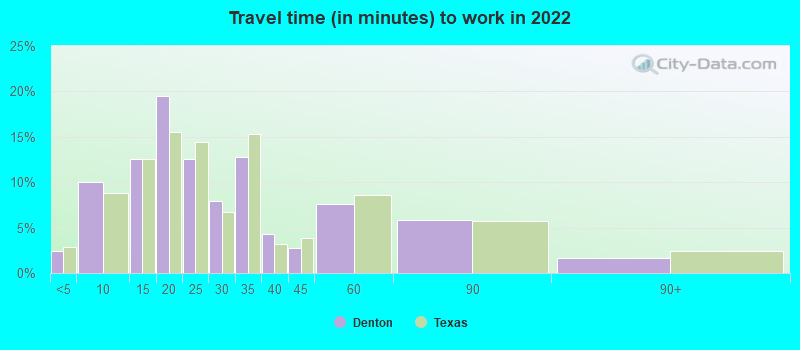
- Mean travel time to work (commute): 22.5 minutes
| Here: | 13.0 |
| Texas average: | 14.0 |


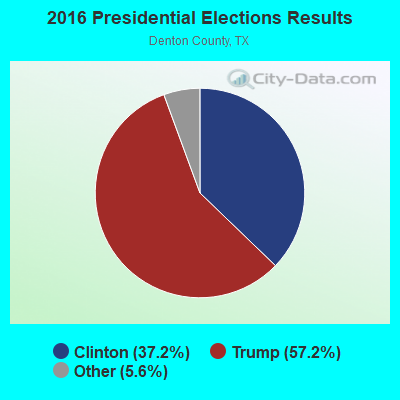
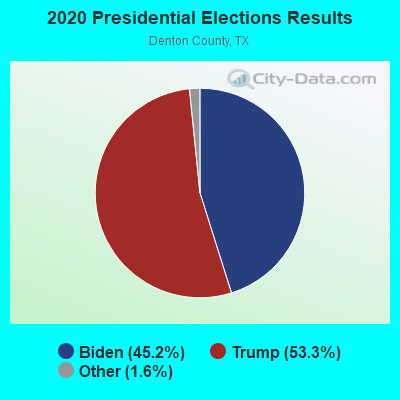
Graphs represent county-level data. Detailed 2008 Election Results
Neighborhoods in Denton:
(Denton, Texas Neighborhood Map)- Autumn Oaks neighborhood
- Bednar Homestead neighborhood
- Bluffs At Pinnell Point neighborhood
- Braewood at Oakmont neighborhood
- Briar Glen neighborhood
- Briarwood neighborhood
- Brightwood Estate neighborhood
- Bryden neighborhood
- Canyon Lake neighborhood
- Canyon Lake Ranch neighborhood
- Corinth Amity Village neighborhood
- Corinth City Hall neighborhood
- Corinth Forest neighborhood
- Corinth Shores Estate neighborhood
- Corinthian Oaks neighborhood
- Corinthian Palisades neighborhood
- Corinthian Townhomes neighborhood
- Corrinth Farms neighborhood
- Creek Side neighborhood
- Cypress Point Estate neighborhood
- Doerr neighborhood
- Eagle Pass At Oakmont neighborhood
- Fairview neighborhood
- Fairview Meadows neighborhood
- Fairview West neighborhood
- Fairway Estate neighborhood
- Fairway Vista neighborhood
- Fancher Subdivision neighborhood
- Forest Hill neighborhood
- Forestwood neighborhood
- Gibson Heights neighborhood
- Green Acres neighborhood
- Greg Gideo neighborhood
- Happily Ever After neighborhood
- Helm neighborhood
- Hess neighborhood
- Hidden Lakes Estates neighborhood
- Hunter neighborhood
- Jackson Ranch neighborhood
- Kensington Estate neighborhood
- Kensington Park neighborhood
- Knudsen's neighborhood
- Lake Bluff Estates neighborhood
- Lake Sharon Estates neighborhood
- Larkspur At Oakmont neighborhood
- Lewis neighborhood
- Linton neighborhood
- Mcclain neighborhood
- Meadow Oaks neighborhood
- Meadows North Estate neighborhood
- Metroplex Cabinets neighborhood
- Montgomery neighborhood
- Northbrook neighborhood
- Northwood neighborhood
- Nurikaba Apartments neighborhood
- Oak Springs Ranch neighborhood
- Oakmont neighborhood
- Oakmont Estate neighborhood
- Oaks of Corinth neighborhood
- Pecan Creek neighborhood
- Pinnell Square neighborhood
- Pinnell Subdivision neighborhood
- Plemac neighborhood
- Post Oak Crossing neighborhood
- Post Oak Plaza neighborhood
- Priddy neighborhood
- Provence neighborhood
- Sepulveda neighborhood
- Serendipity Hills neighborhood
- Somerset neighborhood
- Southern Comfort Homes neighborhood
- Taylor's Ridge neighborhood
- The Knoll At Oakmont neighborhood
- The Parks of Corinth neighborhood
- The Woods At Oakmont neighborhood
- Thousand Oaks neighborhood
- Tower Ridge Apartments neighborhood
- Villas At The Fairway neighborhood
- Weyer Estates neighborhood
- Whispering Oaks (Lake Dallas) neighborhood
- Windsor Ridge neighborhood
- Windstone neighborhood
Religion statistics for Denton, TX (based on Denton County data)
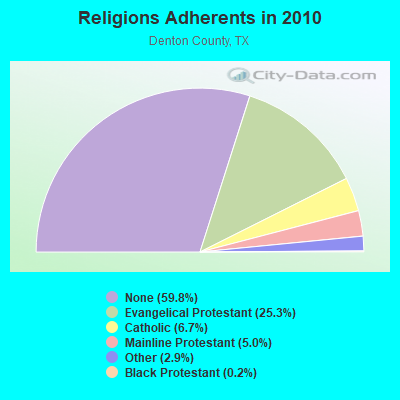
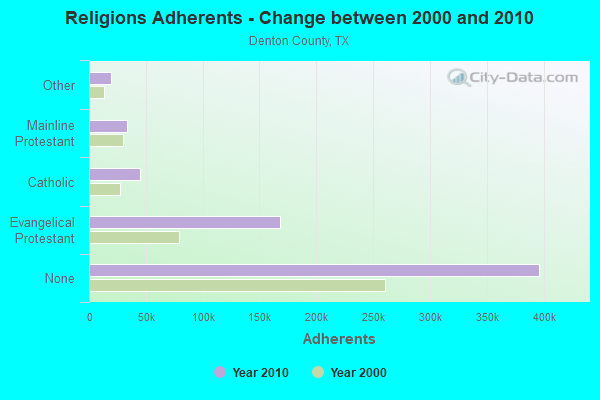
| Religion | Adherents | Congregations |
|---|---|---|
| Evangelical Protestant | 167,945 | 321 |
| Catholic | 44,615 | 8 |
| Mainline Protestant | 33,340 | 56 |
| Other | 18,928 | 42 |
| Black Protestant | 1,354 | 8 |
| Orthodox | 120 | 1 |
| None | 396,312 | - |
Food Environment Statistics:
| Denton County: | 0.85 / 10,000 pop. |
| State: | 1.47 / 10,000 pop. |
| Denton County: | 0.16 / 10,000 pop. |
| Texas: | 0.14 / 10,000 pop. |
| This county: | 0.57 / 10,000 pop. |
| Texas: | 1.11 / 10,000 pop. |
| Denton County: | 2.67 / 10,000 pop. |
| Texas: | 3.95 / 10,000 pop. |
| This county: | 4.90 / 10,000 pop. |
| Texas: | 6.13 / 10,000 pop. |
| Denton County: | 8.5% |
| Texas: | 8.9% |
| This county: | 28.4% |
| State: | 26.6% |
| This county: | 13.8% |
| Texas: | 15.7% |
Health and Nutrition:
| Denton: | 49.3% |
| Texas: | 48.6% |
| This city: | 49.3% |
| State: | 47.4% |
| Denton: | 27.8 |
| Texas: | 28.5 |
| Denton: | 19.2% |
| Texas: | 20.6% |
| Denton: | 9.9% |
| State: | 10.3% |
| Denton: | 6.8 |
| Texas: | 6.8 |
| This city: | 28.9% |
| Texas: | 33.1% |
| Denton: | 59.2% |
| Texas: | 56.2% |
| Denton: | 82.3% |
| Texas: | 80.7% |
More about Health and Nutrition of Denton, TX Residents
| Local government employment and payroll (March 2022) | |||||
| Function | Full-time employees | Monthly full-time payroll | Average yearly full-time wage | Part-time employees | Monthly part-time payroll |
|---|---|---|---|---|---|
| Police Protection - Officers | 205 | $1,768,231 | $103,506 | 0 | $0 |
| Firefighters | 182 | $1,641,821 | $108,252 | 0 | $0 |
| Electric Power | 169 | $1,403,619 | $99,665 | 0 | $0 |
| Water Supply | 135 | $665,611 | $59,165 | 1 | $529 |
| Solid Waste Management | 117 | $596,967 | $61,227 | 10 | $11,225 |
| Financial Administration | 116 | $804,335 | $83,207 | 3 | $3,888 |
| Other Government Administration | 97 | $688,987 | $85,236 | 1 | $2,747 |
| Sewerage | 84 | $430,346 | $61,478 | 3 | $4,775 |
| Parks and Recreation | 83 | $420,172 | $60,748 | 131 | $58,898 |
| Streets and Highways | 82 | $495,789 | $72,554 | 0 | $0 |
| Police - Other | 70 | $477,735 | $81,897 | 24 | $10,054 |
| Other and Unallocable | 45 | $260,202 | $69,387 | 1 | $2,461 |
| Local Libraries | 42 | $208,475 | $59,564 | 14 | $22,993 |
| Judicial and Legal | 28 | $212,919 | $91,251 | 3 | $5,093 |
| Health | 17 | $78,073 | $55,110 | 2 | $3,897 |
| Fire - Other | 13 | $145,294 | $134,118 | 0 | $0 |
| Natural Resources | 7 | $36,162 | $61,992 | 2 | $2,776 |
| Airports | 4 | $20,978 | $62,934 | 0 | $0 |
| Housing and Community Development (Local) | 3 | $20,307 | $81,228 | 0 | $0 |
| Totals for Government | 1,499 | $10,376,025 | $83,064 | 195 | $129,335 |
Denton government finances - Expenditure in 2021 (per resident):
- Construction - Sewerage: $842,000 ($5.60)
- Current Operations - Electric Utilities: $229,228,000 ($1524.60)
Water Utilities: $51,062,000 ($339.61)
Sewerage: $38,470,000 ($255.86)
Solid Waste Management: $38,450,000 ($255.73)
Police Protection: $35,911,000 ($238.84)
Local Fire Protection: $31,858,000 ($211.89)
Parks and Recreation: $18,899,000 ($125.70)
Regular Highways: $15,731,000 ($104.63)
Central Staff Services: $10,103,000 ($67.20)
Libraries: $6,182,000 ($41.12)
General - Other: $4,964,000 ($33.02)
General Public Buildings: $4,964,000 ($33.02)
Financial Administration: $3,966,000 ($26.38)
Protective Inspection and Regulation - Other: $3,437,000 ($22.86)
Judicial and Legal Services: $1,739,000 ($11.57)
Air Transportation: $1,545,000 ($10.28)
Natural Resources - Other: $1,015,000 ($6.75)
Housing and Community Development: $682,000 ($4.54)
- Electric Utilities - Interest on Debt: $22,315,000 ($148.42)
- General - Interest on Debt: $12,671,000 ($84.28)
- Other Capital Outlay - Sewerage: $12,586,000 ($83.71)
- Water Utilities - Interest on Debt: $3,719,000 ($24.74)
Denton government finances - Revenue in 2021 (per resident):
- Charges - Solid Waste Management: $34,500,000 ($229.46)
Sewerage: $27,000,000 ($179.58)
Parks and Recreation: $1,483,000 ($9.86)
Air Transportation: $1,373,000 ($9.13)
Miscellaneous Commercial Activities: $37,000 ($0.25)
- Federal Intergovernmental - Housing and Community Development: $1,450,000 ($9.64)
Public Welfare: $500,000 ($3.33)
- Local Intergovernmental - Sewerage: $978,000 ($6.50)
- Miscellaneous - Fines and Forfeits: $2,300,000 ($15.30)
General Revenue - Other: $2,032,000 ($13.51)
Interest Earnings: $804,000 ($5.35)
Donations From Private Sources: $99,000 ($0.66)
- Revenue - Electric Utilities: $221,027,000 ($1470.05)
Water Utilities: $43,600,000 ($289.98)
- State Intergovernmental - General Local Government Support: $291,000 ($1.94)
Other: $63,000 ($0.42)
- Tax - Property: $50,325,000 ($334.71)
General Sales and Gross Receipts: $39,338,000 ($261.64)
Other License: $4,138,000 ($27.52)
Alcoholic Beverage License: $45,000 ($0.30)
Amusements Sales: $14,000 ($0.09)
Denton government finances - Debt in 2021 (per resident):
- Long Term Debt - Outstanding Unspecified Public Purpose: $1,393,421,000 ($9267.66)
Beginning Outstanding - Unspecified Public Purpose: $1,388,424,000 ($9234.43)
Issue, Unspecified Public Purpose: $133,420,000 ($887.38)
Retired Unspecified Public Purpose: $128,424,000 ($854.15)
- Short Term Debt Outstanding - End of Fiscal Year: $6,338,000 ($42.15)
Beginning: $5,100,000 ($33.92)
Denton government finances - Cash and Securities in 2021 (per resident):
- Other Funds - Cash and Securities: $613,763,000 ($4082.15)
- Sinking Funds - Cash and Securities: $4,676,000 ($31.10)
12.39% of this county's 2021 resident taxpayers lived in other counties in 2020 ($93,158 average adjusted gross income)
| Here: | 12.39% |
| Texas average: | 8.12% |
0.01% of residents moved from foreign countries ($94 average AGI)
Denton County: 0.01% Texas average: 0.04%
Top counties from which taxpayers relocated into this county between 2020 and 2021:
| from Dallas County, TX | |
| from Collin County, TX | |
| from Tarrant County, TX |
10.07% of this county's 2020 resident taxpayers moved to other counties in 2021 ($79,464 average adjusted gross income)
| Here: | 10.07% |
| Texas average: | 7.40% |
0.01% of residents moved to foreign countries ($63 average AGI)
Denton County: 0.01% Texas average: 0.03%
Top counties to which taxpayers relocated from this county between 2020 and 2021:
| to Collin County, TX | |
| to Dallas County, TX | |
| to Tarrant County, TX |
| Businesses in Denton, TX | ||||
| Name | Count | Name | Count | |
|---|---|---|---|---|
| 7-Eleven | 5 | LA Fitness | 1 | |
| AT&T | 3 | La Quinta | 2 | |
| Ace Hardware | 1 | Lane Bryant | 1 | |
| Aeropostale | 1 | Lane Furniture | 3 | |
| Albertsons | 2 | Little Caesars Pizza | 2 | |
| American Eagle Outfitters | 1 | Long John Silver's | 1 | |
| Applebee's | 1 | Lowe's | 1 | |
| Arby's | 2 | Macy's | 1 | |
| AutoZone | 3 | Marriott | 2 | |
| Barnes & Noble | 1 | MasterBrand Cabinets | 1 | |
| Bath & Body Works | 1 | Mazda | 1 | |
| Bed Bath & Beyond | 1 | McDonald's | 5 | |
| Best Western | 2 | Men's Wearhouse | 1 | |
| Blockbuster | 2 | Motel 6 | 1 | |
| Brunswick Bowling & Billiards | 1 | Motherhood Maternity | 2 | |
| Budget Car Rental | 1 | Nike | 10 | |
| Burger King | 1 | Office Depot | 1 | |
| Burlington Coat Factory | 1 | OfficeMax | 1 | |
| CVS | 2 | Old Navy | 1 | |
| Carl\s Jr. | 1 | Olive Garden | 1 | |
| Catherines | 1 | On The Border | 1 | |
| Chevrolet | 1 | Outback | 1 | |
| Chick-Fil-A | 4 | Outback Steakhouse | 1 | |
| Chipotle | 1 | Pac Sun | 1 | |
| Chuck E. Cheese's | 1 | Panera Bread | 1 | |
| Church's Chicken | 1 | Payless | 2 | |
| Comfort Suites | 1 | Penske | 1 | |
| Cracker Barrel | 1 | PetSmart | 1 | |
| Curves | 2 | Pier 1 Imports | 1 | |
| DHL | 1 | Pizza Hut | 3 | |
| Days Inn | 1 | Plato's Closet | 1 | |
| Decora Cabinetry | 1 | Popeyes | 1 | |
| Dennys | 1 | Quality | 1 | |
| Discount Tire | 1 | Quiznos | 2 | |
| Domino's Pizza | 2 | RadioShack | 3 | |
| DressBarn | 1 | Red Lobster | 1 | |
| Dressbarn | 1 | SONIC Drive-In | 7 | |
| Famous Footwear | 2 | Sam's Club | 1 | |
| FedEx | 20 | Sears | 2 | |
| Finish Line | 1 | Spencer Gifts | 1 | |
| Firestone Complete Auto Care | 2 | Sprint Nextel | 1 | |
| Ford | 1 | Staples | 1 | |
| GNC | 1 | Starbucks | 6 | |
| GameStop | 3 | Subaru | 1 | |
| H&R Block | 5 | Subway | 11 | |
| Hilton | 1 | Super 8 | 1 | |
| Hobby Lobby | 1 | T-Mobile | 8 | |
| Holiday Inn | 2 | T.J.Maxx | 1 | |
| Hollister Co. | 1 | Taco Bell | 2 | |
| Home Depot | 1 | Target | 1 | |
| Honda | 1 | The Limited | 1 | |
| Hot Topic | 1 | The Room Place | 2 | |
| Howard Johnson | 1 | Toys"R"Us | 1 | |
| IHOP | 1 | U-Haul | 4 | |
| JCPenney | 1 | UPS | 17 | |
| Jack In The Box | 4 | Vans | 2 | |
| Jimmy John's | 1 | Verizon Wireless | 1 | |
| Jones New York | 3 | Victoria's Secret | 1 | |
| Journeys | 1 | Waffle House | 1 | |
| Justice | 1 | Walgreens | 3 | |
| KFC | 2 | Walmart | 2 | |
| Knights Inn | 1 | Wendy's | 3 | |
| Kroger | 3 | |||
Strongest AM radio stations in Denton:
- KTNO (1440 AM; 12 kW; DENTON, TX; Owner: MORTENSON BROADCASTING COMPANY)
- KZMP (1540 AM; 50 kW; UNIVERSITY PARK, TX; Owner: ENTRAVISION HOLDINGS, LLC)
- KRLD (1080 AM; 50 kW; DALLAS, TX; Owner: TEXAS INFINITY BROADCASTING L.P.)
- KESS (1270 AM; 50 kW; FORT WORTH, TX; Owner: KESS-AM LICENSE CORP.)
- KBIS (1150 AM; 25 kW; HIGHLAND PARK, TX; Owner: DALLAS AM RADIO PARTNERS, L.P.)
- WBAP (820 AM; 50 kW; FORT WORTH, TX; Owner: WBAP-KSCS OPERATING, LTD.)
- KAHZ (1360 AM; 50 kW; HURST, TX)
- KLIF (570 AM; 5 kW; DALLAS, TX; Owner: KLIF LICO, INC.)
- KFXR (1190 AM; 50 kW; DALLAS, TX; Owner: CLEAR CHANNEL BROADCASTING LICENSES, INC.)
- KSKY (660 AM; 20 kW; BALCH SPRINGS, TX; Owner: BISON MEDIA, INC.)
- KTCK (1310 AM; 9 kW; DALLAS, TX; Owner: KRBE LICO, INC.)
- KHVN (970 AM; 10 kW; FORT WORTH, TX; Owner: MORTENSON BROADCASTING COMPANY)
- KAAM (770 AM; 10 kW; GARLAND, TX; Owner: DONTRON, INC.)
Strongest FM radio stations in Denton:
- KNTU (88.1 FM; MCKINNEY, TX; Owner: UNIVERSITY OF NORTH TEXAS)
- KPLX (99.5 FM; FORT WORTH, TX; Owner: KPLX LICO, INC.)
- KNOR (93.7 FM; HEALDTON, OK; Owner: AM & PM BROADCASTERS, LLC)
- KMEO (96.7 FM; FLOWER MOUND, TX; Owner: ABC, INC.)
- KKDL (106.7 FM; MUENSTER, TX; Owner: ENTRAVISION HOLDINGS, LLC)
- KZMP-FM (101.7 FM; AZLE, TX; Owner: ENTRAVISION HOLDINGS, LLC)
- KESN (103.3 FM; ALLEN, TX; Owner: WBAP-KSCS OPERATING, LTD.)
- KSOC (94.5 FM; GAINESVILLE, TX; Owner: RADIO ONE LICENSES, LLC)
- KTPW (89.7 FM; SANGER, TX; Owner: RESEARCH EDUCATIONAL FOUNDATION, INC)
- KRNB (105.7 FM; DECATUR, TX; Owner: SERVICE BROADCASTING I, LTD.)
- KDKR (91.3 FM; DECATUR, TX; Owner: CSN INTERNATIONAL)
- KHCK-FM (99.1 FM; DENTON, TX; Owner: KHCK-FM LICENSE CORP.)
- KTCY (104.9 FM; PILOT POINT, TX; Owner: ENTRAVISION HOLDINGS, LLC)
- KLUV-FM (98.7 FM; DALLAS, TX; Owner: INFINITY BROADCASTING CORPORATION OF DALLAS)
- WRR (101.1 FM; DALLAS, TX; Owner: CITY OF DALLAS, TEXAS)
- KLLI (105.3 FM; DALLAS, TX; Owner: INFINITY BROADCASTING CORPORATION OF DALLAS)
- KHYI (95.3 FM; HOWE, TX; Owner: METRO BROADCASTERS - TEXAS, INC.)
- KWRD-FM (100.7 FM; HIGHLAND VILLAGE, TX; Owner: INSPIRATION MEDIA OF TEXAS, L.L.C.)
- KZPS (92.5 FM; DALLAS, TX; Owner: AMFM TEXAS LICENSES LIMITED PARTNERSHIP)
- KKDA-FM (104.5 FM; DALLAS, TX; Owner: SERVICE BROADCASTING I, LTD.)
TV broadcast stations around Denton:
- KLDT (Channel 55; LAKE DALLAS, TX; Owner: JOHNSON BROADCASTING OF DALLAS, INC.)
- KTVT (Channel 11; FORT WORTH, TX; Owner: CBS STATIONS GROUP OF TEXAS L.P.)
- KXAS-TV (Channel 5; FORT WORTH, TX; Owner: STATION VENTURE OPERATIONS, LP)
- KDTN (Channel 2; DENTON, TX; Owner: NORTH TEXAS PUBLIC BROADCASTING, INC.)
- KSTR-TV (Channel 49; IRVING, TX; Owner: TELEFUTURA DALLAS LLC)
- KTXA (Channel 21; FORT WORTH, TX; Owner: VIACOM TELEVISION STATIONS GROUP OF DALLAS/FORT WORTH L.P.)
- KUVN (Channel 23; GARLAND, TX; Owner: KUVN LICENSE PARTNERSHIP, L.P.)
- KMPX (Channel 29; DECATUR, TX; Owner: WORD OF GOD FELLOWSHIP, INC.)
- KPXD (Channel 68; ARLINGTON, TX; Owner: PAXSON DALLAS LICENSE, INC.)
- WFAA-TV (Channel 8; DALLAS, TX; Owner: WFAA-TV, L.P.)
- KERA-TV (Channel 13; DALLAS, TX; Owner: NORTH TEXAS PUBLIC BROADCASTING, INC.)
- KDFW (Channel 4; DALLAS, TX; Owner: KDFW LICENSE, INC.)
- KXTX-TV (Channel 39; DALLAS, TX; Owner: TELEMUNDO OF TEXAS PARTNERSHIP, LP)
- KDTX-TV (Channel 58; DALLAS, TX; Owner: TRINITY BROADCASTING OF TEXAS, INC.)
- KDAF (Channel 33; DALLAS, TX; Owner: TRIBUNE TELEVISION COMPANY)
- KDFI (Channel 27; DALLAS, TX; Owner: NEW DMIC, INC.)
- KFWD (Channel 52; FORT WORTH, TX; Owner: HIC BROADCAST, INC.)
- KLEG-LP (Channel 44; DALLAS, TX; Owner: DILIP VISWANATH)
- K26HF (Channel 26; BRITTON, TX; Owner: MAKO COMMUNICATIONS, LLC)
- KHPK-LP (Channel 28; DE SOTO, TX; Owner: MAKO COMMUNICATIONS, LLC)
- KJJM-LP (Channel 46; DALLAS/MESQUITE, TX; Owner: JANE McGINNIS)
- National Bridge Inventory (NBI) Statistics
- 296Number of bridges
- 3,894ft / 1,187mTotal length
- $742,000Total costs
- 4,491,088Total average daily traffic
- 543,508Total average daily truck traffic
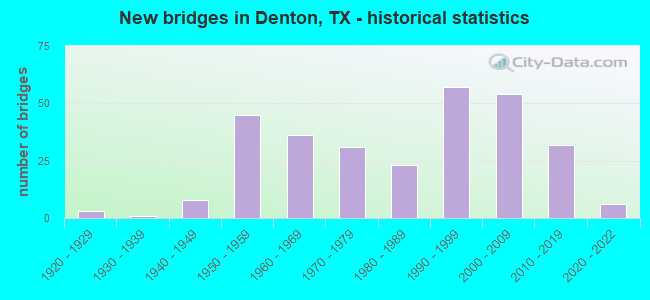
- New bridges - historical statistics
- 31920-1929
- 11930-1939
- 81940-1949
- 451950-1959
- 361960-1969
- 311970-1979
- 231980-1989
- 571990-1999
- 542000-2009
- 322010-2019
- 62020-2022
FCC Registered Commercial Land Mobile Towers: 3 (See the full list of FCC Registered Commercial Land Mobile Towers in Denton, TX)
FCC Registered Private Land Mobile Towers: 12 (See the full list of FCC Registered Private Land Mobile Towers)
FCC Registered Broadcast Land Mobile Towers: 93 (See the full list of FCC Registered Broadcast Land Mobile Towers)
FCC Registered Microwave Towers: 150 (See the full list of FCC Registered Microwave Towers in this town)
FCC Registered Paging Towers: 25 (See the full list of FCC Registered Paging Towers)
FCC Registered Maritime Coast & Aviation Ground Towers: 10 (See the full list of FCC Registered Maritime Coast & Aviation Ground Towers)
FCC Registered Amateur Radio Licenses: 851 (See the full list of FCC Registered Amateur Radio Licenses in Denton)
FAA Registered Aircraft Manufacturers and Dealers: 6 (See the full list of FAA Registered Manufacturers and Dealers in Denton)
FAA Registered Aircraft: 357 (See the full list of FAA Registered Aircraft)
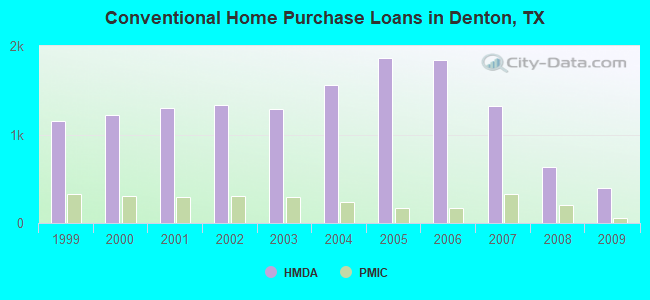
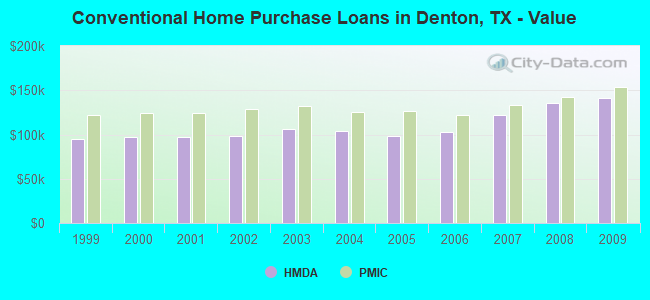
| Home Mortgage Disclosure Act Aggregated Statistics For Year 2009 (Based on 10 full and 8 partial tracts) | ||||||||||||||
| A) FHA, FSA/RHS & VA Home Purchase Loans | B) Conventional Home Purchase Loans | C) Refinancings | D) Home Improvement Loans | E) Loans on Dwellings For 5+ Families | F) Non-occupant Loans on < 5 Family Dwellings (A B C & D) | G) Loans On Manufactured Home Dwelling (A B C & D) | ||||||||
|---|---|---|---|---|---|---|---|---|---|---|---|---|---|---|
| Number | Average Value | Number | Average Value | Number | Average Value | Number | Average Value | Number | Average Value | Number | Average Value | Number | Average Value | |
| LOANS ORIGINATED | 419 | $144,496 | 400 | $141,035 | 866 | $158,297 | 35 | $72,371 | 12 | $672,362 | 140 | $113,713 | 10 | $37,553 |
| APPLICATIONS APPROVED, NOT ACCEPTED | 15 | $133,250 | 34 | $129,297 | 90 | $142,090 | 5 | $15,132 | 0 | $0 | 12 | $114,472 | 3 | $46,957 |
| APPLICATIONS DENIED | 42 | $132,324 | 64 | $127,207 | 262 | $147,744 | 51 | $29,319 | 3 | $3,700,937 | 33 | $112,880 | 14 | $31,900 |
| APPLICATIONS WITHDRAWN | 37 | $137,367 | 38 | $165,546 | 213 | $152,044 | 8 | $70,835 | 2 | $676,960 | 20 | $132,516 | 1 | $55,000 |
| FILES CLOSED FOR INCOMPLETENESS | 7 | $159,419 | 5 | $143,938 | 67 | $146,641 | 14 | $50,193 | 0 | $0 | 3 | $145,273 | 1 | $82,750 |
Detailed mortgage data for all 18 tracts in Denton, TX
| Private Mortgage Insurance Companies Aggregated Statistics For Year 2009 (Based on 9 full and 8 partial tracts) | ||||||
| A) Conventional Home Purchase Loans | B) Refinancings | C) Non-occupant Loans on < 5 Family Dwellings (A & B) | ||||
|---|---|---|---|---|---|---|
| Number | Average Value | Number | Average Value | Number | Average Value | |
| LOANS ORIGINATED | 55 | $153,758 | 54 | $159,265 | 1 | $45,630 |
| APPLICATIONS APPROVED, NOT ACCEPTED | 12 | $162,312 | 14 | $162,101 | 0 | $0 |
| APPLICATIONS DENIED | 6 | $157,880 | 9 | $155,380 | 0 | $0 |
| APPLICATIONS WITHDRAWN | 5 | $140,788 | 4 | $147,660 | 0 | $0 |
| FILES CLOSED FOR INCOMPLETENESS | 1 | $121,220 | 1 | $193,130 | 0 | $0 |
2002 - 2018 National Fire Incident Reporting System (NFIRS) incidents
- Fire incident types reported to NFIRS in Denton, TX
- 2,42244.7%Outside Fires
- 1,69731.3%Structure Fires
- 90116.6%Mobile Property/Vehicle Fires
- 4017.4%Other
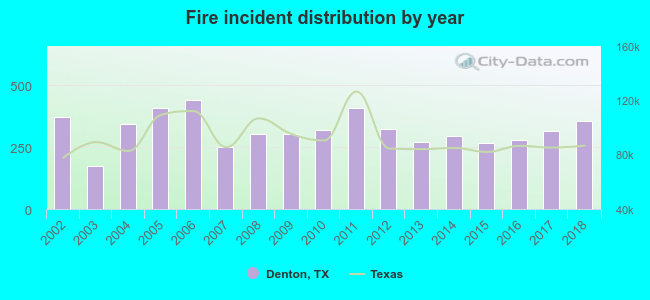 Based on the data from the years 2002 - 2018 the average number of fire incidents per year is 319. The highest number of reported fire incidents - 439 took place in 2006, and the least - 173 in 2003. The data has a decreasing trend.
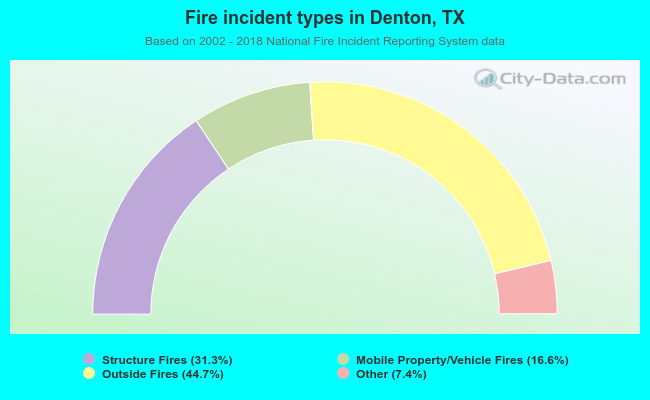 When looking into fire subcategories, the most incidents belonged to: Outside Fires (44.7%), and Structure Fires (31.3%).
Fire-safe hotels and motels in Denton, Texas:
- Radisson Hotel Denton, 2211 I-35e N, Denton, Texas 76205 , Phone: (940) 565-8499, Fax: (940) 384-2244
- Americas Best Value Inn & Suites, 820 S I-35 E, Denton, Texas 76205 , Phone: (940) 387-0591, Fax: (940) 566-0792
- Quality Inn & Suites, 1500 Dallas Dr, Denton, Texas 76205 , Phone: (940) 387-3511, Fax: (940) 387-7917
- Best Western Inn And Suites, 2910 W University Dr, Denton, Texas 76201 , Phone: (940) 591-7726, Fax: (940) 591-7736
- Fairfield Inn & Suites By Marriott, 2900 W University Dr, Denton, Texas 76201 , Phone: (940) 384-1700, Fax: (940) 384-1788
- Hampton Inn & Suites, 1513 Ctr Place Dr, Denton, Texas 76205 , Phone: (940) 891-4900, Fax: (940) 891-4433
- Springhill Suites by Marriott, 1434 Ctr Place Dr, Denton, Texas 76205 , Phone: (940) 383-4100, Fax: (940) 383-4110
- Value Place Hotel Denton, 4505 I-35, Denton, Texas 76207 , Phone: (940) 387-3400
- 13 other hotels and motels
| Most common first names in Denton, TX among deceased individuals | ||
| Name | Count | Lived (average) |
|---|---|---|
| Mary | 300 | 78.5 years |
| James | 288 | 70.9 years |
| William | 252 | 75.7 years |
| John | 237 | 73.9 years |
| Robert | 218 | 72.0 years |
| George | 146 | 76.7 years |
| Charles | 133 | 71.0 years |
| Ruth | 117 | 80.4 years |
| Thomas | 100 | 71.9 years |
| Margaret | 98 | 79.8 years |
| Most common last names in Denton, TX among deceased individuals | ||
| Last name | Count | Lived (average) |
|---|---|---|
| Smith | 155 | 76.2 years |
| Jones | 102 | 73.5 years |
| Williams | 98 | 75.0 years |
| Johnson | 94 | 71.9 years |
| Brown | 83 | 77.3 years |
| Davis | 81 | 74.4 years |
| Miller | 76 | 71.7 years |
| Taylor | 72 | 74.9 years |
| Wilson | 66 | 76.3 years |
| Harris | 65 | 72.6 years |
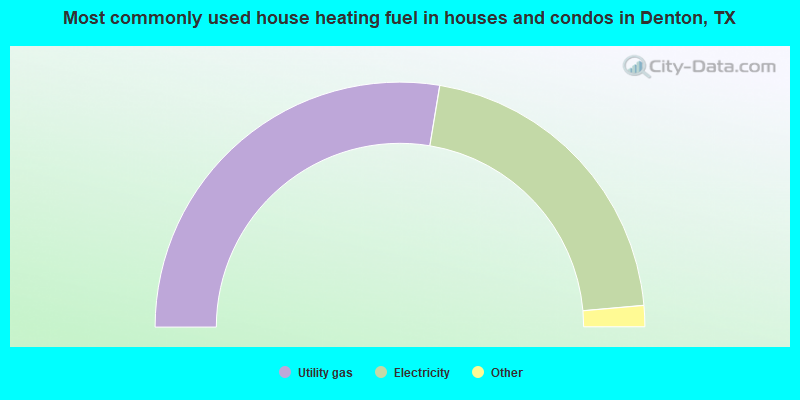
- 55.2%Utility gas
- 42.0%Electricity
- 1.6%Bottled, tank, or LP gas
- 0.6%Solar energy
- 0.3%Other fuel
- 0.2%Wood
- 0.1%No fuel used
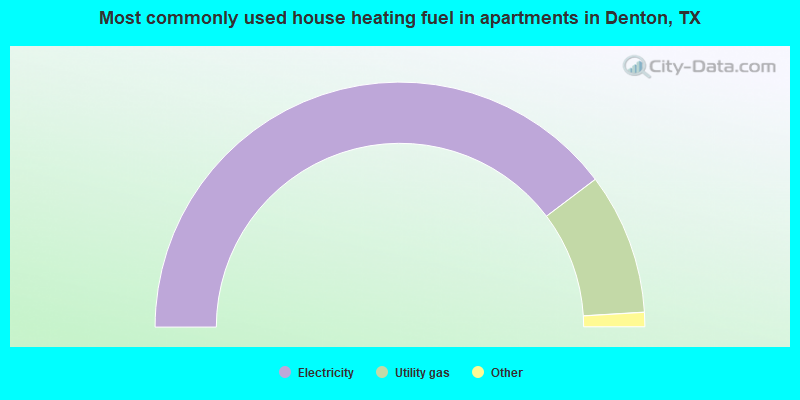
- 79.4%Electricity
- 18.7%Utility gas
- 1.2%Bottled, tank, or LP gas
- 0.5%No fuel used
- 0.2%Other fuel
Denton compared to Texas state average:
- Unemployed percentage below state average.
- Length of stay since moving in below state average.
- Number of college students significantly above state average.
- Percentage of population with a bachelor's degree or higher above state average.
Denton, TX compared to other similar cities:
Denton on our top lists:
- #18 on the list of "Top 101 cities with largest percentage of males in occupations: education, training, and library occupations (population 50,000+)"
- #27 on the list of "Top 101 cities with largest percentage of females in occupations: extraction workers (population 50,000+)"
- #27 on the list of "Top 101 cities with largest percentage of females in occupations: fishing and hunting, and forest and logging workers (population 50,000+)"
- #27 on the list of "Top 101 cities with largest percentage of females in industries: farm product raw materials merchant wholesalers (population 50,000+)"
- #28 on the list of "Top 101 cities with largest percentage of males in industries: broadcasting, internet publishing, and telecommunications services (population 50,000+)"
- #28 on the list of "Top 101 cities with largest percentage of females in industries: broadcasting, internet publishing, and telecommunications services (population 50,000+)"
- #28 on the list of "Top 101 cities with largest percentage of males in industries: wholesale electronic markets and agents and brokers (population 50,000+)"
- #28 on the list of "Top 101 cities with largest percentage of females in industries: wholesale electronic markets and agents and brokers (population 50,000+)"
- #29 on the list of "Top 101 cities with largest percentage of males in industries: educational services (population 50,000+)"
- #38 on the list of "Top 101 cities with the highest number of rapes per 100,000 residents, excludes tourist destinations and others with a lot of outsiders visiting based on city industries data (population 50,000+)"
- #39 on the list of "Top 101 cities with the highest ratio of rapes to murders between 2002 and 2012 (population 50,000+)"
- #42 on the list of "Top 100 cities with youngest residents (pop. 50,000+)"
- #52 on the list of "Top 101 cities with largest percentage of females in industries: educational services (population 50,000+)"
- #54 on the list of "Top 101 cities with largest percentage of males in occupations: personal care and service occupations (population 50,000+)"
- #55 on the list of "Top 101 cities with largest percentage of females in occupations: sales and related occupations (population 50,000+)"
- #56 on the list of "Top 101 cities with the largest percentage of people in schools, hospitals, or wards for the mentally retarded (population 1,000+)"
- #56 on the list of "Top 101 cities with the lowest percentage of family households, population 100,000+"
- #66 on the list of "Top 100 cities with highest percentage of college students (pop. 50,000+)"
- #68 on the list of "Top 101 cities with largest percentage of females in occupations: education, training, and library occupations (population 50,000+)"
- #68 on the list of "Top 101 cities with the largest percentage population increase from 2000 (population 50,000+)"
- #9 on the list of "Top 101 counties with the lowest number of deaths per 1000 residents 2007-2013 (pop. 50,000+)"
- #11 on the list of "Top 101 counties with the highest surface withdrawal of fresh water for public supply"
- #15 on the list of "Top 101 counties with the highest total withdrawal of fresh water for public supply"
- #19 on the list of "Top 101 counties with the largest number of children under 18 without health insurance coverage in 2000 (pop. 50,000+)"
- #33 on the list of "Top 101 counties with the most Evangelical Protestant adherents"

|
|
Total of 432 patent applications in 2008-2024.