Euless: Fire Incidents, Texas (TX)
Where are fire incidents reported in Euless, TX
Something went wrong! Please refresh the page.
| Fire incidents reported | |
|---|---|
| Sreet name | Count |
| MAIN ST | 284 |
| AIRPORT FWY | 246 |
| EULESS BLVD | 212 |
| ASH LA | 202 |
| MANCHESTER DR | 194 |
| INDUSTRIAL BLVD | 178 |
| MONTERREY BLVD | 174 |
| DEL PASO ST | 164 |
| HWY 121 | 138 |
| EL CAMINO REAL | 132 |
| HWY 360 | 118 |
| HARWOOD RD | 112 |
| FAIR OAKS BLVD | 96 |
| BEAR CREEK PKY | 88 |
| FULLER-WISER RD | 80 |
| DENTON DR | 72 |
| SOTOGRANDE BLVD | 72 |
| VILLA DR | 70 |
| VINE ST | 66 |
| SYCAMORE CIR | 64 |
| FULLERWISER RD | 62 |
| RAIDER DR | 62 |
| MARTHA ST | 56 |
| ECTOR DR | 54 |
| SAGEBRUSH TRL | 54 |
| WESTPARK WAY | 52 |
| WEST PIPELINE RD | 48 |
| MID-CITIES BLVD | 46 |
| PARK DR | 42 |
| INTERNATIONAL PARK | 40 |
2002 - 2018 National Fire Incident Reporting System (NFIRS) incidents
- Incident types reported to NFIRS in Euless, TX
- 19,54061.1%Rescue & EMS
- 3,0669.6%Fire
- 2,5488.0%Hazardous Condition
- 2,4447.6%Good Intent Call
- 2,3367.3%False Alarm
- 1,9096.0%Service Call
- 840.3%Special Incident
- 340.1%Overpressure Rupture
- Fire incident types reported to NFIRS in Euless, TX
- 1,50849.2%Structure Fires
- 1,09035.6%Outside Fires
- 43714.3%Mobile Property/Vehicle Fires
- 311.0%Other
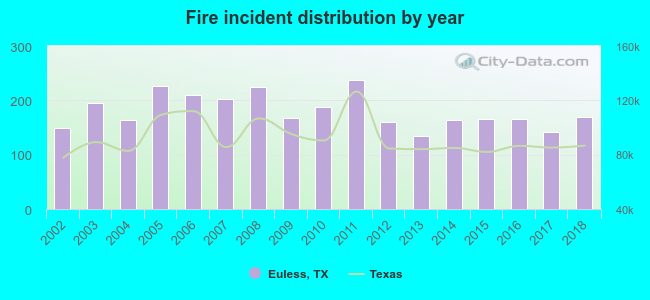 Based on the data from the years 2002 - 2018 the average number of fire incidents per year is 180. The highest number of fires - 237 took place in 2011, and the least - 135 in 2013. The data has a growing trend.
The average number of yearly fire incidents per 10k residents in Euless, TX compared to nearest cities:
(Note: Based on data for the last 3 years, including only cities with population 5,000 and above)
| Euless: | 29.7 |
| Bedford: | 29.2 |
| Colleyville: | 22.2 |
| Hurst: | 28.8 |
| Grapevine: | 35.5 |
| Irving: | 21.8 |
| North Richland Hills: | 22.3 |
| Southlake: | 28.4 |
| Richland Hills: | 17.8 |
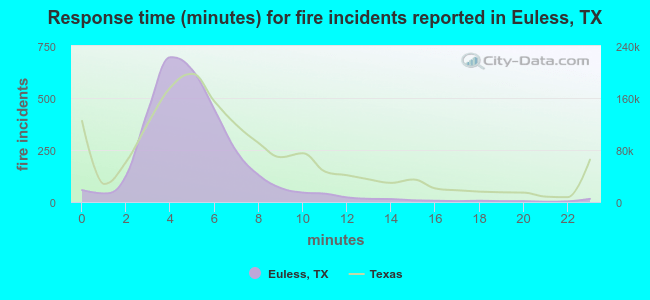 The median response time based on all reported fire incidents is 5 minutes. This is lower compared to the state median value.
The median response time in Euless, TX compared to nearest cities:
(Note: Based on data for all years, including only cities with at least 500 fire incidents)
| Euless: | 5 minutes |
| Bedford: | 4 minutes |
| Colleyville: | 7 minutes |
| Hurst: | 5 minutes |
| Grapevine: | 5 minutes |
| Irving: | 5 minutes |
| North Richland Hills: | 6 minutes |
| Southlake: | 6 minutes |
| Richland Hills: | 5 minutes |
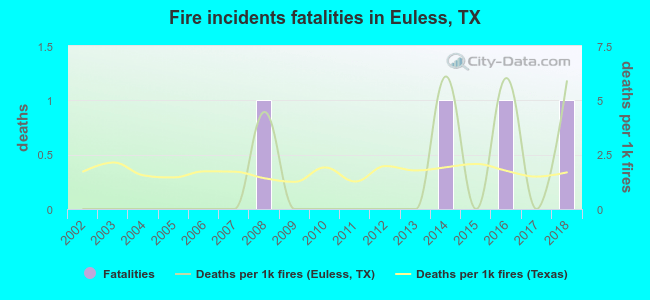 According to the reports from the years 2002 - 2018 the average number of fire-related yearly deaths is 0. The highest number of deaths - 1 took place in 2008, and the lowest - 0 in 2002. The data has an increasing trend.
The average number of fatalities per 1,000 fires is 1. This indicator was the highest - 6 in 2014, and the lowest 0 in 2002. The trend for fatalities per 1,000 incidents is growing. Compared to the Texas value the number of deaths per 1,000 incidents is lower.
According to the reports from the years 2002 - 2018 the average number of fire-related yearly deaths is 0. The highest number of deaths - 1 took place in 2008, and the lowest - 0 in 2002. The data has an increasing trend.
The average number of fatalities per 1,000 fires is 1. This indicator was the highest - 6 in 2014, and the lowest 0 in 2002. The trend for fatalities per 1,000 incidents is growing. Compared to the Texas value the number of deaths per 1,000 incidents is lower.Deaths per 1,000 incidents in Euless, TX compared to nearest cities:
(Note: Based on data for all years, including only cities with at least 2,500 fire incidents)
| Euless: | 1.3 |
| Bedford: | 1.5 |
| Grapevine: | 0.6 |
| Irving: | 0.7 |
| Arlington: | 1.9 |
| Grand Prairie: | 3.9 |
| Haltom City: | 1.4 |
| Lewisville: | 2.2 |
| Carrollton: | 1.7 |
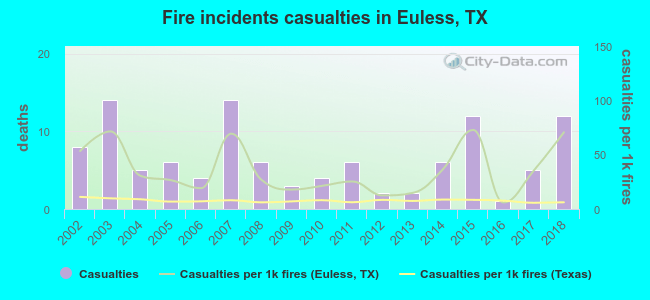 Based on the reports from the years 2002 - 2018 the average number of fire-related casualties per year is 6. The highest number of reported injuries - 14 took place in 2003, and the lowest - 1 in 2016. The data has a rising trend.
The average number of injuries per 1,000 fire incidents is 36. This indicator was the highest - 73 in 2015, and the lowest 6 in 2016. The trend for injuries per 1,000 fire incidents is increasing. Compared to the state value the number of injuries per 1,000 incidents is much higher.
Based on the reports from the years 2002 - 2018 the average number of fire-related casualties per year is 6. The highest number of reported injuries - 14 took place in 2003, and the lowest - 1 in 2016. The data has a rising trend.
The average number of injuries per 1,000 fire incidents is 36. This indicator was the highest - 73 in 2015, and the lowest 6 in 2016. The trend for injuries per 1,000 fire incidents is increasing. Compared to the state value the number of injuries per 1,000 incidents is much higher.Casualties per 1,000 incidents in Euless, TX compared to nearest cities:
(Note: Based on data for all years, including only cities with at least 500 fire incidents)
| Euless: | 35.9 |
| Bedford: | 30.9 |
| Colleyville: | 2.2 |
| Hurst: | 8.2 |
| Grapevine: | 9.2 |
| Irving: | 7.0 |
| North Richland Hills: | 23.5 |
| Southlake: | 2.4 |
| Richland Hills: | 9.8 |
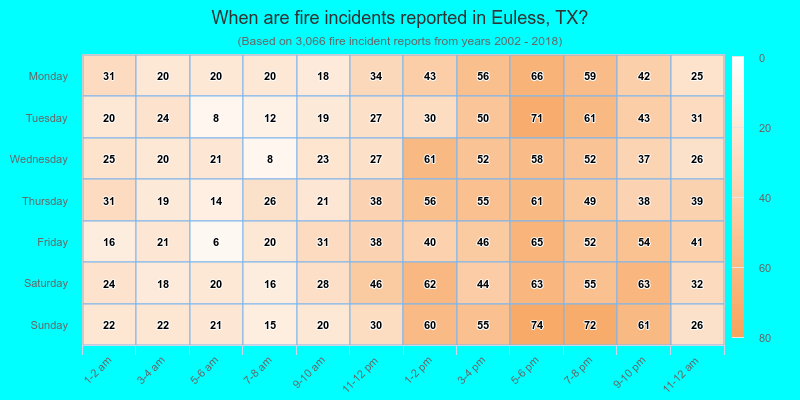
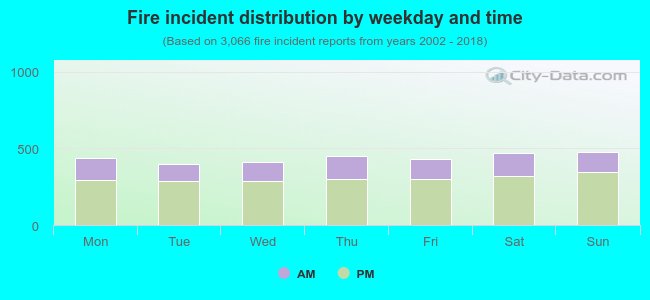 30.7% incidents where reported in the morning and 69.3% in the evening. The most fires (15.6%) took place on Sunday, and the least (12.9%) on Tuesday.
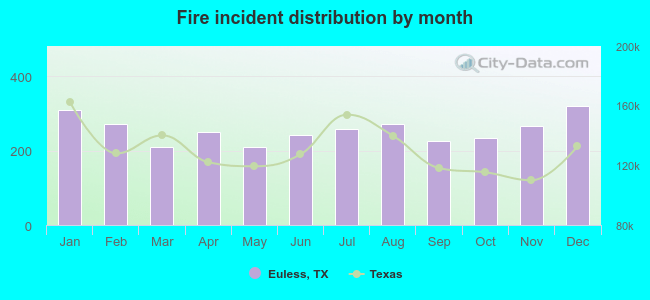 Based on the 3,066 reports from years 2002 - 2018 most fires (10.5%) took place during December, and the least (6.8%) in March.
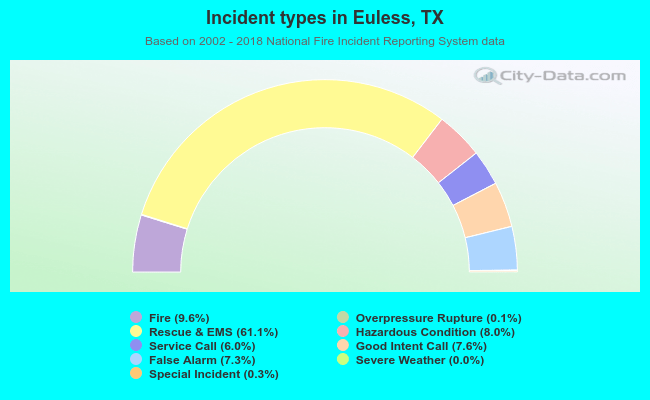 Out of all 31,968 cases reported during the years 2002 - 2018, the most belonged to the categories: Rescue & EMS (61.1%), Fire (9.6%), and Hazardous Condition (8.0%).
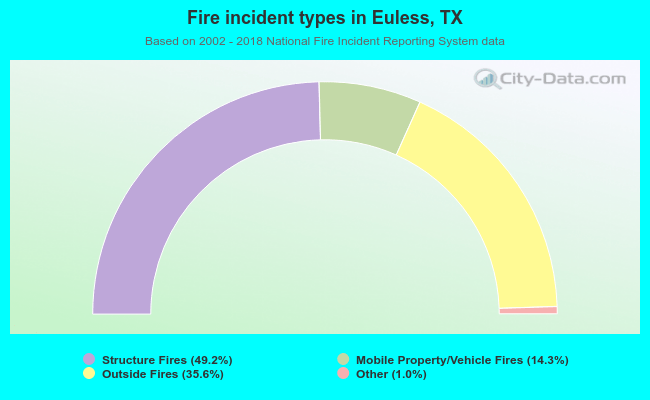 When looking into fire subcategories, the most incidents belonged to: Structure Fires (49.2%), and Outside Fires (35.6%).