Elkhorn: Fire Incidents, Wisconsin (WI)
Where are fire incidents reported in Elkhorn, WI
Something went wrong! Please refresh the page.
|
| |||||||||||||||||||||||||||||||||||||||||||||||||||||||||||||||||||||||||||||||||||||||||||||||||||||||||||||
2002 - 2018 National Fire Incident Reporting System (NFIRS) incidents
- Incident types reported to NFIRS in Elkhorn, WI
- 87229.7%Fire
- 83628.5%Rescue & EMS
- 67423.0%False Alarm
- 47816.3%Hazardous Condition
- 491.7%Good Intent Call
- 220.7%Service Call
- 40.1%Special Incident
- Fire incident types reported to NFIRS in Elkhorn, WI
- 45952.6%Structure Fires
- 26129.9%Outside Fires
- 14416.5%Mobile Property/Vehicle Fires
- 80.9%Other
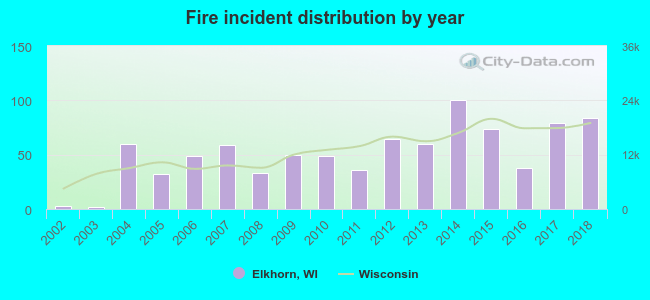 Based on the data from the years 2002 - 2018 the average number of fires per year is 51. The highest number of fires - 100 took place in 2014, and the least - 2 in 2003. The data has a growing trend.
The average number of yearly fire incidents per 10k residents in Elkhorn, WI compared to nearest cities:
(Note: Based on data for the last 3 years, including only cities with population 5,000 and above)
| Elkhorn: | 67.2 |
| Delavan: | 57.2 |
| Lake Geneva: | 91.7 |
| Bloomfield: | 3.2 |
| Burlington: | 117.3 |
| Whitewater: | 38.1 |
| Mukwonago: | 61.4 |
| Twin Lakes: | 47.0 |
| Waterford: | 79.1 |
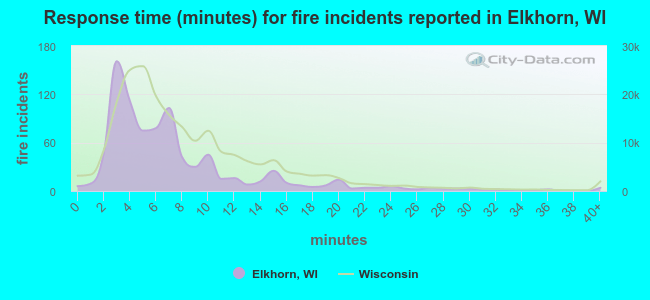 The median response time based on all reported fire incidents is 6 minutes. This is comparable to the state median value.
The median response time in Elkhorn, WI compared to nearest cities:
(Note: Based on data for all years, including only cities with at least 500 fire incidents)
| Elkhorn: | 6 minutes |
| Delavan: | 7 minutes |
| Lake Geneva: | 8 minutes |
| Burlington: | 9 minutes |
| Whitewater: | 11 minutes |
| Harvard: | 9 minutes |
| Richmond: | 6 minutes |
| Spring Grove: | 6 minutes |
| Wonder Lake: | 7 minutes |
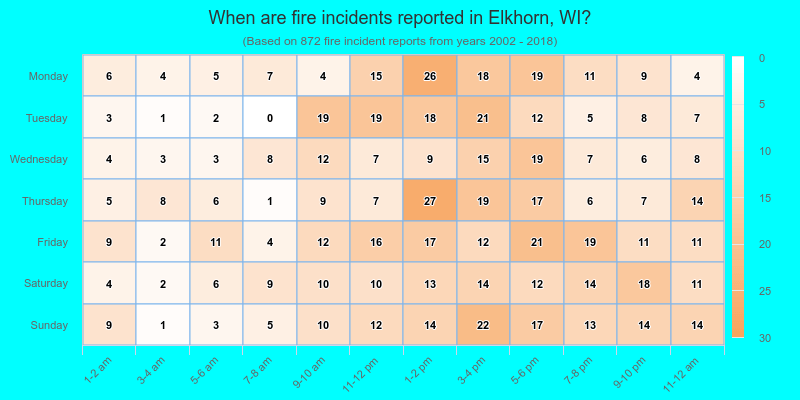
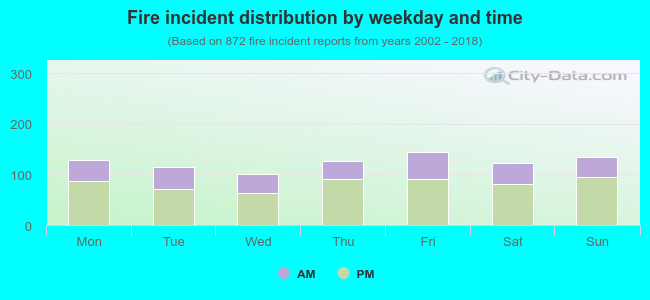 33.6% incidents where reported in the morning and 66.4% in the evening. The most fires (16.6%) took place on Friday, and the least (11.6%) on Wednesday.
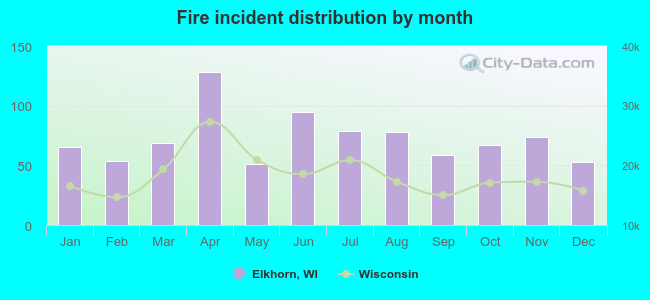 According to the 872 incident reports from years 2002 - 2018 most fires (14.7%) took place during April, and the least (5.8%) in May.
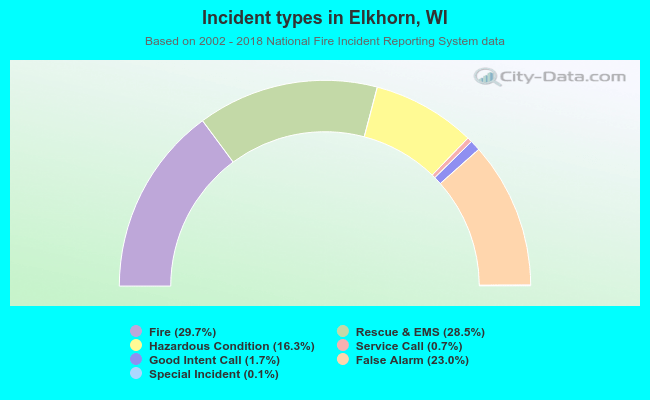 Out of all 2,935 cases reported during the years 2002 - 2018, the most belonged to the categories: Fire (29.7%), Overpressure Rupture (28.5%), and Good Intent Call (23.0%).
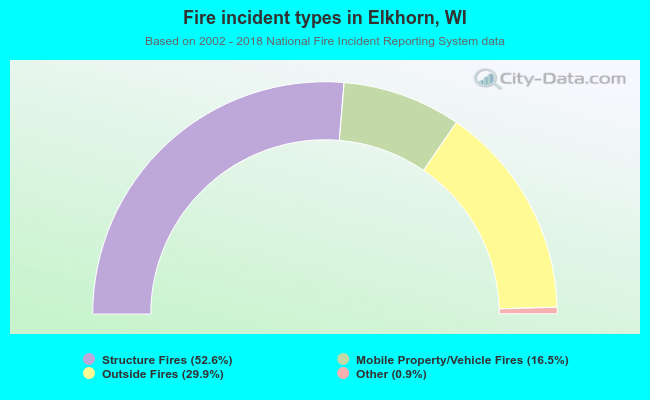 When looking into fire subcategories, the most incidents belonged to: Structure Fires (52.6%), and Outside Fires (29.9%).