Twin Lakes: Fire Incidents, Wisconsin (WI)
Where are fire incidents reported in Twin Lakes, WI
Something went wrong! Please refresh the page.
|
| |||||||||||||||||||||||||||||||||||||||||||||||||||||||||||||||||||||||||||||||||||||||||||||||||||||||||||||
2002 - 2018 National Fire Incident Reporting System (NFIRS) incidents
- Incident types reported to NFIRS in Twin Lakes, WI
- 28228.8%Hazardous Condition
- 27127.7%Fire
- 24925.4%Rescue & EMS
- 838.5%False Alarm
- 535.4%Service Call
- 424.3%Good Intent Call
- Fire incident types reported to NFIRS in Twin Lakes, WI
- 11743.2%Structure Fires
- 9735.8%Outside Fires
- 3312.2%Other
- 248.9%Mobile Property/Vehicle Fires
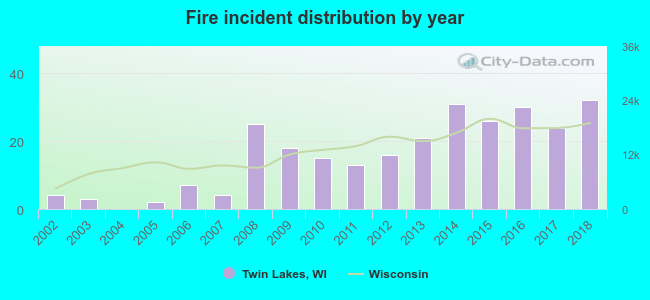 Based on the data from the years 2002 - 2018 the average number of fires per year is 16. The highest number of reported fires - 32 took place in 2018, and the least - 0 in 2004. The data has a growing trend.
The average number of yearly fire incidents per 10k residents in Twin Lakes, WI compared to nearest cities:
(Note: Based on data for the last 3 years, including only cities with population 5,000 and above)
| Twin Lakes: | 47.0 |
| Bloomfield: | 3.2 |
| Salem: | 27.3 |
| Lake Geneva: | 91.7 |
| Burlington: | 117.3 |
| Waterford: | 79.1 |
| Elkhorn: | 67.2 |
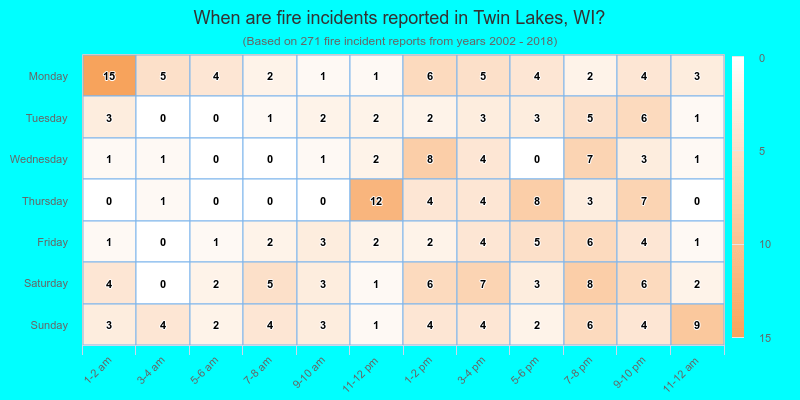
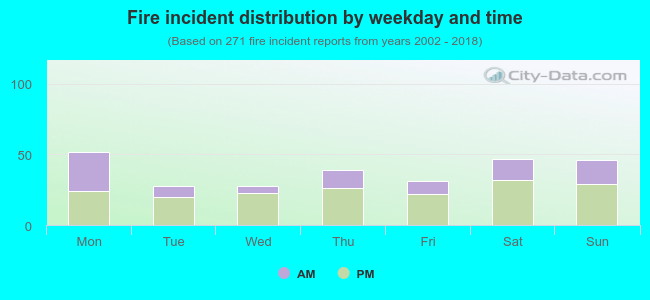 35.1% incidents where reported in the morning and 64.9% in the evening. The most fires (19.2%) took place on Monday, and the least (10.3%) on Tuesday.
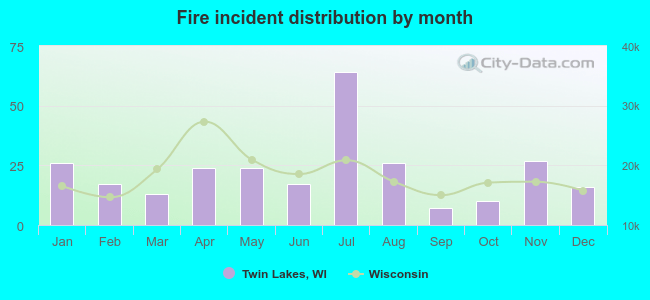 Based on the 271 fire incident reports from years 2002 - 2018 most fires (23.6%) took place during July, and the least (2.6%) in September.
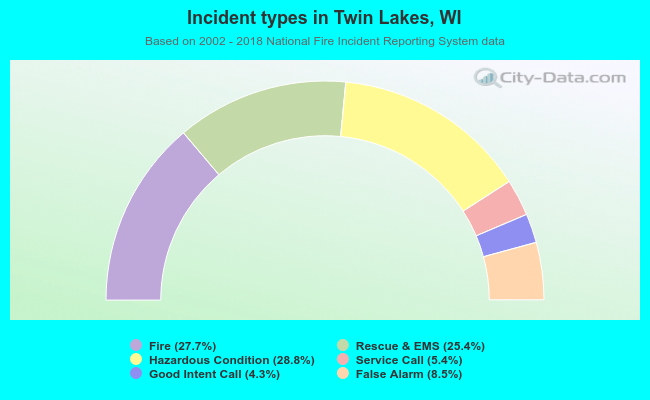 Out of all 980 cases reported during the years 2002 - 2018, the most belonged to the categories: Rescue & EMS (28.8%), Fire (27.7%), and Overpressure Rupture (25.4%).
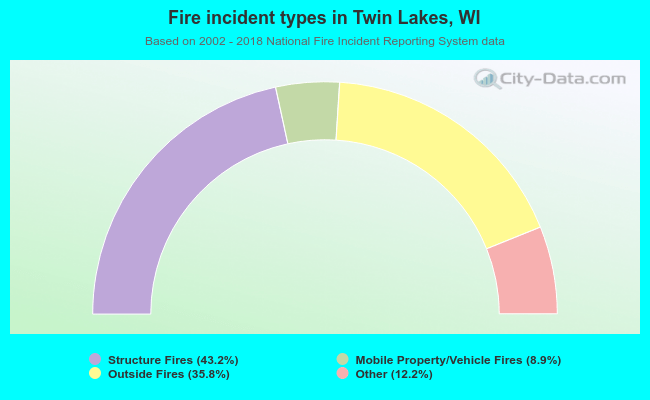 When looking into fire subcategories, the most incidents belonged to: Structure Fires (43.2%), and Outside Fires (35.8%).