Enterprise: Fire Incidents, Alabama (AL)
Where are fire incidents reported in Enterprise, AL
Something went wrong! Please refresh the page.
| Fire incidents reported | |
|---|---|
| Sreet name | Count |
| BOLL WEEVIL CIR | 517 |
| RUCKER BLVD | 378 |
| MAIN ST | 221 |
| PARK AVE | 177 |
| GLOVER AVE | 136 |
| PLAZA DR | 126 |
| LEE ST | 115 |
| SHELLFIELD RD | 109 |
| DIXIE DR | 106 |
| APACHEE DR | 91 |
| GENEVA HWY | 91 |
| DALEVILLE AVE | 82 |
| BELL ST | 78 |
| OUIDA ST | 76 |
| ADAMS ST | 66 |
| HWY 134 | 61 |
| COPPINVILLE RD | 60 |
| PLEDGER ST | 55 |
| DAMASCUS RD | 52 |
| CINEMA DR | 51 |
| COLLEGE ST | 51 |
| BRIARWOOD DR | 50 |
| GRIMES ST | 48 |
| APACHE DR | 45 |
| CARROLL ST | 43 |
| WATTS ST | 43 |
| BELLWOOD RD | 41 |
| HWY 27 | 39 |
| HILDRETH ST | 37 |
| VILLA DR | 36 |
2002 - 2018 National Fire Incident Reporting System (NFIRS) incidents
- Incident types reported to NFIRS in Enterprise, AL
- 10,47862.3%Rescue & EMS
- 1,79310.7%Fire
- 1,69510.1%Service Call
- 1,4218.5%Good Intent Call
- 7214.3%False Alarm
- 6013.6%Hazardous Condition
- 730.4%Special Incident
- Fire incident types reported to NFIRS in Enterprise, AL
- 74041.3%Outside Fires
- 59533.2%Structure Fires
- 29116.2%Mobile Property/Vehicle Fires
- 1679.3%Other
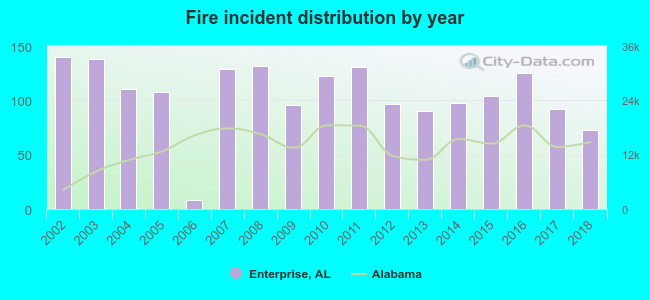 Based on the data from the years 2002 - 2018 the average number of fire incidents per year is 105. The highest number of reported fires - 140 took place in 2002, and the least - 8 in 2006. The data has a dropping trend.
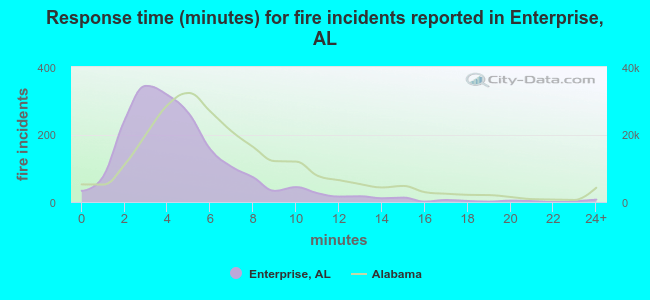 The median response time based on all reported fire incidents is 4 minutes. This is lower compared to the state median value.
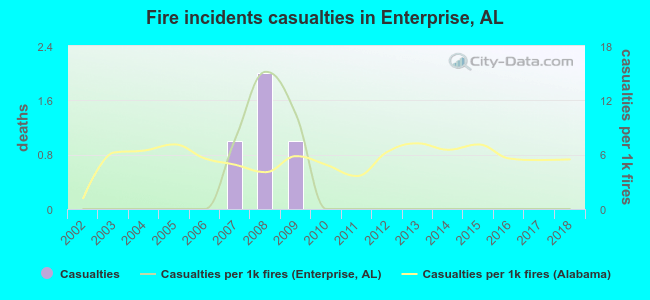 According to the data from the years 2002 - 2018 the average number of fire-related casualties per year is 0. The highest number of reported casualties - 2 took place in 2008, and the lowest - 0 in 2002. The data has a constant trend.
The average number of casualties per 1,000 fires is 2. This indicator was the highest - 15 in 2008, and the lowest 0 in 2002. The trend for injuries per 1,000 incidents is constant. Compared to the state value the number of injuries per 1,000 incidents is much lower.
According to the data from the years 2002 - 2018 the average number of fire-related casualties per year is 0. The highest number of reported casualties - 2 took place in 2008, and the lowest - 0 in 2002. The data has a constant trend.
The average number of casualties per 1,000 fires is 2. This indicator was the highest - 15 in 2008, and the lowest 0 in 2002. The trend for injuries per 1,000 incidents is constant. Compared to the state value the number of injuries per 1,000 incidents is much lower.
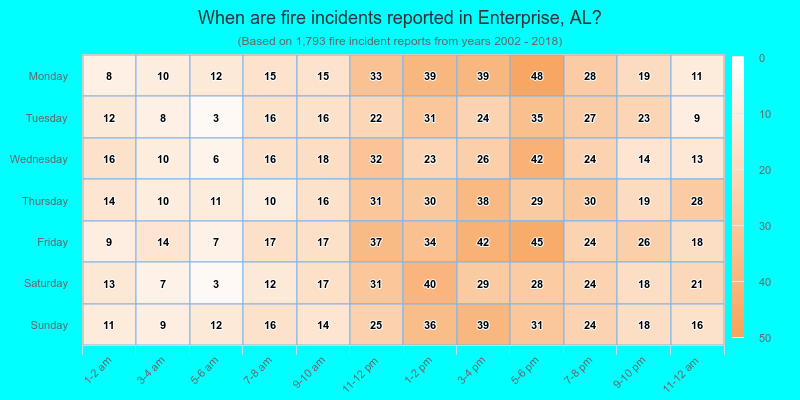
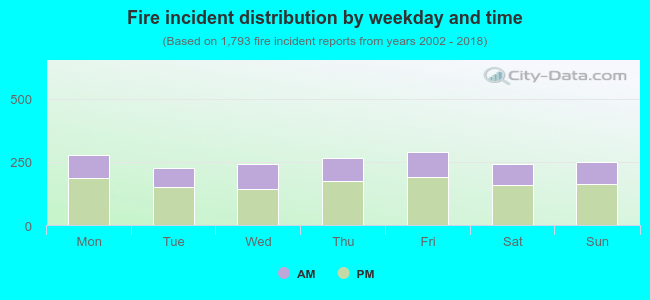 35.2% incidents where reported in the morning and 64.8% in the evening. The most fires (16.2%) took place on Friday, and the least (12.6%) on Tuesday.
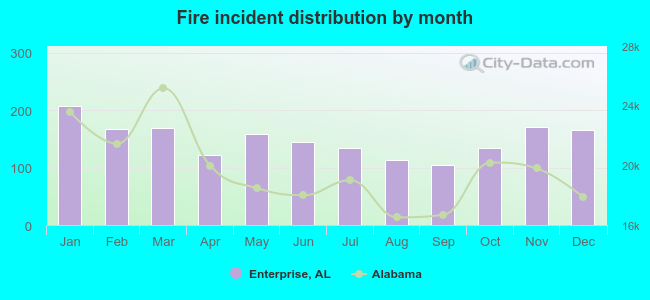 Based on the 1,793 incident reports from years 2002 - 2018 most fires (11.6%) took place during January, and the least (5.8%) in September.
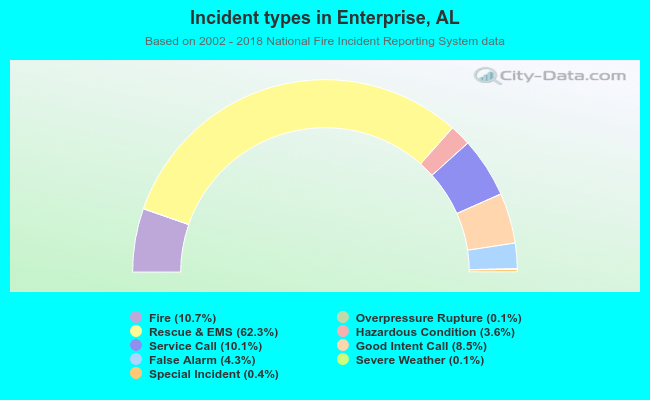 Out of all 16,806 cases reported during the years 2002 - 2018, the most belonged to the categories: Rescue & EMS (62.3%), Fire (10.7%), and Service Call (10.1%).
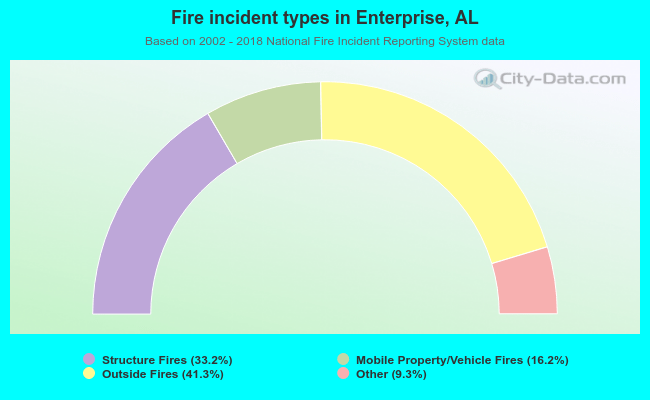 When looking into fire subcategories, the most reports belonged to: Outside Fires (41.3%), and Structure Fires (33.2%).