Exeter: Fire Incidents, California (CA)
Where are fire incidents reported in Exeter, CA
Something went wrong! Please refresh the page.
|
| |||||||||||||||||||||||||||||||||||||||||||||||||||||||||||||||||||||||||||||||||||||||||||||||||||||||||||||
2005 - 2018 National Fire Incident Reporting System (NFIRS) incidents
- Incident types reported to NFIRS in Exeter, CA
- 3,72063.2%Rescue & EMS
- 82914.1%Fire
- 5218.8%Good Intent Call
- 4267.2%Service Call
- 2143.6%Hazardous Condition
- 1532.6%False Alarm
- 190.3%Special Incident
- 60.1%Overpressure Rupture
- Fire incident types reported to NFIRS in Exeter, CA
- 41750.3%Outside Fires
- 24829.9%Structure Fires
- 11914.4%Mobile Property/Vehicle Fires
- 455.4%Other
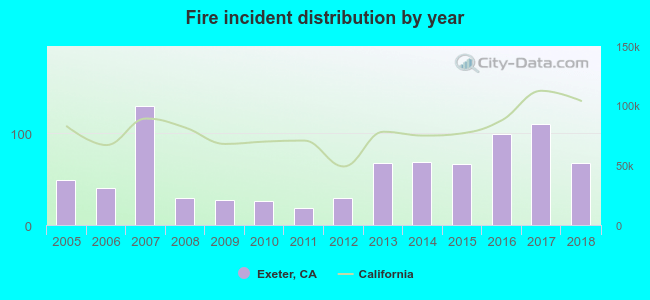 Based on the data from the years 2005 - 2018 the average number of fires per year is 59. The highest number of reported fires - 130 took place in 2007, and the least - 19 in 2011. The data has an increasing trend.
The average number of yearly fire incidents per 10k residents in Exeter, CA compared to nearest cities:
(Note: Based on data for the last 3 years, including only cities with population 5,000 and above)
| Exeter: | 87.5 |
| Farmersville: | 36.5 |
| Lindsay: | 35.6 |
| Woodlake: | 77.9 |
| Visalia: | 41.3 |
| Tulare: | 50.4 |
| Porterville: | 54.1 |
| Cutler: | 47.3 |
| Orosi: | 42.0 |
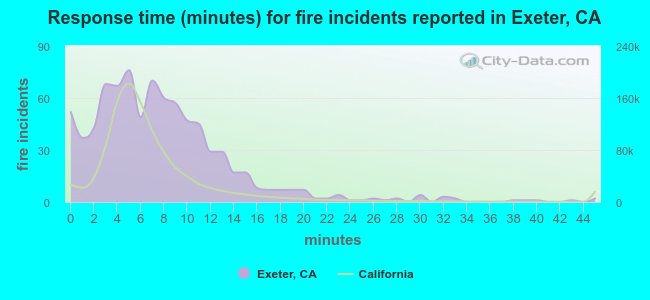 The median response time based on all reported fire incidents is 7 minutes. This is close to the state median value.
The median response time in Exeter, CA compared to nearest cities:
(Note: Based on data for all years, including only cities with at least 500 fire incidents)
| Exeter: | 7 minutes |
| Farmersville: | 5 minutes |
| Lindsay: | 8 minutes |
| Woodlake: | 7 minutes |
| Visalia: | 6 minutes |
| Tulare: | 5 minutes |
| Porterville: | 5 minutes |
| Dinuba: | 5 minutes |
| Orange Cove: | 5 minutes |
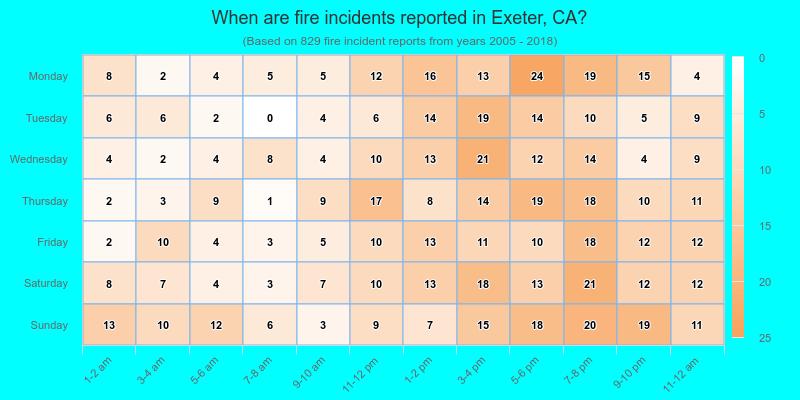
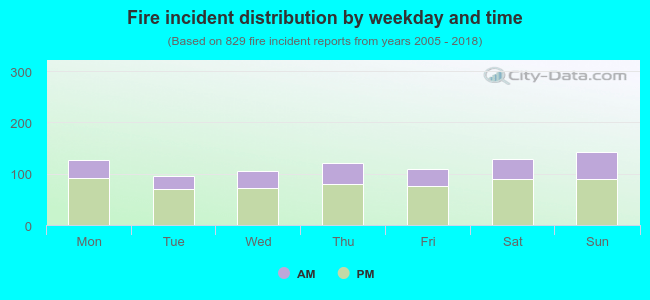 31.2% incidents where reported in the morning and 68.8% in the evening. The most fires (17.2%) took place on Sunday, and the least (11.5%) on Tuesday.
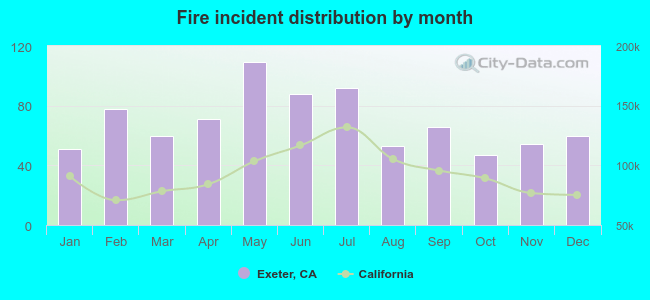 Based on the 829 fires from years 2005 - 2018 most fires (13.1%) took place during May, and the least (5.7%) in October.
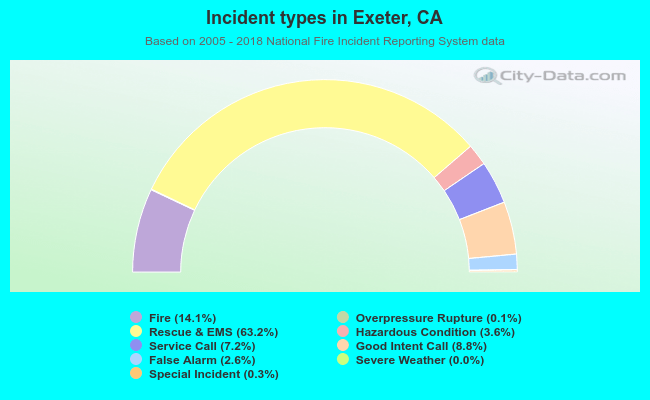 Out of all 5,890 cases reported during the years 2005 - 2018, the most belonged to the categories: Rescue & EMS (63.2%), Fire (14.1%), and Good Intent Call (8.8%).
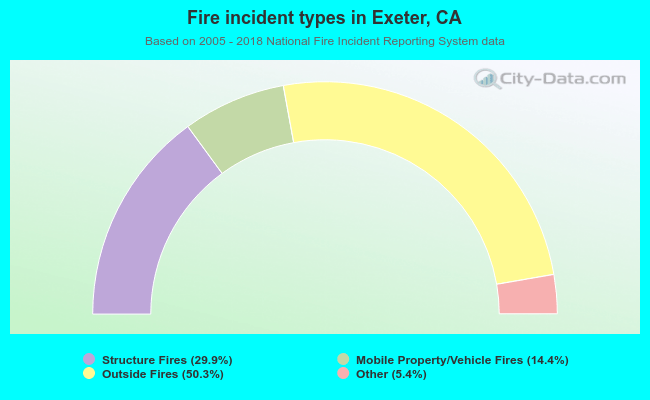 When looking into fire subcategories, the most incidents belonged to: Outside Fires (50.3%), and Structure Fires (29.9%).