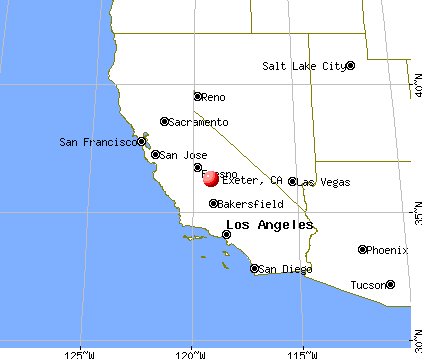
Exeter, California
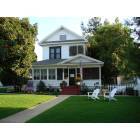
Exeter: 1909 farmhouse @ 524 W Firebaugh Ave
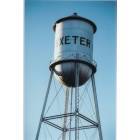
Exeter: Exeter Water Tower

Exeter
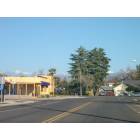
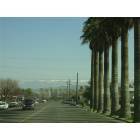
Exeter: Driving out to East meets West
Exeter: Enteringcity of Exeter
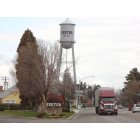
Exeter: View of Exeter with Sierra Nevada Mountains in the background
- add
your
Submit your own pictures of this city and show them to the world
- OSM Map
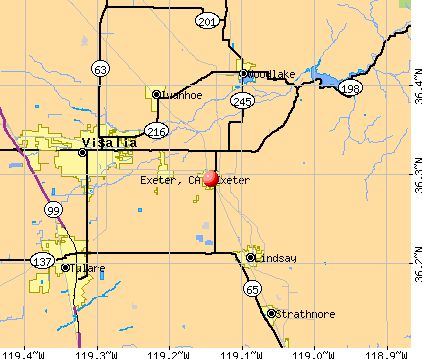
- General Map
- Google Map
- MSN Map
Population change since 2000: +12.0%
 |
| Males: 4,825 | |
| Females: 5,442 |
| Median resident age: | 32.8 years |
| California median age: | 37.9 years |
Zip codes: 93221.
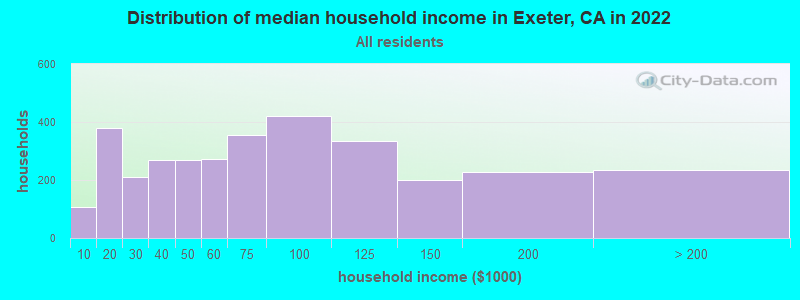
| Exeter: | $66,003 |
| CA: | $91,551 |
Estimated per capita income in 2022: $27,722 (it was $13,795 in 2000)
Exeter city income, earnings, and wages data
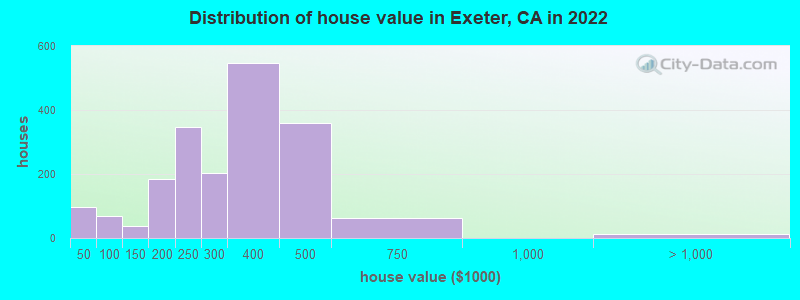
Estimated median house or condo value in 2022: $286,499 (it was $94,800 in 2000)
| Exeter: | $286,499 |
| CA: | $715,900 |
Mean prices in 2022: all housing units: $305,638; detached houses: $331,158; mobile homes: $46,392
Median gross rent in 2022: $1,245.
(11.8% for White Non-Hispanic residents, 33.3% for Black residents, 25.6% for Hispanic or Latino residents, 15.3% for American Indian residents, 36.5% for other race residents, 5.1% for two or more races residents)
Detailed information about poverty and poor residents in Exeter, CA

Compare current foreclosures near Exeter, CA:
| Photo | Address | Area | Beds / Baths | Price | Details |
|---|---|---|---|---|---|

|
#1
Lenox Ave
Exeter, CA 93221
|
1,502 sq. feet
|
2 baths 3 beds |
show details | |

|
#2
S C St
Exeter, CA 93221
|
868 sq. feet
|
1 baths 2 beds |
show details | |

|
#3
Whittier Ct
Exeter, CA 93221
|
1,240 sq. feet
|
2 baths 3 beds |
show details | |

|
#4
W Willow St
Exeter, CA 93221
|
680 sq. feet
|
1 baths 2 beds |
show details | |

|
#5
Road 182
Exeter, CA 93221
|
- sq. feet
|
2 baths 3 beds |
show details | |

|
#6
W Maple St
Exeter, CA 93221
|
1,000 sq. feet
|
2 baths 3 beds |
show details | |

|
#7
W Firebaugh Ave
Exeter, CA 93221
|
1,375 sq. feet
|
2 baths 3 beds |
show details | |

|
#8
Hannah Ave
Exeter, CA 93221
|
1,410 sq. feet
|
2 baths 3 beds |
show details | |

|
#9
Hannah Ave
Exeter, CA 93221
|
1,158 sq. feet
|
2 baths 3 beds |
show details | |

|
#10
N Belmont Rd
Exeter, CA 93221
|
- sq. feet
|
- baths - beds |
show details |
| Photo | Address | Area | Beds / Baths | Price | Details |
|---|---|---|---|---|---|

|
#11
Vine St
Exeter, CA 93221
|
1,468 sq. feet
|
- baths - beds |
show details | |

|
#12
Monarch Cir Apt 1
Exeter, CA 93221
|
- sq. feet
|
- baths - beds |
show details | |

|
#13
S Kaweah Ave
Exeter, CA 93221
|
- sq. feet
|
- baths - beds |
show details | |

|
#14
Vine St # 4
Exeter, CA 93221
|
- sq. feet
|
- baths - beds |
show details | |

|
#15
W Pine St
Exeter, CA 93221
|
- sq. feet
|
- baths - beds |
show details | |

|
#16
Peach St
Exeter, CA 93221
|
1,200 sq. feet
|
- baths - beds |
show details | |

|
#17
N Palm St
Woodlake, CA 93286
|
1,423 sq. feet
|
2 baths 3 beds |
show details | |

|
#18
W Oakland Ave
Tulare, CA 93274
|
1,066 sq. feet
|
1 baths 3 beds |
show details | |

|
#19
Capistrano Ave
Tulare, CA 93274
|
1,825 sq. feet
|
2 baths 5 beds |
show details | |

|
#20
E Douglas Ave
Visalia, CA 93292
|
1,795 sq. feet
|
2 baths 3 beds |
show details |
| Photo | Address | Area | Beds / Baths | Price | Details |
|---|---|---|---|---|---|

|
#21
E Monte Verde Ave
Visalia, CA 93292
|
1,815 sq. feet
|
2 baths 3 beds |
show details | |

|
#22
W Thurman Ave
Porterville, CA 93257
|
2,195 sq. feet
|
2 baths 3 beds |
show details | |

|
#23
E Lindmore St
Lindsay, CA 93247
|
4,083 sq. feet
|
2 baths 3 beds |
show details | |

|
#24
N Pinkham St
Visalia, CA 93292
|
1,032 sq. feet
|
2 baths 2 beds |
show details | |

|
#25
W Whitendale Ave
Visalia, CA 93277
|
1,885 sq. feet
|
2 baths 3 beds |
show details | |

|
#26
S Verde Vista St
Visalia, CA 93277
|
1,580 sq. feet
|
2 baths 3 beds |
show details | |

|
#27
Delaware Ct
Tulare, CA 93274
|
1,242 sq. feet
|
2 baths 3 beds |
show details | |

|
#28
Santa Maria Ave
Porterville, CA 93257
|
1,932 sq. feet
|
2 baths 4 beds |
show details | |

|
#29
W Wren Ave
Visalia, CA 93291
|
1,105 sq. feet
|
2 baths 3 beds |
show details | |

|
#30
Harvest Ave
Goshen, CA 93227
|
1,177 sq. feet
|
2 baths 3 beds |
show details |
| Photo | Address | Area | Beds / Baths | Price | Details |
|---|---|---|---|---|---|

|
#31
W Thurman Ave
Porterville, CA 93257
|
3,157 sq. feet
|
3 baths 3 beds |
show details | |

|
#32
N Jacob St
Visalia, CA 93291
|
1,211 sq. feet
|
2 baths 3 beds |
show details | |

|
#33
S Crenshaw St
Visalia, CA 93277
|
2,148 sq. feet
|
2 baths 4 beds |
show details | |

|
#34
W Sunnyview Ave
Visalia, CA 93291
|
2,289 sq. feet
|
2 baths 4 beds |
show details | |

|
#35
Chardonnay Ct
Tulare, CA 93274
|
2,018 sq. feet
|
2 baths 4 beds |
show details | |

|
#36
W Royal Oaks Dr
Visalia, CA 93277
|
1,940 sq. feet
|
2 baths 3 beds |
show details | |

|
#37
Anderson Ave
Tulare, CA 93274
|
1,881 sq. feet
|
2 baths 5 beds |
show details | |

|
#38
Vista Ave
Strathmore, CA 93267
|
632 sq. feet
|
1 baths 2 beds |
show details | |

|
#39
W Delta Ave
Visalia, CA 93291
|
1,582 sq. feet
|
2 baths 3 beds |
show details | |

|
#40
S Whitney Dr
Visalia, CA 93277
|
1,779 sq. feet
|
2 baths 3 beds |
show details |
| Photo | Address | Area | Beds / Baths | Price | Details |
|---|---|---|---|---|---|

|
#41
W Cornell Ave
Visalia, CA 93277
|
1,380 sq. feet
|
2 baths 3 beds |
show details | |

|
#42
N Oakwood Ct
Visalia, CA 93291
|
2,076 sq. feet
|
2 baths 4 beds |
show details | |

|
#43
S Peggy St
Tulare, CA 93274
|
1,519 sq. feet
|
2 baths 3 beds |
show details | |

|
#44
W Dorothea Ave
Visalia, CA 93277
|
1,336 sq. feet
|
1 baths 3 beds |
show details | |

|
#45
W Northgrand Ave
Porterville, CA 93257
|
1,879 sq. feet
|
1 baths 3 beds |
show details | |

|
#46
S Silva St
Tulare, CA 93274
|
1,215 sq. feet
|
2 baths 3 beds |
show details | |

|
#47
W Castle Ave
Porterville, CA 93257
|
1,377 sq. feet
|
2 baths 3 beds |
show details | |

|
#48
W Judy Ct
Visalia, CA 93277
|
1,633 sq. feet
|
2 baths 3 beds |
show details | |

|
#49
W Packwood Dr
Visalia, CA 93277
|
- sq. feet
|
2 baths 3 beds |
show details | |

|
Check over 1 million property listings on Foreclosure.com!
|
browse all offers | |||


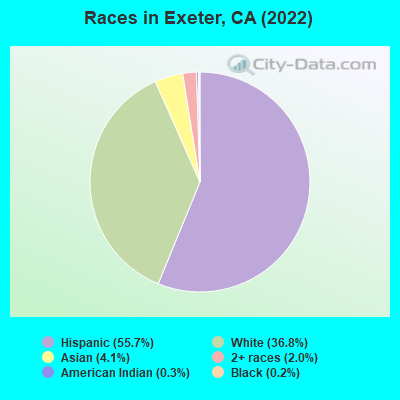
- 5,80655.7%Hispanic
- 3,83336.8%White alone
- 4264.1%Asian alone
- 2132.0%Two or more races
- 270.3%American Indian alone
- 160.2%Black alone
- 90.09%Other race alone
According to our research of California and other state lists, there were 26 registered sex offenders living in Exeter, California as of April 27, 2024.
The ratio of all residents to sex offenders in Exeter is 408 to 1.
Type |
2009 |
2010 |
2011 |
2012 |
2013 |
2014 |
2015 |
2016 |
2017 |
2018 |
2019 |
2020 |
2022 |
|---|---|---|---|---|---|---|---|---|---|---|---|---|---|
| Murders (per 100,000) | 0 (0.0) | 0 (0.0) | 1 (9.6) | 0 (0.0) | 1 (9.5) | 0 (0.0) | 0 (0.0) | 0 (0.0) | 1 (9.5) | 0 (0.0) | 0 (0.0) | 1 (9.5) | 3 (29.1) |
| Rapes (per 100,000) | 6 (59.7) | 3 (29.0) | 1 (9.6) | 3 (28.3) | 3 (28.6) | 2 (19.0) | 1 (9.4) | 1 (9.4) | 4 (38.0) | 2 (18.9) | 5 (47.4) | 4 (38.1) | 3 (29.1) |
| Robberies (per 100,000) | 11 (109.4) | 5 (48.4) | 10 (95.6) | 1 (9.4) | 4 (38.1) | 3 (28.5) | 7 (66.0) | 3 (28.3) | 6 (57.0) | 3 (28.3) | 5 (47.4) | 4 (38.1) | 1 (9.7) |
| Assaults (per 100,000) | 15 (149.2) | 14 (135.5) | 33 (315.6) | 24 (226.5) | 12 (114.2) | 42 (399.1) | 18 (169.6) | 27 (255.0) | 13 (123.4) | 11 (103.9) | 16 (151.6) | 23 (219.0) | 16 (155.1) |
| Burglaries (per 100,000) | 120 (1,194) | 79 (764.5) | 138 (1,320) | 89 (839.9) | 72 (685.3) | 87 (826.7) | 118 (1,112) | 83 (783.8) | 55 (522.2) | 49 (463.0) | 52 (492.6) | 35 (333.3) | 27 (261.7) |
| Thefts (per 100,000) | 202 (2,009) | 142 (1,374) | 180 (1,722) | 191 (1,803) | 158 (1,504) | 199 (1,891) | 197 (1,857) | 150 (1,417) | 152 (1,443) | 193 (1,824) | 188 (1,781) | 175 (1,667) | 159 (1,541) |
| Auto thefts (per 100,000) | 34 (338.2) | 26 (251.6) | 24 (229.6) | 26 (245.4) | 19 (180.8) | 19 (180.5) | 34 (320.4) | 36 (340.0) | 32 (303.8) | 37 (349.6) | 25 (236.8) | 35 (333.3) | 16 (155.1) |
| Arson (per 100,000) | 1 (9.9) | 3 (29.0) | 5 (47.8) | 1 (9.4) | 2 (19.0) | 2 (19.0) | 7 (66.0) | 1 (9.4) | 1 (9.5) | 0 (0.0) | 1 (9.5) | 1 (9.5) | 1 (9.7) |
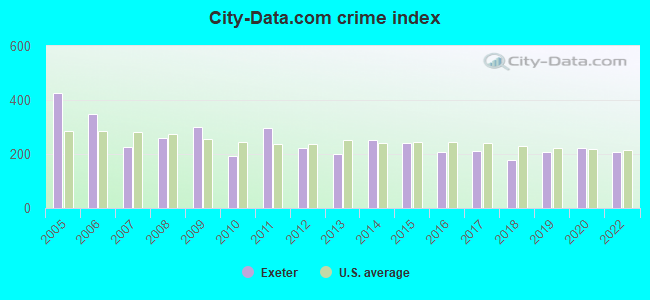
| City-Data.com crime index | 301.4 | 193.4 | 298.2 | 221.3 | 198.7 | 251.5 | 239.0 | 205.8 | 209.7 | 177.7 | 207.1 | 221.4 | 207.7 |
The City-Data.com crime index weighs serious crimes and violent crimes more heavily. Higher means more crime, U.S. average is 246.1. It adjusts for the number of visitors and daily workers commuting into cities.
Crime rate in Exeter detailed stats: murders, rapes, robberies, assaults, burglaries, thefts, arson
Full-time law enforcement employees in 2021, including police officers: 19 (17 officers - 14 male; 3 female).
| Officers per 1,000 residents here: | 1.63 |
| California average: | 2.30 |
 Recent articles from our blog. Our writers, many of them Ph.D. graduates or candidates, create easy-to-read articles on a wide variety of topics.


Latest news from Exeter, CA collected exclusively by city-data.com from local newspapers, TV, and radio stations
Ancestries: American (3.8%), German (2.3%), English (1.8%), Irish (1.6%), Norwegian (1.6%).
Current Local Time: PST time zone
Elevation: 386 feet
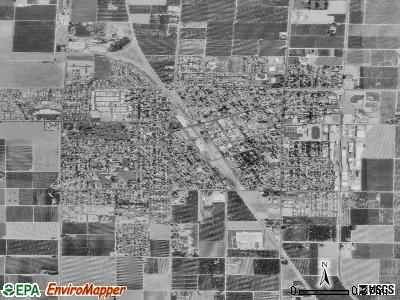
Land area: 2.23 square miles.
Population density: 4,604 people per square mile (average).
1,274 residents are foreign born (9.0% Latin America, 2.9% Asia).
| This city: | 12.2% |
| California: | 26.5% |
Median real estate property taxes paid for housing units with mortgages in 2022: $2,251 (0.7%)
Median real estate property taxes paid for housing units with no mortgage in 2022: $1,523 (0.6%)
Nearest city with pop. 50,000+: Visalia, CA  (9.4 miles , pop. 91,565).
Nearest city with pop. 200,000+: Fresno, CA (49.4 miles , pop. 427,652).
Nearest city with pop. 1,000,000+: Los Angeles, CA (158.8 miles , pop. 3,694,820).
Nearest cities:
), ), ), ), Latitude: 36.29 N, Longitude: 119.14 W
Daytime population change due to commuting: -702 (-6.7%)
Workers who live and work in this city: 1,073 (28.5%)
Area code: 559
Exeter, California accommodation & food services, waste management - Economy and Business Data
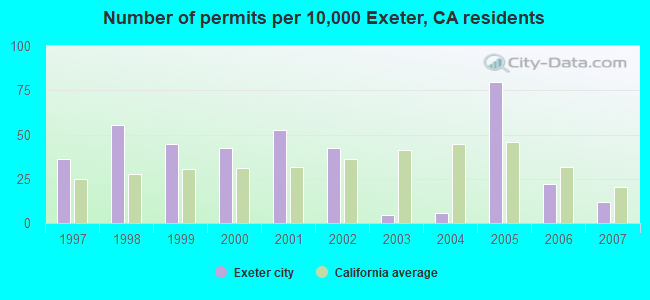
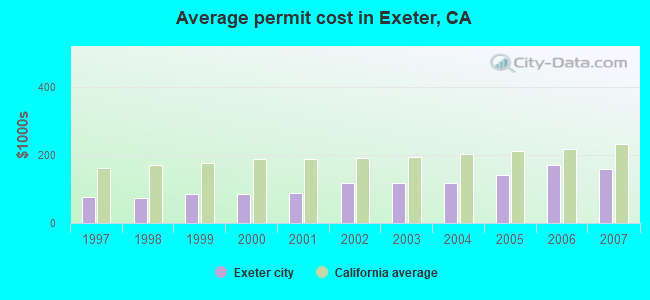
Single-family new house construction building permits:
- 2007: 11 buildings, average cost: $159,900
- 2006: 20 buildings, average cost: $170,600
- 2005: 73 buildings, average cost: $142,300
- 2004: 5 buildings, average cost: $118,800
- 2003: 4 buildings, average cost: $118,800
- 2002: 39 buildings, average cost: $118,700
- 2001: 48 buildings, average cost: $88,500
- 2000: 39 buildings, average cost: $85,300
- 1999: 41 buildings, average cost: $84,700
- 1998: 51 buildings, average cost: $73,100
- 1997: 33 buildings, average cost: $76,000
| Here: | 11.2% |
| California: | 5.1% |
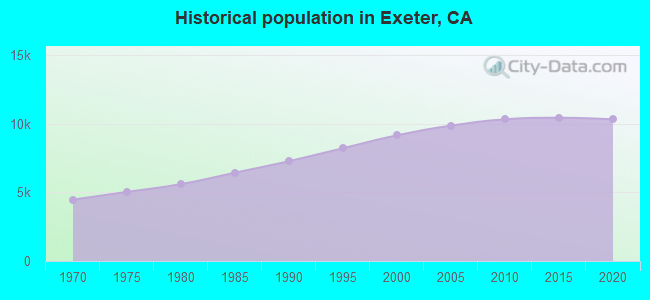
Population change in the 1990s: +1,660 (+22.1%).
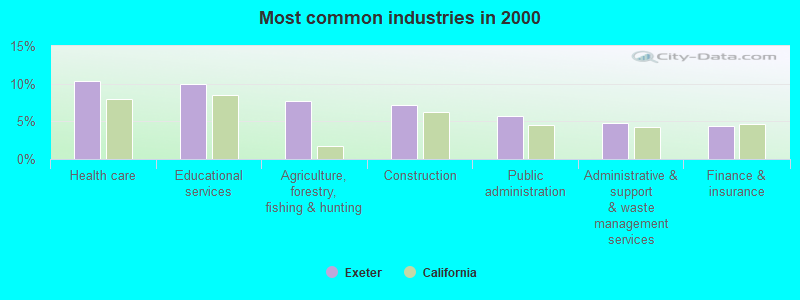
- Health care (10.3%)
- Educational services (10.0%)
- Agriculture, forestry, fishing & hunting (7.7%)
- Construction (7.2%)
- Public administration (5.7%)
- Administrative & support & waste management services (4.7%)
- Finance & insurance (4.3%)
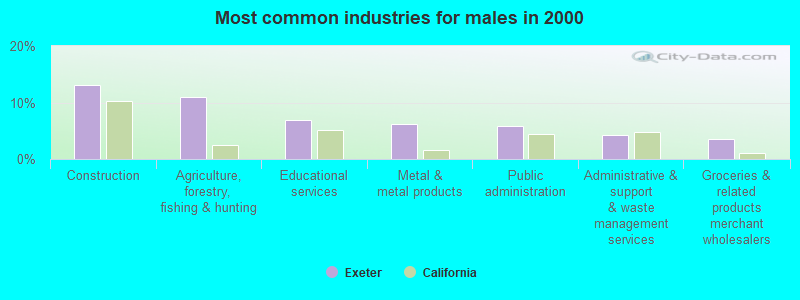
- Construction (13.1%)
- Agriculture, forestry, fishing & hunting (11.1%)
- Educational services (6.9%)
- Metal & metal products (6.1%)
- Public administration (5.9%)
- Administrative & support & waste management services (4.3%)
- Groceries & related products merchant wholesalers (3.5%)
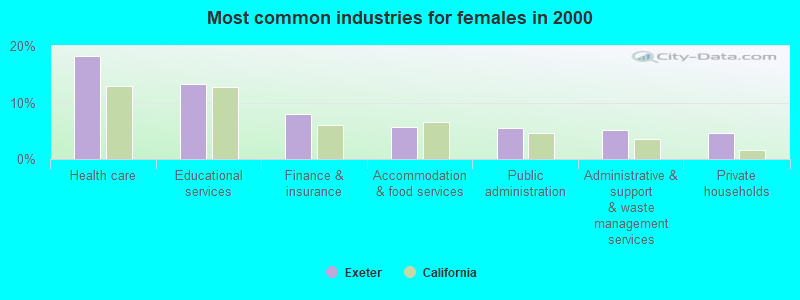
- Health care (18.2%)
- Educational services (13.3%)
- Finance & insurance (7.9%)
- Accommodation & food services (5.7%)
- Public administration (5.6%)
- Administrative & support & waste management services (5.2%)
- Private households (4.6%)
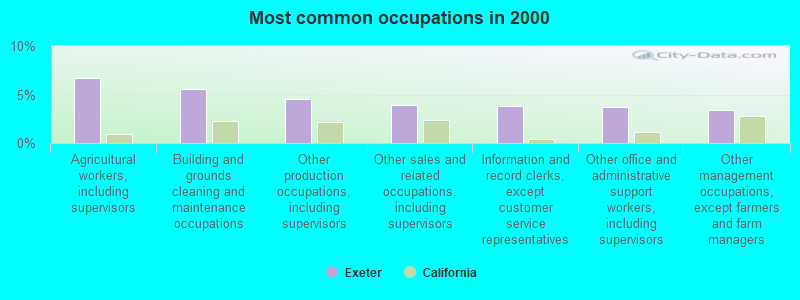
- Agricultural workers, including supervisors (6.7%)
- Building and grounds cleaning and maintenance occupations (5.5%)
- Other production occupations, including supervisors (4.5%)
- Other sales and related occupations, including supervisors (3.9%)
- Information and record clerks, except customer service representatives (3.8%)
- Other office and administrative support workers, including supervisors (3.7%)
- Other management occupations, except farmers and farm managers (3.5%)
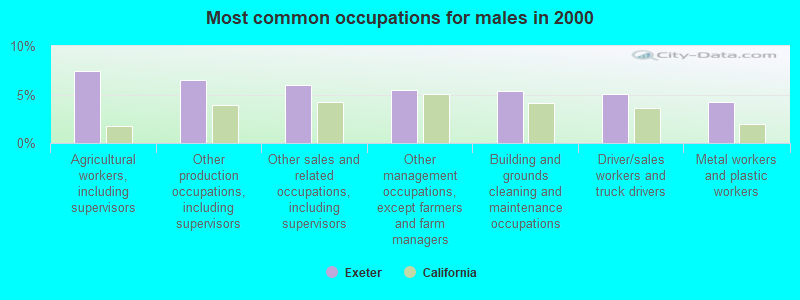
- Agricultural workers, including supervisors (7.4%)
- Other production occupations, including supervisors (6.5%)
- Other sales and related occupations, including supervisors (5.9%)
- Other management occupations, except farmers and farm managers (5.5%)
- Building and grounds cleaning and maintenance occupations (5.3%)
- Driver/sales workers and truck drivers (5.1%)
- Metal workers and plastic workers (4.3%)

- Information and record clerks, except customer service representatives (8.0%)
- Other office and administrative support workers, including supervisors (6.0%)
- Agricultural workers, including supervisors (5.8%)
- Building and grounds cleaning and maintenance occupations (5.7%)
- Preschool, kindergarten, elementary, and middle school teachers (5.1%)
- Registered nurses (4.9%)
- Nursing, psychiatric, and home health aides (3.7%)
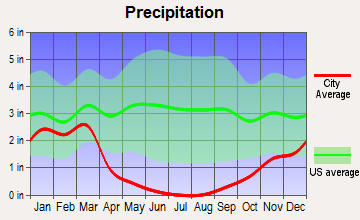
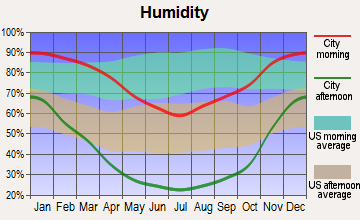
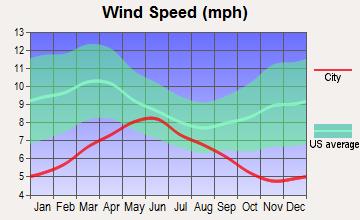
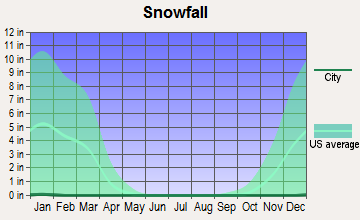
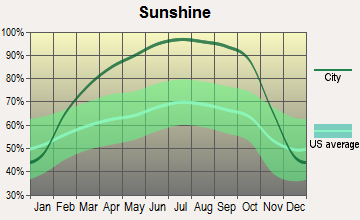
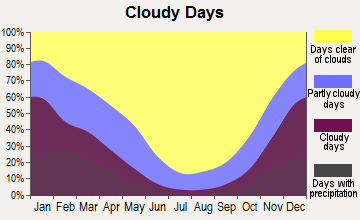
Average climate in Exeter, California
Based on data reported by over 4,000 weather stations

|
|


(lower is better)
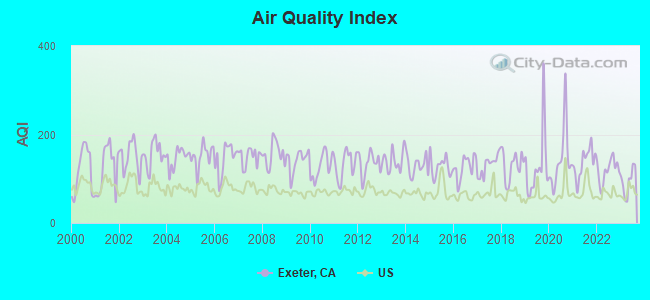
Air Quality Index (AQI) level in 2023 was 94.3. This is worse than average.
| City: | 94.3 |
| U.S.: | 72.6 |
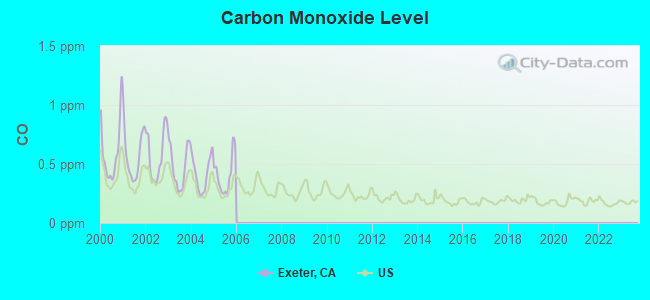
Carbon Monoxide (CO) [ppm] level in 2005 was 0.407. This is significantly worse than average. Closest monitor was 8.7 miles away from the city center.
| City: | 0.407 |
| U.S.: | 0.251 |
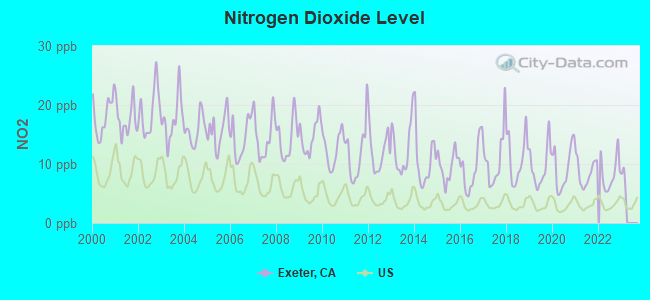
Nitrogen Dioxide (NO2) [ppb] level in 2022 was 8.34. This is significantly worse than average. Closest monitor was 8.7 miles away from the city center.
| City: | 8.34 |
| U.S.: | 5.11 |
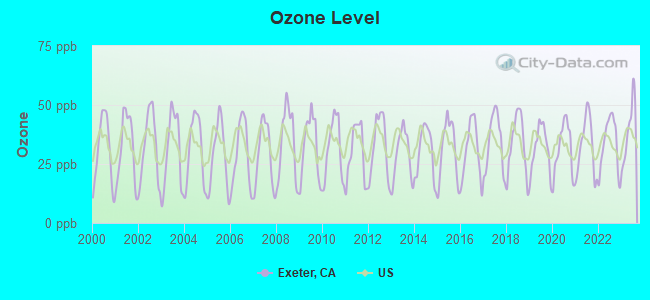
Ozone [ppb] level in 2023 was 39.4. This is about average. Closest monitor was 7.4 miles away from the city center.
| City: | 39.4 |
| U.S.: | 33.3 |
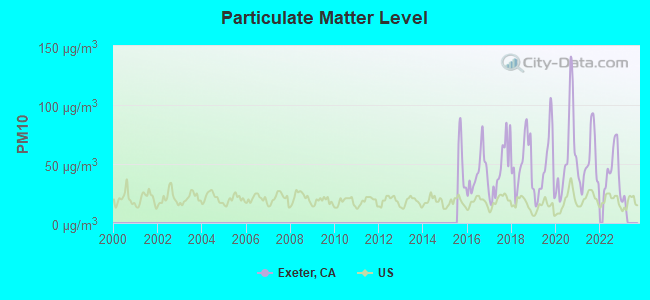
Particulate Matter (PM10) [µg/m3] level in 2022 was 46.6. This is significantly worse than average. Closest monitor was 8.7 miles away from the city center.
| City: | 46.6 |
| U.S.: | 19.2 |
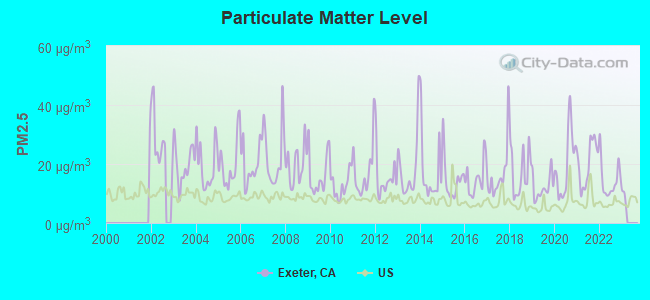
Particulate Matter (PM2.5) [µg/m3] level in 2022 was 14.5. This is significantly worse than average. Closest monitor was 8.7 miles away from the city center.
| City: | 14.5 |
| U.S.: | 8.1 |
Earthquake activity:
Exeter-area historical earthquake activity is significantly above California state average. It is 8531% greater than the overall U.S. average.On 7/21/1952 at 11:52:14, a magnitude 7.7 (7.7 UK, Class: Major, Intensity: VIII - XII) earthquake occurred 89.9 miles away from the city center, causing $50,000,000 total damage
On 11/4/1927 at 13:51:53, a magnitude 7.5 (7.5 UK) earthquake occurred 142.7 miles away from Exeter center
On 4/18/1906 at 13:12:21, a magnitude 7.9 (7.9 UK) earthquake occurred 243.2 miles away from the city center, causing $524,000,000 total damage
On 6/28/1992 at 11:57:34, a magnitude 7.6 (6.2 MB, 7.6 MS, 7.3 MW, Depth: 0.7 mi) earthquake occurred 207.5 miles away from Exeter center, causing 3 deaths (1 shaking deaths, 2 other deaths) and 400 injuries, causing $100,000,000 total damage and $40,000,000 insured losses
On 10/16/1999 at 09:46:44, a magnitude 7.4 (6.3 MB, 7.4 MS, 7.2 MW, 7.3 ML) earthquake occurred 196.1 miles away from Exeter center
On 12/21/1932 at 06:10:09, a magnitude 7.2 (7.2 UK) earthquake occurred 163.9 miles away from the city center
Magnitude types: body-wave magnitude (MB), local magnitude (ML), surface-wave magnitude (MS), moment magnitude (MW)
Natural disasters:
The number of natural disasters in Tulare County (14) is near the US average (15).Major Disasters (Presidential) Declared: 10
Emergencies Declared: 2
Causes of natural disasters: Floods: 8, Storms: 5, Winter Storms: 4, Freezes: 2, Landslides: 2, Drought: 1, Fire: 1, Hurricane: 1, Mudslide: 1, Other: 1 (Note: some incidents may be assigned to more than one category).

Hospitals and medical centers in Exeter:
- MEMORIAL HOSPITAL AT EXETER (215 CRESPI AVENUE)
- DAVITA-EXETER DIALYSIS (1116 W. VISALIA ROAD, SUITE 106)
Other hospitals and medical centers near Exeter:
- SIERRA VISTA RESIDENTIAL CARE (Hospital, about 4 miles away; FARMERSVILLE, CA)
- LINDSAY GARDENS (Nursing Home, about 7 miles away; LINDSAY, CA)
- WECARE RESIDENTIAL CARE-MAPLE (Hospital, about 8 miles away; VISALIA, CA)
- REDWOOD SPRINGS HEALTHCARE CENTER (Nursing Home, about 8 miles away; VISALIA, CA)
- DELTA CONV HOSP (Nursing Home, about 9 miles away; VISALIA, CA)
- VISALIA COMMUNITY HOSPITAL (Hospital, about 9 miles away; VISALIA, CA)
- KAWEAH DELTA SKILLED NURSING CENTER (Nursing Home, about 9 miles away; VISALIA, CA)
Airports located in Exeter:
- Exeter Airport (O63) (Runways: 1, Itinerant Ops: 200, Local Ops: 200)
Colleges/universities with over 2000 students nearest to Exeter:
- College of the Sequoias (about 10 miles; Visalia, CA; Full-time enrollment: 6,982)
- San Joaquin Valley College-Visalia (about 14 miles; Visalia, CA; FT enrollment: 2,386)
- Porterville College (about 19 miles; Porterville, CA; FT enrollment: 2,560)
- Reedley College (about 28 miles; Reedley, CA; FT enrollment: 8,144)
- West Hills College-Lemoore (about 38 miles; Lemoore, CA; FT enrollment: 2,314)
- Fresno Pacific University (about 45 miles; Fresno, CA; FT enrollment: 3,083)
- Fresno City College (about 49 miles; Fresno, CA; FT enrollment: 12,994)
Public high schools in Exeter:
- KAWEAH HIGH (Students: 18, Location: 21215 AVE. 300, Grades: 9-12)
- EXETER INDEPENDENT STUDY (ALTERNATIVE) (Students: 7, Location: 505 ROCKY HILL DR., Grades: KG-12)
- EXETER COMMUNITY DAY (Students: 3, Location: 1107 E. ROCKY HILL DR., Grades: 1-12)
- EXETER UNION HIGH (Location: 505 ROCKY HILL DR., Grades: 9-12)
Private high school in Exeter:
Public elementary/middle schools in Exeter:
- ROCKY HILL ELEMENTARY (Students: 616, Location: 313 SEQUOIA DR., Grades: KG-5)
- LINCOLN ELEMENTARY (Location: 333 S. D ST., Grades: KG-5)
- WILSON MIDDLE (Location: 710 W. MAPLE ST., Grades: 6-8)
- EXETER UNION COMMUNITY DAY (Location: 313 SEQUOIA DR., Grades: 4-8)
User-submitted facts and corrections:
- The streets in Exeter are all named after varities of trees or what the tree's produce!
Points of interest:
Notable locations in Exeter: Exter Golf Course (A), Exeter District Ambulance (B), Exeter Fire Department (C), Exeter Womans Club (D), Exeter Memorial Building (E), Exeter City Hall (F), Exeter Branch Tulare County Library (G). Display/hide their locations on the map
Churches in Exeter include: Calvary Baptist Mission (A), Church of Christ (B), Church of God (C), Church of the Nazarene (D), Evangelical Methodist Church (E), First Assembly of God Church (F), First Baptist Church (G), First Presbyterian Church (H), Foursquare Gospel Church (I). Display/hide their locations on the map
Park in Exeter: Exeter City Athletic Park (1). Display/hide its location on the map
Hotel: Best Western Exeter Inn Suites (805 South Kaweah Avenue).
Birthplace of: Pamela Wallace - Writer.
Drinking water stations with addresses in Exeter and their reported violations in the past:
BADGER HILL ESTATES (Population served: 300, Groundwater):Past health violations:THE BARN (Population served: 200, Groundwater):
- MCL, Monthly (TCR) - In MAY-2011, Contaminant: Coliform. Follow-up actions: St Violation/Reminder Notice (JUN-10-2011), St Compliance achieved (JUL-10-2011)
- MCL, Monthly (TCR) - In MAY-2009, Contaminant: Coliform. Follow-up actions: St Violation/Reminder Notice (JUN-10-2009), St Compliance achieved (JUL-10-2009)
- MCL, Monthly (TCR) - In MAY-2009, Contaminant: Coliform. Follow-up actions: St Violation/Reminder Notice (JUN-10-2009), St Compliance achieved (JUL-10-2009)
- MCL, Monthly (TCR) - In JUN-2006, Contaminant: Coliform. Follow-up actions: St Formal NOV issued (JUL-10-2006), St Compliance achieved (JUL-10-2009)
- MCL, Monthly (TCR) - In JUN-2006, Contaminant: Coliform. Follow-up actions: St Formal NOV issued (JUL-10-2006), St Compliance achieved (JUL-10-2009)
- MCL, Monthly (TCR) - In JAN-2006, Contaminant: Coliform. Follow-up actions: St Formal NOV issued (FEB-10-2006), St Compliance achieved (JUL-10-2009)
- MCL, Monthly (TCR) - In JAN-2006, Contaminant: Coliform. Follow-up actions: St Formal NOV issued (FEB-10-2006), St Compliance achieved (JUL-10-2009)
Past monitoring violations:DRY CREEK DELI (Population served: 50, Groundwater):
- 2 regular monitoring violations
Past health violations:Past monitoring violations:
- MCL, Average - Between JAN-2014 and MAR-2014, Contaminant: Nitrate. Follow-up actions: St AO (w/o penalty) issued (OCT-01-2007)
- MCL, Average - Between OCT-2013 and DEC-2013, Contaminant: Nitrate. Follow-up actions: St AO (w/o penalty) issued (OCT-01-2007)
- MCL, Average - Between JUL-2013 and SEP-2013, Contaminant: Nitrate. Follow-up actions: St AO (w/o penalty) issued (OCT-01-2007)
- MCL, Average - Between APR-2013 and JUN-2013, Contaminant: Nitrate. Follow-up actions: St AO (w/o penalty) issued (OCT-01-2007)
- MCL, Average - Between JAN-2013 and MAR-2013, Contaminant: Nitrate. Follow-up actions: St AO (w/o penalty) issued (OCT-01-2007)
- MCL, Average - Between OCT-2012 and DEC-2012, Contaminant: Nitrate. Follow-up actions: St AO (w/o penalty) issued (OCT-01-2007)
- 4 other older health violations
- 4 regular monitoring violations
| This city: | 3.0 people |
| California: | 2.9 people |
| This city: | 77.1% |
| Whole state: | 68.7% |
| This city: | 7.3% |
| Whole state: | 7.2% |
Likely homosexual households (counted as self-reported same-sex unmarried-partner households)
- Lesbian couples: 0.2% of all households
- Gay men: 0.1% of all households
People in group quarters in Exeter in 2010:
- 29 people in residential treatment centers for adults
- 16 people in workers' group living quarters and job corps centers
- 12 people in group homes intended for adults
- 10 people in nursing facilities/skilled-nursing facilities
- 6 people in residential treatment centers for juveniles (non-correctional)
People in group quarters in Exeter in 2000:
- 38 people in other noninstitutional group quarters
- 29 people in nursing homes
- 19 people in hospitals/wards and hospices for chronically ill
- 19 people in other hospitals or wards for chronically ill
- 6 people in other group homes
Banks with branches in Exeter (2011 data):
- Bank of the Sierra: Exeter Branch at 1103 West Visalia Road, branch established on 1988/11/18. Info updated 2006/11/03: Bank assets: $1,332.3 mil, Deposits: $1,091.7 mil, headquarters in Porterville, CA, positive income, Commercial Lending Specialization, 26 total offices, Holding Company: Sierra Bancorp
- Bank of America, National Association: Exeter Branch at 100 East Pine Street, branch established on 1930/11/01. Info updated 2009/11/18: Bank assets: $1,451,969.3 mil, Deposits: $1,077,176.8 mil, headquarters in Charlotte, NC, positive income, 5782 total offices, Holding Company: Bank Of America Corporation
- Visalia Community Bank: Exeter Branch at 300 East Pine Street, branch established on 2002/04/15. Info updated 2006/11/03: Bank assets: $197.0 mil, Deposits: $171.2 mil, headquarters in Visalia, CA, positive income, Commercial Lending Specialization, 5 total offices
For population 15 years and over in Exeter:
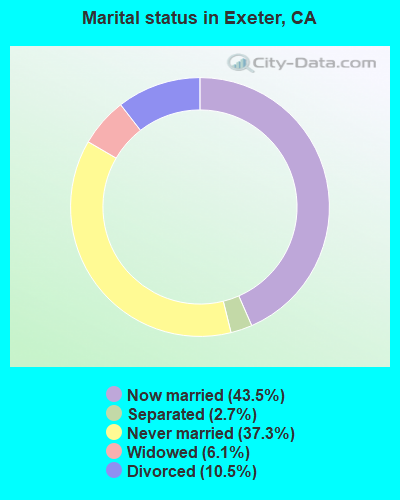
- Never married: 37.3%
- Now married: 43.5%
- Separated: 2.7%
- Widowed: 6.1%
- Divorced: 10.5%
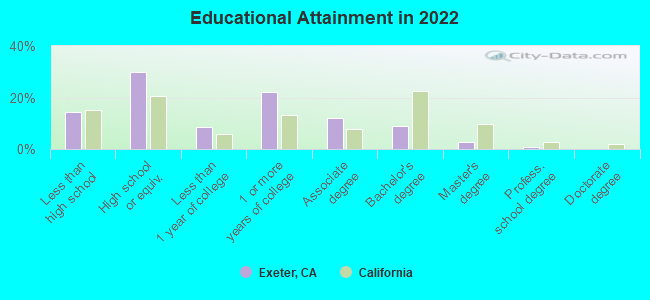
For population 25 years and over in Exeter:
- High school or higher: 85.0%
- Bachelor's degree or higher: 12.1%
- Graduate or professional degree: 3.7%
- Unemployed: 8.1%
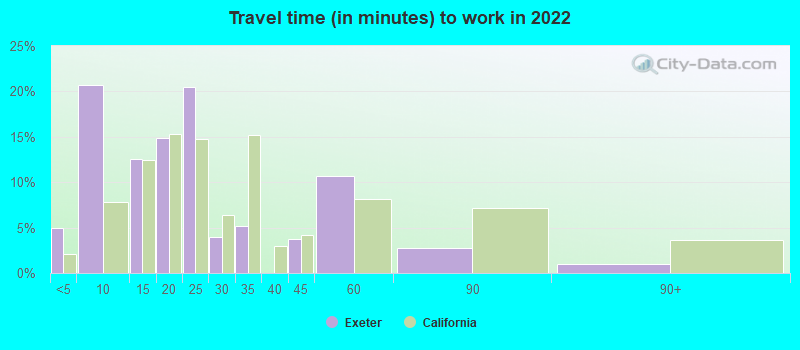
- Mean travel time to work (commute): 22.4 minutes
| Here: | 13.1 |
| California average: | 15.5 |
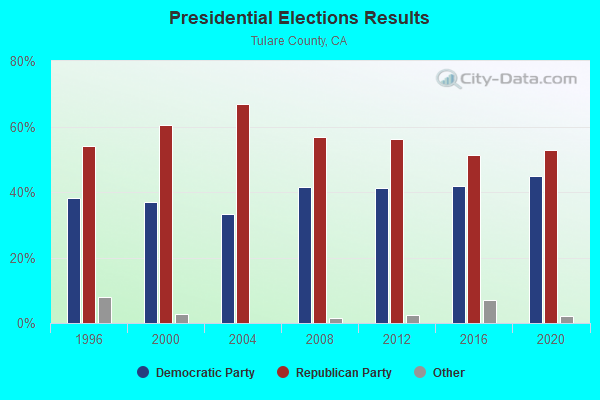
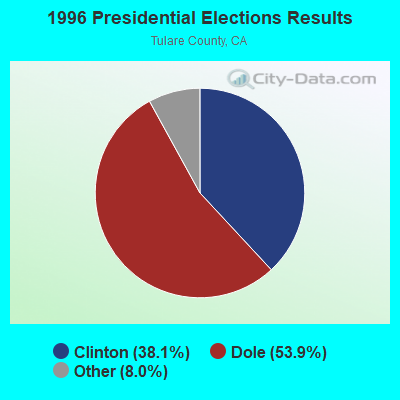
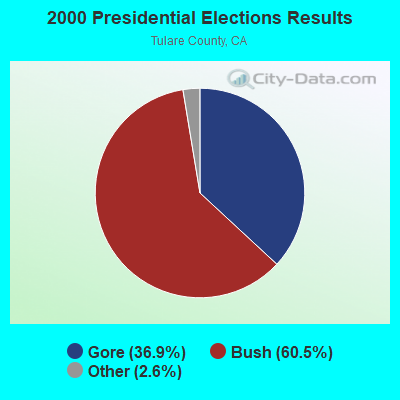
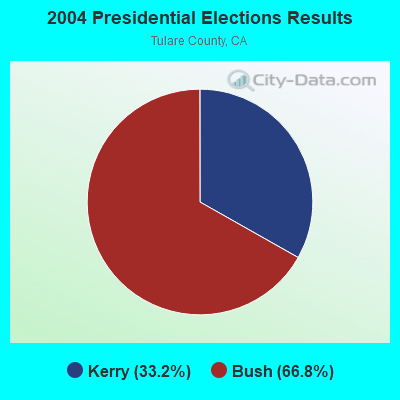
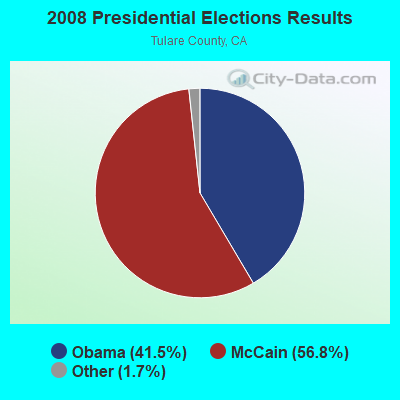
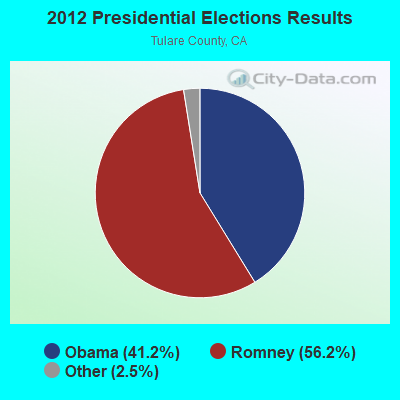
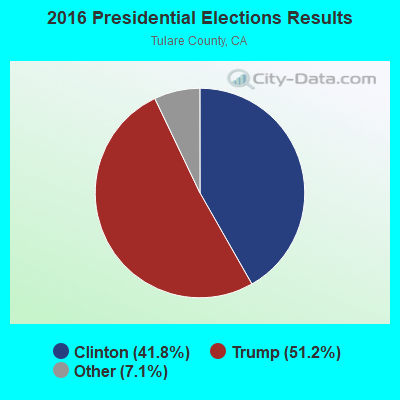
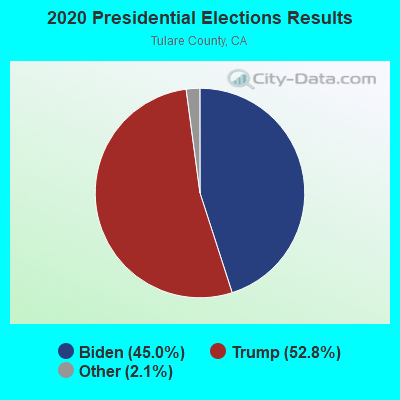
Graphs represent county-level data. Detailed 2008 Election Results
Religion statistics for Exeter, CA (based on Tulare County data)
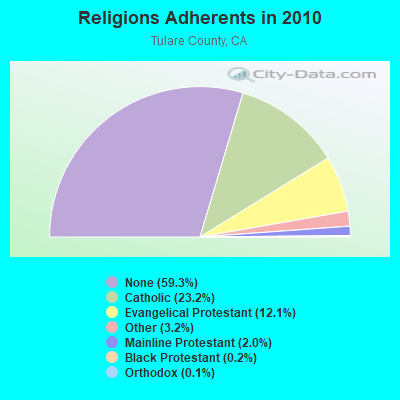
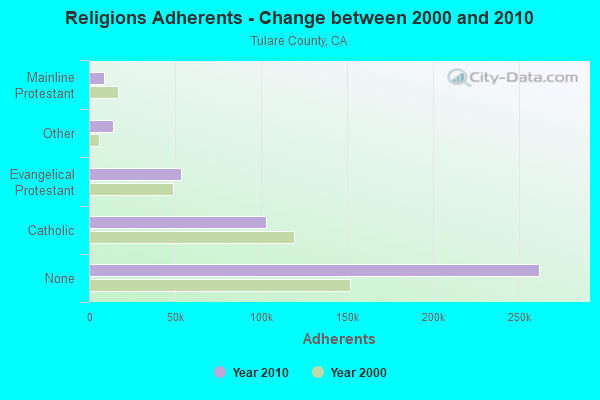
| Religion | Adherents | Congregations |
|---|---|---|
| Catholic | 102,772 | 26 |
| Evangelical Protestant | 53,285 | 300 |
| Other | 13,983 | 37 |
| Mainline Protestant | 8,690 | 37 |
| Black Protestant | 757 | 5 |
| Orthodox | 650 | 2 |
| None | 262,042 | - |
Food Environment Statistics:
| Tulare County: | 2.84 / 10,000 pop. |
| State: | 2.14 / 10,000 pop. |
| This county: | 0.07 / 10,000 pop. |
| State: | 0.04 / 10,000 pop. |
| This county: | 0.76 / 10,000 pop. |
| California: | 0.62 / 10,000 pop. |
| Tulare County: | 2.12 / 10,000 pop. |
| California: | 1.49 / 10,000 pop. |
| Tulare County: | 5.13 / 10,000 pop. |
| California: | 7.42 / 10,000 pop. |
| This county: | 7.3% |
| California: | 7.3% |
| Here: | 28.2% |
| California: | 21.3% |
| This county: | 16.9% |
| State: | 17.9% |
Health and Nutrition:
| Exeter: | 47.7% |
| California: | 49.4% |
| This city: | 45.5% |
| California: | 48.0% |
| Here: | 28.7 |
| State: | 28.1 |
| This city: | 22.6% |
| State: | 20.2% |
| Here: | 10.6% |
| California: | 11.2% |
| Exeter: | 6.8 |
| California: | 6.8 |
| This city: | 33.1% |
| California: | 31.5% |
| This city: | 54.0% |
| California: | 56.4% |
| This city: | 79.6% |
| State: | 80.9% |
More about Health and Nutrition of Exeter, CA Residents
| Local government employment and payroll (March 2022) | |||||
| Function | Full-time employees | Monthly full-time payroll | Average yearly full-time wage | Part-time employees | Monthly part-time payroll |
|---|---|---|---|---|---|
| Police Protection - Officers | 19 | $128,876 | $81,395 | 0 | $0 |
| Streets and Highways | 5 | $30,141 | $72,338 | 0 | $0 |
| Other Government Administration | 3 | $30,756 | $123,024 | 8 | $355 |
| Water Supply | 3 | $16,796 | $67,184 | 0 | $0 |
| Financial Administration | 2 | $8,690 | $52,140 | 2 | $2,413 |
| Sewerage | 2 | $16,183 | $97,098 | 0 | $0 |
| Parks and Recreation | 2 | $11,426 | $68,556 | 18 | $13,008 |
| Police - Other | 2 | $13,702 | $82,212 | 0 | $0 |
| Other and Unallocable | 2 | $12,713 | $76,278 | 0 | $0 |
| Solid Waste Management | 1 | $5,865 | $70,380 | 0 | $0 |
| Transit | 1 | $5,595 | $67,140 | 1 | $2,960 |
| Totals for Government | 42 | $280,743 | $80,212 | 29 | $18,736 |
Exeter government finances - Expenditure in 2021 (per resident):
- Construction - Regular Highways: $10,904,000 ($1062.04)
Water Utilities: $91,000 ($8.86)
Police Protection: $40,000 ($3.90)
General - Other: $22,000 ($2.14)
- Current Operations - Police Protection: $2,696,000 ($262.59)
Water Utilities: $1,586,000 ($154.48)
Solid Waste Management: $1,256,000 ($122.33)
Sewerage: $1,058,000 ($103.05)
Central Staff Services: $630,000 ($61.36)
Regular Highways: $526,000 ($51.23)
Housing and Community Development: $245,000 ($23.86)
Local Fire Protection: $227,000 ($22.11)
Parks and Recreation: $183,000 ($17.82)
Financial Administration: $91,000 ($8.86)
Health - Other: $76,000 ($7.40)
Protective Inspection and Regulation - Other: $56,000 ($5.45)
Judicial and Legal Services: $42,000 ($4.09)
- General - Interest on Debt: $98,000 ($9.55)
- Other Capital Outlay - Water Utilities: $105,000 ($10.23)
Regular Highways: $79,000 ($7.69)
Sewerage: $32,000 ($3.12)
Police Protection: $31,000 ($3.02)
General - Other: $21,000 ($2.05)
Parks and Recreation: $10,000 ($0.97)
- Water Utilities - Interest on Debt: $181,000 ($17.63)
Exeter government finances - Revenue in 2021 (per resident):
- Charges - Sewerage: $1,473,000 ($143.47)
Solid Waste Management: $1,280,000 ($124.67)
Other: $238,000 ($23.18)
Regular Highways: $6,000 ($0.58)
- Federal Intergovernmental - Other: $1,079,000 ($105.09)
- Miscellaneous - General Revenue - Other: $1,507,000 ($146.78)
Interest Earnings: $54,000 ($5.26)
Fines and Forfeits: $46,000 ($4.48)
Rents: $46,000 ($4.48)
Donations From Private Sources: $26,000 ($2.53)
Special Assessments: $3,000 ($0.29)
Sale of Property: $3,000 ($0.29)
- Revenue - Water Utilities: $2,093,000 ($203.86)
- State Intergovernmental - Other: $716,000 ($69.74)
Highways: $449,000 ($43.73)
General Local Government Support: $7,000 ($0.68)
- Tax - General Sales and Gross Receipts: $5,294,000 ($515.63)
Property: $2,338,000 ($227.72)
Public Utilities Sales: $825,000 ($80.35)
Other: $385,000 ($37.50)
Other Selective Sales: $121,000 ($11.79)
Occupation and Business License - Other: $55,000 ($5.36)
Documentary and Stock Transfer: $37,000 ($3.60)
Other License: $27,000 ($2.63)
Exeter government finances - Debt in 2021 (per resident):
- Long Term Debt - Beginning Outstanding - Unspecified Public Purpose: $9,898,000 ($964.06)
Outstanding Unspecified Public Purpose: $9,446,000 ($920.04)
Retired Unspecified Public Purpose: $452,000 ($44.02)
Exeter government finances - Cash and Securities in 2021 (per resident):
- Other Funds - Cash and Securities: $14,420,000 ($1404.50)
3.84% of this county's 2021 resident taxpayers lived in other counties in 2020 ($53,510 average adjusted gross income)
| Here: | 3.84% |
| California average: | 5.19% |
0.01% of residents moved from foreign countries ($107 average AGI)
Tulare County: 0.01% California average: 0.03%
Top counties from which taxpayers relocated into this county between 2020 and 2021:
| from Fresno County, CA | |
| from Los Angeles County, CA | |
| from Kern County, CA |
3.70% of this county's 2020 resident taxpayers moved to other counties in 2021 ($58,158 average adjusted gross income)
| Here: | 3.70% |
| California average: | 6.14% |
0.01% of residents moved to foreign countries ($170 average AGI)
Tulare County: 0.01% California average: 0.02%
Top counties to which taxpayers relocated from this county between 2020 and 2021:
| to Fresno County, CA | |
| to Kern County, CA | |
| to Kings County, CA |
| Businesses in Exeter, CA | ||||
| Name | Count | Name | Count | |
|---|---|---|---|---|
| Ace Hardware | 1 | H&R Block | 1 | |
| AutoZone | 1 | Haagen-Dazs | 1 | |
| Best Western | 1 | McDonald's | 1 | |
| Burger King | 1 | Rite Aid | 1 | |
| FedEx | 1 | Taco Bell | 1 | |
| Ford | 1 | True Value | 1 | |
| GNC | 1 | UPS | 1 | |
Strongest AM radio stations in Exeter:
- KWRU (940 AM; 50 kW; FRESNO, CA)
- KMJ (580 AM; 50 kW; FRESNO, CA; Owner: INFINITY RADIO OPERATIONS INC.)
- KJUG (1270 AM; 5 kW; TULARE, CA; Owner: WESTCOAST BROADCASTING, INC.)
- KRDU (1130 AM; 6 kW; DINUBA, CA; Owner: CAPSTAR TX LIMITED PARTNERSHIP)
- KERI (1180 AM; 50 kW; WASCO-GREENACRES, CA; Owner: KWSO, INC.)
- KVBL (1400 AM; 1 kW; VISALIA, CA; Owner: CAPSTAR TX LIMITED PARTNERSHIP)
- KOOR (790 AM; 10 kW; CLOVIS, CA; Owner: INFINITY RADIO OPERATIONS INC.)
- KGDP (660 AM; 50 kW; ORCUTT, CA; Owner: RADIO REPRESENTATIVES, INC.)
- KGEN (1370 AM; 1 kW; TULARE, CA; Owner: AZTECA BROADCASTING CORPORATION)
- KCHJ (1010 AM; 5 kW; DELANO, CA; Owner: ILLINOIS LOTUS CORP.)
- KNZR (1560 AM; 25 kW; BAKERSFIELD, CA; Owner: BUCKLEY BROADCASTING CORP. OF CALIF.)
- KIRN (670 AM; 35 kW; SIMI VALLEY, CA; Owner: LOTUS OXNARD CORP.)
- KTIP (1450 AM; 1 kW; PORTERVILLE, CA; Owner: CALDWELL BROADCASTING CO., INC.)
Strongest FM radio stations in Exeter:
- KZPO (103.3 FM; LINDSAY, CA; Owner: LINDSAY BROADCASTING)
- KDUV (88.9 FM; VISALIA, CA; Owner: COMMUNITY EDUCATIONAL B/CASTNG, INC.)
- KJUG-FM (106.7 FM; TULARE, CA; Owner: WESTCOAST BROADCASTING, INC.)
- K220EY (91.9 FM; PORTERVILLE, CA; Owner: FAMILY STATIONS, INC.)
- KUFW (90.5 FM; WOODLAKE, CA; Owner: NATIONAL FARM WORKERS SERVICE CENTER)
- KFRR (104.1 FM; WOODLAKE, CA; Owner: IONOSPHERE B/CASTING LTD PARTNERSHIP)
- KMQA (100.5 FM; EAST PORTERVILLE, CA; Owner: MOON BROADCASTING PORTERVILLE L.L.C.)
- KSLK (96.1 FM; VISALIA, CA; Owner: NEW VISALIA BROADCASTING, INC.)
- KMAK (100.3 FM; ORANGE COVE, CA; Owner: RICHARD B. SMITH)
- KCRZ (104.9 FM; TIPTON, CA; Owner: WESTCOAST BROADCASTING, INC.)
- K203CM (88.5 FM; SANGER, CA; Owner: EDUCATIONAL MEDIA FOUNDATION)
- KIOO (99.7 FM; PORTERVILLE, CA; Owner: BUCKLEY B/CSTNG CORP OF SAN JOA VAL)
- K266AH (101.1 FM; BENA, CA; Owner: CALVARY CHAPEL OF TWIN FALLS, INC.)
- KTQX (90.1 FM; BAKERSFIELD, CA; Owner: RADIO BILINGUE, INC.)
- KWYE (101.1 FM; FRESNO, CA; Owner: INFINITY RADIO OPERATIONS INC.)
- KSJV (91.5 FM; FRESNO, CA; Owner: RADIO BILINGUE, INC.)
- KFSO-FM (92.9 FM; VISALIA, CA; Owner: CAPSTAR TX LIMITED PARTNERSHIP)
- KBOS-FM (94.9 FM; TULARE, CA; Owner: CAPSTAR TX LIMITED PARTNERSHIP)
- KSOF (98.9 FM; DINUBA, CA; Owner: CAPSTAR TX LIMITED PARTNERSHIP)
- KARM (89.7 FM; VISALIA, CA; Owner: HARVEST BROADCASTING COMPANY, INC.)
TV broadcast stations around Exeter:
- KFAZ-CA (Channel 8; VISALIA, CA; Owner: GARY M. COCOLA FAMILY TRUST)
- KTFF (Channel 61; PORTERVILLE, CA; Owner: TELEFUTURA FRESNO LLC)
- KMPH (Channel 26; VISALIA, CA; Owner: PAPPAS TELECASTING INCORPORATED)
- KMCF-LP (Channel 35; VISALIA, CA; Owner: GARY M. COCOLA FAMILY TRUST, GARY M. COCOLA TRUSTEE)
- KNXT (Channel 49; VISALIA, CA; Owner: DIOCESE OF FRESNO EDUCATION CORP.)
- KKAK-LP (Channel 20; PORTERVILLE, CA; Owner: GARY M. COCOLA FAMILY TRUST)
- National Bridge Inventory (NBI) Statistics
- 12Number of bridges
- 95ft / 28.8mTotal length
- 64,450Total average daily traffic
- 6,558Total average daily truck traffic
- 103,122Total future (year 2040) average daily traffic
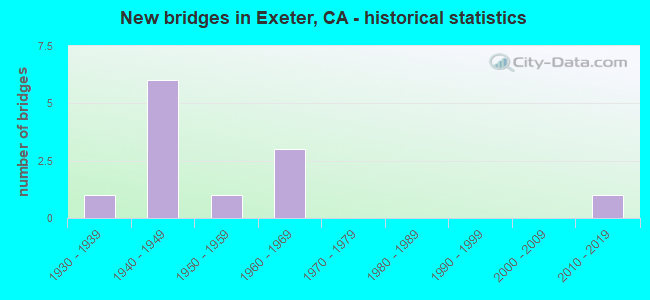
- New bridges - historical statistics
- 11930-1939
- 61940-1949
- 11950-1959
- 31960-1969
- 12010-2019
FCC Registered Antenna Towers:
4- Eric J Ott, Exeter Rocky Hill (Lat: 36.286556 Lon: -119.087333), Type: 44.2, Structure height: 06107 m, Overall height: 44.2 m, Registrant: County Of Tulare, Eott@tularecounty.Ca.Gov, , Visal-ia, Phone: (559) 622-7150
- Eric J Ott, Exeter Rocky Hill (Lat: 36.286556 Lon: -119.087333), Type: 44.2, Structure height: 06107 m, Overall height: 44.2 m, Registrant: County Of Tulare, Eott@tularecounty.Ca.Gov, , Visal-ia, Phone: (559) 622-7150
- Eric J Ott, Exeter Rocky Hill (Lat: 36.286556 Lon: -119.087333), Type: 44.2, Structure height: 06107 m, Overall height: 44.2 m, Registrant: County Of Tulare, Eott@tularecounty.Ca.Gov, , Visal-ia, Phone: (559) 622-7150
- Blue Ridge Lookout (Lat: 36.285278 Lon: -118.839444), Type: 22.9, Overall height: 22.9 m, Registrant: Visal-ia, Phone: (209) 592-9222
FCC Registered Private Land Mobile Towers:
8 (See the full list of FCC Registered Private Land Mobile Towers in Exeter, CA)FCC Registered Broadcast Land Mobile Towers:
36 (See the full list of FCC Registered Broadcast Land Mobile Towers)FCC Registered Microwave Towers:
38 (See the full list of FCC Registered Microwave Towers in this town)FCC Registered Paging Towers:
4 (See the full list of FCC Registered Paging Towers)FCC Registered Amateur Radio Licenses:
49 (See the full list of FCC Registered Amateur Radio Licenses in Exeter)FAA Registered Aircraft Manufacturers and Dealers:
3 (See the full list of FAA Registered Manufacturers and Dealers in Exeter)FAA Registered Aircraft:
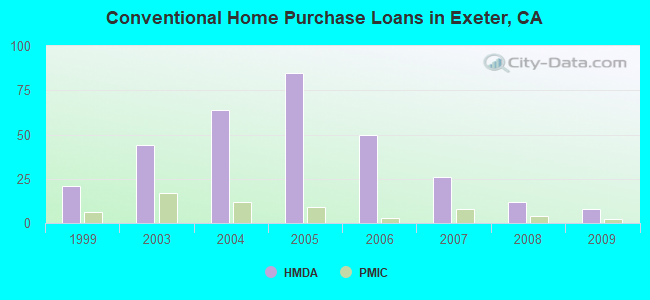
11 (See the full list of FAA Registered Aircraft)| Home Mortgage Disclosure Act Aggregated Statistics For Year 2009 (Based on 3 partial tracts) | ||||||||||
| A) FHA, FSA/RHS & VA Home Purchase Loans | B) Conventional Home Purchase Loans | C) Refinancings | D) Home Improvement Loans | F) Non-occupant Loans on < 5 Family Dwellings (A B C & D) | ||||||
|---|---|---|---|---|---|---|---|---|---|---|
| Number | Average Value | Number | Average Value | Number | Average Value | Number | Average Value | Number | Average Value | |
| LOANS ORIGINATED | 14 | $152,105 | 8 | $160,861 | 28 | $179,926 | 3 | $133,520 | 4 | $114,430 |
| APPLICATIONS APPROVED, NOT ACCEPTED | 1 | $159,560 | 1 | $93,720 | 4 | $194,188 | 0 | $0 | 0 | $0 |
| APPLICATIONS DENIED | 2 | $119,300 | 2 | $146,050 | 19 | $172,927 | 2 | $36,835 | 3 | $91,533 |
| APPLICATIONS WITHDRAWN | 2 | $166,815 | 2 | $99,705 | 7 | $187,711 | 1 | $323,050 | 2 | $99,540 |
| FILES CLOSED FOR INCOMPLETENESS | 0 | $0 | 0 | $0 | 2 | $165,395 | 1 | $21,910 | 0 | $0 |
Detailed HMDA statistics for the following Tracts: 0015.01 , 0015.02
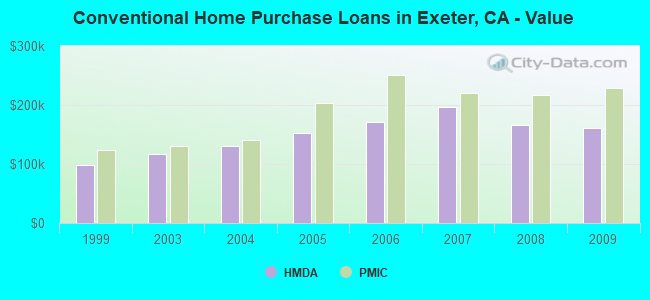
| Private Mortgage Insurance Companies Aggregated Statistics For Year 2009 (Based on 3 partial tracts) | ||||
| A) Conventional Home Purchase Loans | B) Refinancings | |||
|---|---|---|---|---|
| Number | Average Value | Number | Average Value | |
| LOANS ORIGINATED | 2 | $228,465 | 1 | $96,730 |
| APPLICATIONS APPROVED, NOT ACCEPTED | 0 | $0 | 1 | $109,540 |
| APPLICATIONS DENIED | 0 | $0 | 0 | $0 |
| APPLICATIONS WITHDRAWN | 0 | $0 | 0 | $0 |
| FILES CLOSED FOR INCOMPLETENESS | 0 | $0 | 0 | $0 |
Detailed PMIC statistics for the following Tracts: 0015.01 , 0015.02
2005 - 2018 National Fire Incident Reporting System (NFIRS) incidents
- Fire incident types reported to NFIRS in Exeter, CA
- 41750.3%Outside Fires
- 24829.9%Structure Fires
- 11914.4%Mobile Property/Vehicle Fires
- 455.4%Other
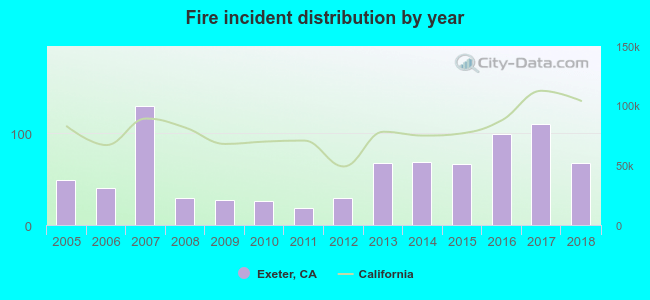 According to the data from the years 2005 - 2018 the average number of fire incidents per year is 59. The highest number of fires - 130 took place in 2007, and the least - 19 in 2011. The data has a growing trend.
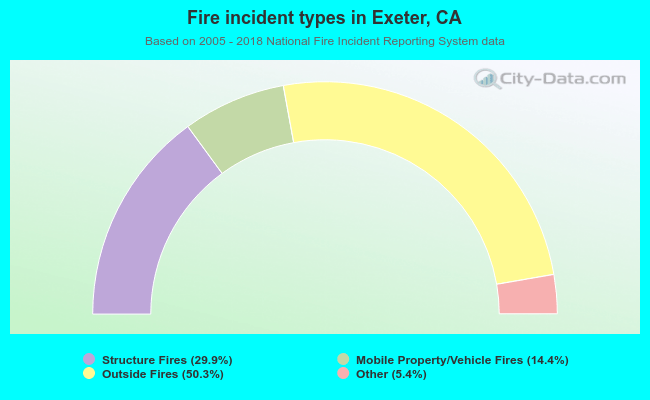 When looking into fire subcategories, the most reports belonged to: Outside Fires (50.3%), and Structure Fires (29.9%).
| Most common first names in Exeter, CA among deceased individuals | ||
| Name | Count | Lived (average) |
|---|---|---|
| John | 80 | 74.0 years |
| William | 67 | 75.2 years |
| James | 59 | 71.7 years |
| Mary | 57 | 79.3 years |
| Robert | 43 | 71.5 years |
| Charles | 37 | 74.5 years |
| George | 28 | 78.2 years |
| Ruth | 27 | 80.9 years |
| Dorothy | 25 | 78.8 years |
| Margaret | 24 | 81.2 years |
| Most common last names in Exeter, CA among deceased individuals | ||
| Last name | Count | Lived (average) |
|---|---|---|
| Smith | 39 | 75.6 years |
| Jones | 30 | 76.0 years |
| Johnson | 26 | 78.2 years |
| Miller | 19 | 76.3 years |
| Williams | 17 | 78.4 years |
| Brown | 17 | 76.1 years |
| Moore | 16 | 71.5 years |
| Anderson | 16 | 75.5 years |
| King | 15 | 75.6 years |
| White | 14 | 80.6 years |
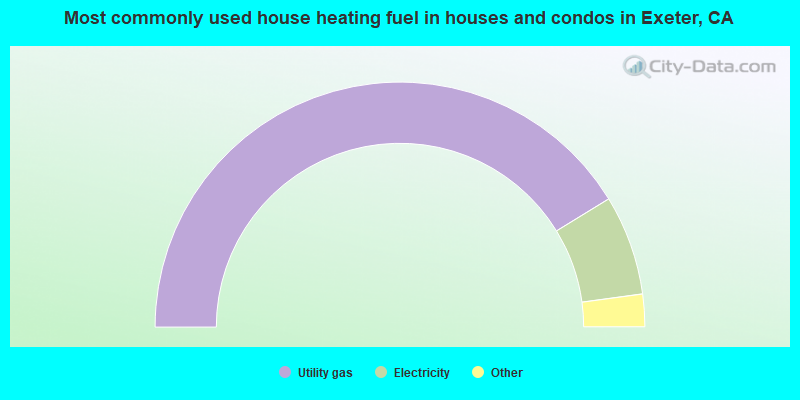
- 82.5%Utility gas
- 13.2%Electricity
- 2.3%Solar energy
- 1.0%Bottled, tank, or LP gas
- 1.0%No fuel used
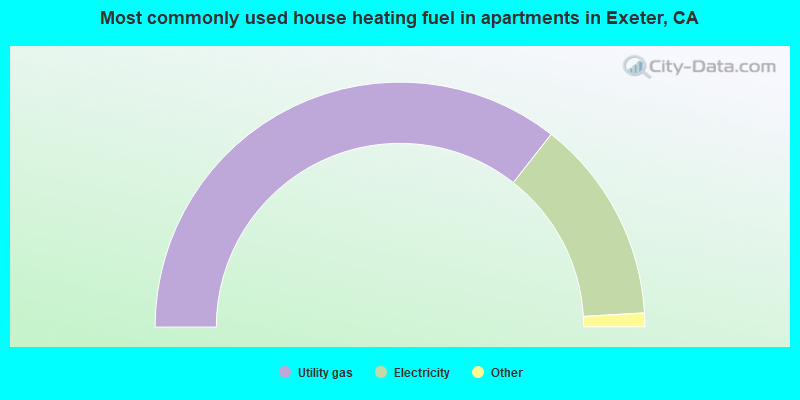
- 71.2%Utility gas
- 27.0%Electricity
- 0.9%Bottled, tank, or LP gas
- 0.9%No fuel used
Exeter compared to California state average:
- Median house value significantly below state average.
- Unemployed percentage below state average.
- Black race population percentage significantly below state average.
- Foreign-born population percentage below state average.
- Percentage of population with a bachelor's degree or higher below state average.
Exeter on our top lists:
- #77 on the list of "Top 101 cities with largest percentage of females in occupations: farming, fishing, and forestry occupations (population 5,000+)"
- #100 on the list of "Top 101 cities with largest percentage of females in industries: agriculture, forestry, fishing and hunting (population 5,000+)"
- #6 on the list of "Top 101 counties with the highest Particulate Matter (PM2.5) Annual air pollution readings in 2012 (µg/m3)"
- #7 on the list of "Top 101 counties with the highest Particulate Matter (PM10) Annual air pollution readings in 2012 (µg/m3)"
- #10 on the list of "Top 101 counties with the highest number of births per 1000 residents 2007-2013"
- #16 on the list of "Top 101 counties with the highest Ozone (1-hour) air pollution readings in 2012 (ppm)"
- #25 on the list of "Top 101 counties with the lowest percentage of residents relocating to foreign countries in 2011"

|
|
Total of 17 patent applications in 2008-2024.